Early Detection of SMPS Electromagnetic Interference Failures Using Fuzzy Multi-Task Functional Fusion Prediction
Volume 9, Issue 4, Page No 35-50, 2024
Author’s Name: Declan Mallamo*, Michael Azarian, Michael Pecht
View Affiliations
Center for Advanced Life Cycle Engineering, University of Maryland, College Park, MD 20742, USA
a)whom correspondence should be addressed. E-mail: dmallamo@umd.edu
Adv. Sci. Technol. Eng. Syst. J. 9(4), 35-50 (2024); ![]() DOI: 10.25046/aj090405
DOI: 10.25046/aj090405
Keywords: Prognostics Health Management, Functional Data Analysis, Electromagnetic Interference, Multitask Lasso Regression, Aluminum Electrolytic Capacitors

Export Citations
This study addresses the need for improved prognostics in switch-mode power supplies (SMPS) that incorporate electromagnetic interference (EMI) filters, with a focus on aluminum electrolytic capacitors, which are critical for the reliability of these systems. The primary aim is to develop a robust model-based approach that can accurately predict the degradation and operational lifetime of these capacitors under varying environmental conditions. To achieve this, the research employs a generalized state space averaging technique to simulate a population of impending degradation trajectories for the capacitors. Environmental and degradation effects are modeled comprehensively. Frequency-based test features are derived from the gain, control, and impedance transfer functions of the filter and SMPS. These features are fitted with b-spline functionals for resampling and subsequently analyzed using functional principal component analysis to project the data onto the principal modes of variation. The extracted features serve as inputs to a fuzzy multi-task functional fusion predictor, which estimates the state of health at critical frequencies. The effectiveness of this model-based approach is validated through extensive experimentation, demonstrating its potential to significantly enhance the predictive maintenance strategies for SMPS with EMI filters.
Received: 01 May 2024, Revised: 04 July 2024, Accepted: 05 July 2024, Published Online: 26 July 2024
1. Introduction
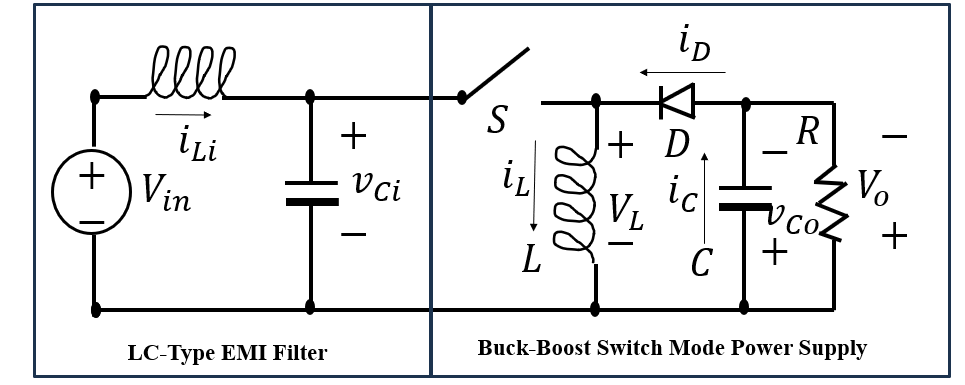
Switch-mode power supplies (SMPS) are an integral part of modern electronic systems, known for their efficiency and providing stable power supply across a variety of output levels using high-speed switching of transistors to regulate voltage and current. This switching action introduces electromagnetic interference (EMI) that is becoming more significant with high frequency operation [1]. This has created the need for input EMI filters to protect both the power line and the switch mode power supply. This EMI arises conductive, radiated, and near-field coupling of the created by resonant peaks in the frequency response, as well as switching transients caused by the closed-loop duty cycle corrections. In Figure 1, an LC-type filter is shown in-series with a buck-boost SMPS.
EMI-filtered closed loop SMPS with constant power and controlled output voltage or current are susceptible to a condition called negative input resistance, where increases in input voltage lead to decreases in input current. This creates oscillations that can destabilize the system, dampened out by the input filter capacitors’ equivalent series resistance (ESR). Aging or variability in electrical parameters can cause a cross-over of the SMPS input impedance and EMI-filter output impedance suddenly under certain operating conditions [2]. It has been found that many SMPS devices currently being utilized in industry, due to their nonlinear behavior, would fail to meet EMC standards without extensive up-stream filtering [3]. The Middlebrook criteria dictate that for a cascaded system, like that of an EMI-filtered SMPS, stability is maintained if the output of an upstream subsystem is less than the input impedance of the downstream subsystem, preventing oscillations and preserving electrical integrity. Typically, this cross-over occurs near the resonance frequency of the LC components of the filter, where the output impedance peaks, but at higher frequencies, with increased effects of the higher dv/dt and di/dt values, predicting the cross-over frequency range that leads to increased EMI using model-based becomes intractable.
The primary research objectives are to develop and validate parametric models for SMPS that integrate harmonic analysis and consider the degradation of both input and output filter capacitors. These models aim to precisely simulate the effects of aging and environmental variation on capacitor behavior, thereby enhancing our understanding of how such factors influence degradation. Utilizing this data, the study seeks to improve prognostic capabilities for SMPS by predicting potential failure points and frequency vulnerabilities. The effectiveness of these prognostic models will be assessed through a comparative analysis with existing predictive maintenance strategies. This analysis aims to demonstrate early detection and preemptive management of failures by identifying frequency ranges with the largest variation tied to the system degradation.
1.1. Literature Review
1.1.1. Methods of Assessing and Modeling Degradation and Reliability of EMI filtered SMPS
There has been a large amount of research into the aging effects on SMPS components and their effects on the overall frequency response of the converter. It was found that the degradation trajectory of the rise and fall time of a MOSFET switch followed random variation as a result of induced thermal aging [1, 2]. The main sources of electromagnetic emissions were the power MOSFETs, and leakage inductance from the main transformer [3, 4]. The output diodes and output inductor can also be considered as emission sources; however, they provide a more secondary contribution. Sensitivities created from passives parasitics in the printed circuit board and sub-components that require targeted identification to systematically mitigate potential causes of noise.
Several studies have found the output filter capacitor was identified as a main source of failure in SMPS that causes the increased noise and critically impacts the performance of the converter, resulting in increased stress on the peripheral components [5], [6], [7], [8].
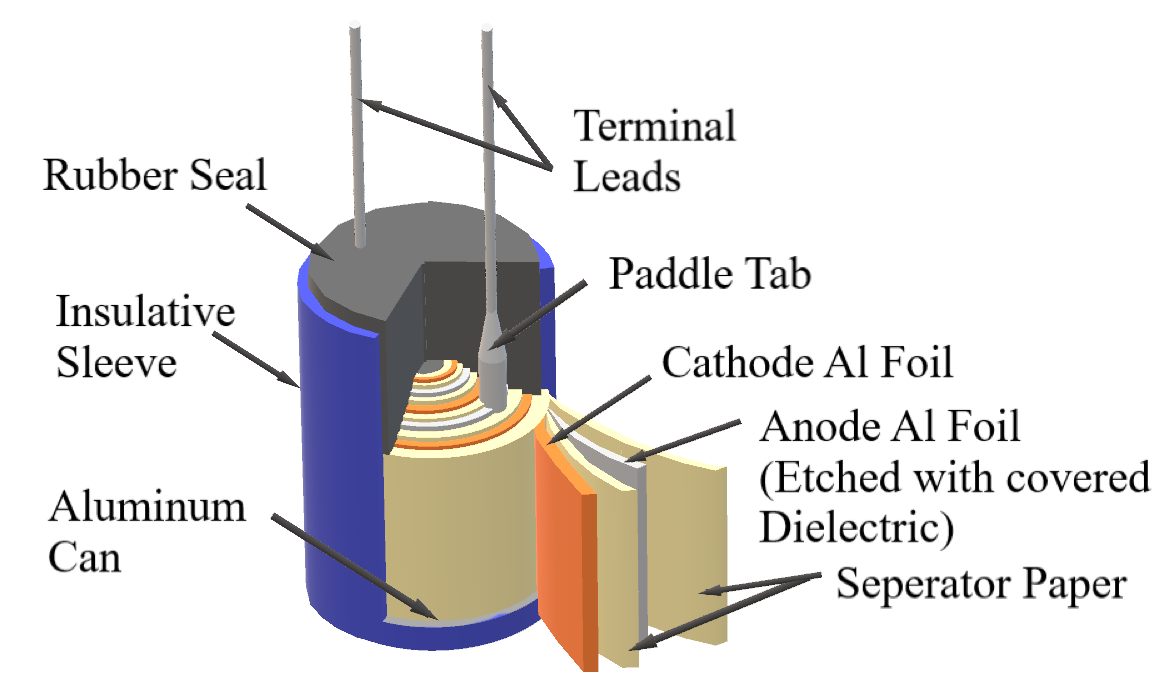
The studies have been conducted that provide in-depth insights into the degradation mechanisms of aluminum electrolytic capacitors under varying conditions, particularly highlighting their impact on the reliability of SMPS. A diagram of a typical Aluminum electrolytic capacitor can be found in Figure 2.
In [8], the author focused on the effects of thermal overstress noting that a reduction in electrolyte volume from evaporation directly decreases capacitance and increases ESR due to a shorter liquid path length. It showed that thermal overstress from storage beyond room temperature conditions significantly compromised their longevity and performance.
In [9], the author explained that models were created to address that over half of SMPS failures are attributed to output smoothing electrolytic capacitors and proposes new models to incorporate temperature variations to forecast degradation, influenced by time, core temperature, and operation frequency.
SMPS with EMI filters are increasingly analyzed with advanced mathematical modeling techniques and system optimization methods are often employed to understand system behavior comprehensively, leading to more effective design decisions. These traditional approaches can be extended from a holistic system perspective to optimize the overall system architecture [10]. These methods often require extensive modeling of each system component without necessarily focusing on reducing the experimental or simulation effort to only the most influential factors affecting system stability and performance.
In [11], the author proposed a genetic algorithm-based method for designing front-end rectifier inductors, taking into account the effects of DC link capacitors. However, the computational intensity of genetic algorithms poses limitations. These algorithms require significant computational resources and time, particularly as system complexity increases, which can limit their practicality in iterative design processes.
In continuous conduction mode, the switch remains closed long enough for the inductor current to never fall to zero, making the system’s behavior more predictable and easier to model using linear approximations [12]. In contrast, discontinuous conduction mode is characterized by the inductor current reaching zero within each switching cycle, which introduces non-linearities that are critical for understanding the SMPS performance under light load conditions [12], [13]. The integration of these modes into a unified model involves crafting state space analyses that capture the essential dynamics of the SMPS, including its susceptibility to noise and interference as influenced by the duty cycle variations.
These state space models elucidate the intricate output to input relationships within an EMI-filtered SMPS device, highlighting how variations in the duty cycle affect the overall stability and efficiency of the power supply. The transfer functions derived from these models are instrumental in predicting the system’s behavior in response to external disturbances and internal parameter changes.
To further refine these models and achieve a more generalized representation, generalized state space averaging (GSSA) methods are employed. GSSA is a technique that averages the various state equations over one switching period to produce a smoothed model, effectively managing the rapid switching characteristics of SMPS. This method simplifies the complex dynamics of switching power supplies into manageable forms, allowing for the integration of non-linear and dynamic aspects of the system into a coherent framework. By averaging the states, GSSA reduces the computational complexity and enhances the model’s ability to predict long-term behavior under a broad range of operating conditions.
1.1.2. Time and Frequency Stability Analysis Methods
Non-invasive online condition monitoring techniques for capacitors often utilize the spectral content of voltage and current, employing various approaches estimating ESR and capacitance with minimal error. While comprehensive, this analysis requires sweeping through a broad frequency range, which can be time-consuming and may not pinpoint the most critical frequencies causing instability in complex systems.
Additionally, AC analysis methods provide a robust framework for assessing the global stability of closed-loop systems by exploring the system’s behavior across a broad frequency spectrum. This analysis is critical as it helps identify resonance peaks, phase shifts, and gain changes, offering valuable insights into how the system responds to different frequency inputs and highlighting potential instabilities. Understanding gain and phase margins is pivotal in ensuring global system stability. Gain margin refers to the amount by which the gain of a system can increase before the system becomes unstable, while phase margin is the amount of additional phase lag required to bring the system to the brink of instability.
In [14], the author used frequency and time-domain methods to assess conducted emissions, focusing on the signal characteristics of SMPS emissions, which include a mix of medium- and high-frequency components and significant spectrum leakage. The study found that there is a need to tune and optimize these analytical methods to achieve reliable results. The Prony method tracks changes in amplitude at specific frequencies using the least squares approach, but this method requires a complete understanding of the frequencies associated with degradation for a global population of units. It has been shown that by understanding the specific EMI profile to be mitigated, selective trade-offs can be made to reduce the filter footprint, weight, and cost while maintaining performance [3].
1.1.3. Prognostic and Health Management Techniques
Accurately anticipating and addressing these shifts requires analyzing the impact of component degradation on the system’s performance. The prognostic and health management (PHM) system optimizes maintenance processes based on diagnostic and prognostic outcomes to prevent failures and enhance lifecycle management [8][15]. For SMPS, capacitance was identified as a suitable failure precursor for system failure [8].
Manufacturers often recommend a methodical approach for estimating the useful life of aluminum electrolytic capacitors using datasheet specifications. The rated ripple current, IAC, R at the capacitor’s maximum specified temperature is identified and the actual operating ripple current IAC is used to calculate their quotient. This ratio and the ambient temperature are used to estimate the capacitor’s remaining life by interpolating a given life expectancy graph and accounting for frequency variations from the standard test condition frequency, usually 100 Hz. [16].
A data-driven fault detection algorithm was introduced specifically designed for identifying failures in multilayer ceramic capacitors [17]. The algorithm utilizes regression analysis, residual detection, and prediction analysis to enhance the accuracy and reliability of fault detection. A key component of their methodology is the use of Mahalanobis distance for anomaly detection in the test data.
In [18], the author used accelerated life testing for aluminum electrolytic capacitors to evaluate how conditions such as electrolyte leakage can affect capacitance, quality factor, and dissipation factor. The study utilized statistical time-domain feature extraction and correlation-based feature selection to accurately monitor capacitor health and predict failures.
In [19], the author proposed a method that leverages noninvasive condition monitoring via time-frequency analysis of conducted EMI to evaluate the health of DC-link capacitors in three-phase inverters. This method involves a combined EMI filter and measurement board placed on the DC bus, which not only filters conducted EMI to comply with MIL-STD-461 G but also facilitates EMI measurements for condition monitoring. A continuous wavelet transform is used to create characteristic switching images, which are then used to train support vector machine (SVM) models to classify the health of DC-link capacitors into one of five stages with high accuracy. This approach uses broad-spectrum analysis, which may include frequencies that are not always relevant to condition monitoring.
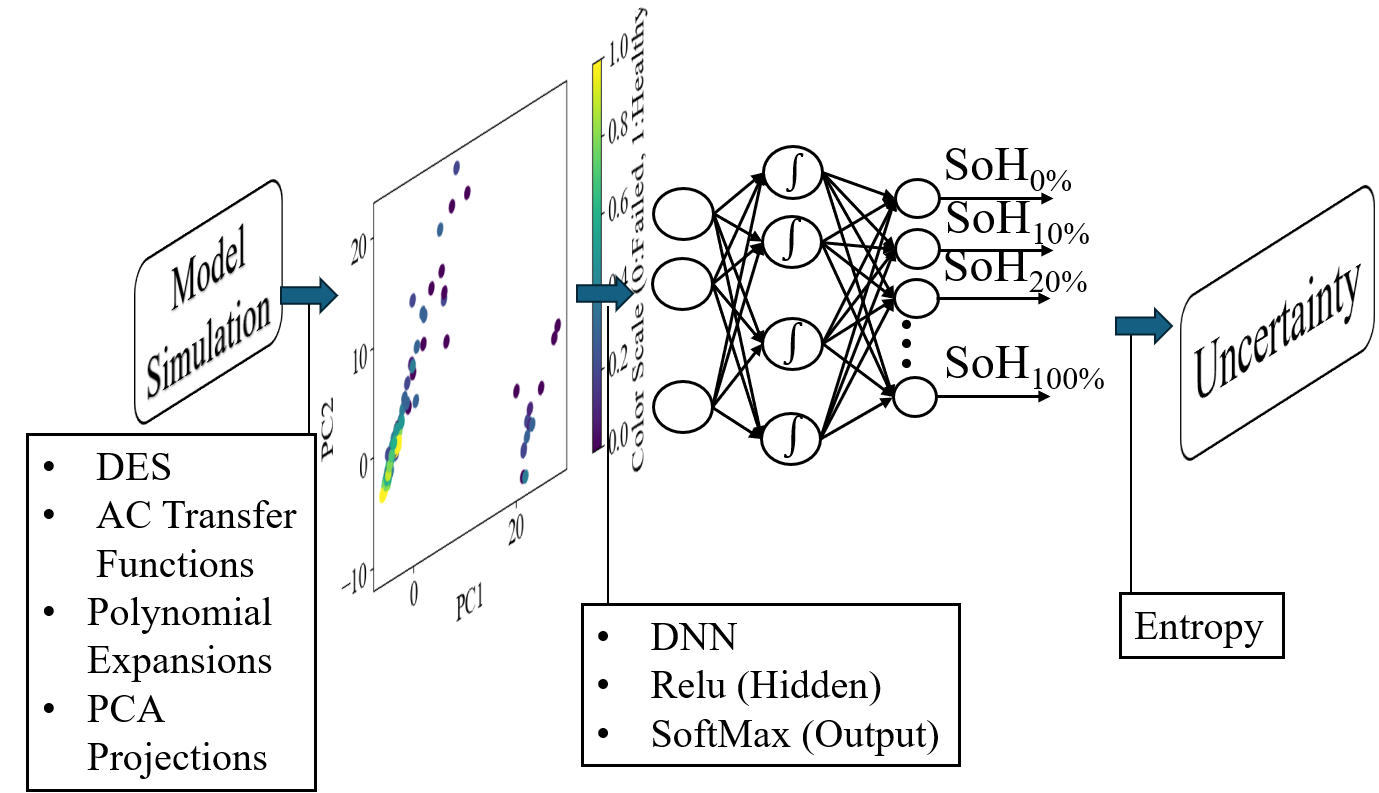
A PHM system was presented that is designed to preempt failures and enhance lifecycle management for insulated gate bipolar transistors [15]. This process is organized into three main stages: Observation, Analysis, and Action. The Observation stage involves monitoring and data processing, the Analysis stage includes health evaluation and future state forecasting, and the Action stage focuses on maintenance implementation based on assessments. To overcome challenges in detecting subtle degradation signals, Principal Component Analysis (PCA) is used for feature engineering to reveal hidden trends. These trends are then fed into a Deep Neural Network for classification, enhancing the system’s ability to detect and predict failures accurately.
A PHM framework was proposed to combine traditional model-based and data-driven approaches, utilizing extensive sensor data for remaining useful life predictions [11]. This approach is designed to analyze subtle time-series patterns in large datasets by treating sensor data as continuous random processes. These functional relationships can encapsulate a significant amount of variation information across different equipment in a compact, resamplable form. This capability to adapt to time-varying data makes the approach particularly useful for the EMI-filtered SMPS usage case.
Using multivariate functional relationships as predictors for state of health can alleviate big data concerns and can be further improved by sparsity-induced optimization methods, which learn multiple classification tasks while simultaneously performing feature selection. A method of multi-task feature learning, used for analyzing brain imaging data with varied functional data sets collectively, was developed to enhance predictability and accuracy [20]. This approach can be adapted to other domains, including the health monitoring of EMI-filtered SMPS, to improve the accuracy and efficiency of remaining useful life predictions.
1.1.4. Identifying and Addressing Research Gaps
Despite extensive research on degradation and failure mechanisms in SMPS, gaps remain in predicting system instabilities caused by frequency vulnerabilities. Traditional studies, which focus on component aging and electromagnetic emissions, often employ complex models that overlook critical frequency regions impacting system stability. Moreover, these models lack the interpretability necessary to identify how specific component degradations influence overall performance in frequency-sensitive scenarios.
To address these deficiencies, we propose an approach that utilizes multivariate functional analysis and multitask least absolute shrinkage and selection operator (LASSO) regression. This method transforms complex, high-dimensional datasets into manageable, infinite-dimensional functionals conducive to resampling. It significantly enhances model accuracy and robustness, allows for the learning of multiple classification problems simultaneously, and focuses specifically on identifying critical frequency vulnerabilities in SMPS.
By isolating specific EMI components and narrowing the analysis to essential frequencies, this approach not only reduces data complexity but also improves measurement precision and system stability. This targeted analysis streamlines research, boosts efficiency, and provides clearer insights into EMI behaviors, substantially enhancing system vulnerability assessments and predictive maintenance strategies.
1.2. Fuzzy Multi-Task Functional Fusion Predictors
This study aims to develop and validate an innovative prognostic framework that leverages discrete event simulation (DES) of the EMI-filtered closed-loop SMPS and degradation models of the EMI-filter input filter capacitor and SMPS output filter capacitor. The goal is to accurately predict the degradation and remaining useful life of aluminum electrolytic capacitors in electromagnetic interference filters of switch-mode power supplies, thereby significantly enhancing system reliability and performance.
The developed SMPS system prognostic approach, termed Fuzzy Multi-Task Functional Fusion Predictor (FMT-FFP), is an advanced predictive model that combines fuzzy logic with multitask LASSO regression and B-spline convolutional-integral-based cross-correlations, integrated through functional PCA for robust and precise state-of-health forecasting in complex systems, while preserving interpretability of the input features. For the given case study, the developed approach focuses on identifying the impact of critical frequency regions associated with the degradation trajectories of aluminum electrolytic filter capacitors within an EMI-filtered SMPS system.
Generalized state-space averaging models of the LC-filtered buck-boost SMPS are developed early on in the prototyping design phase to express the k-th order harmonic content and derive the output voltage to input voltage gain frequency response, the frequency response for the output voltage to duty cycle control transfer function, and the frequency response for the EMI filter output and SMPS input impedance.
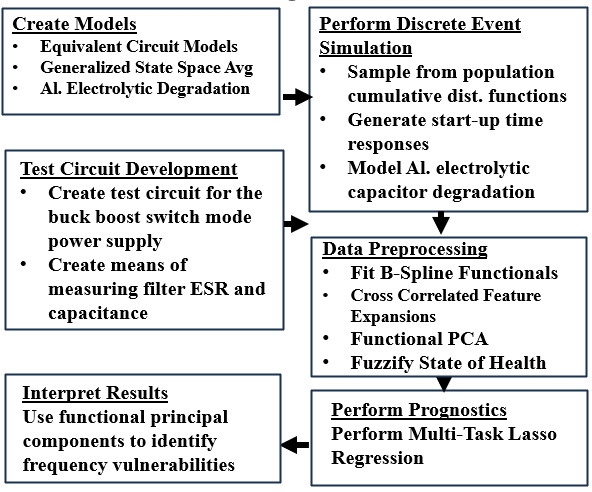
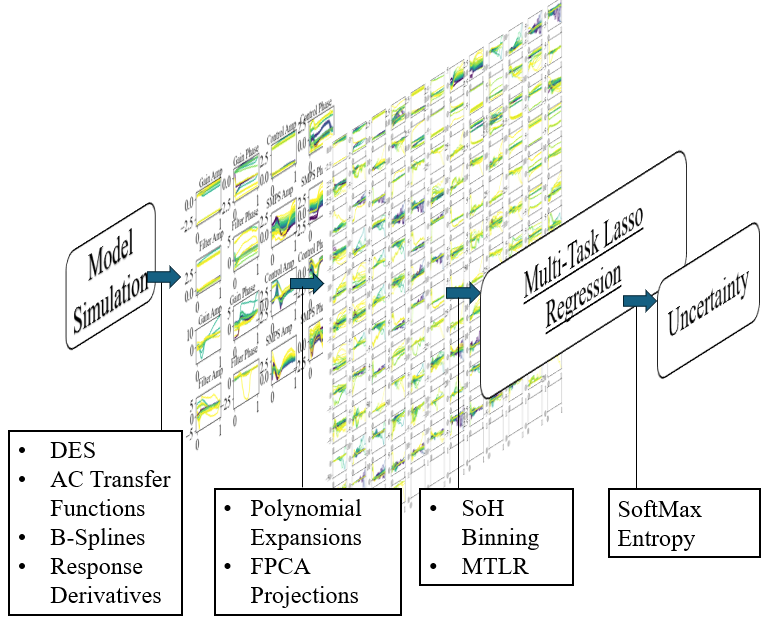
Once frequency responses for each test are collected, they are extended using convolutional integrals for each combination. Functional Principal Component Analysis (FPCA) is then used to perform dimensionality reduction and feature engineering to restrict the functional data to the principal variational modes. Multitask LASSO regression is employed to make probabilistic State of Health (SoH) estimations while identifying a sparse set of features associated with frequency-response criteria and ranges. An outline of the prognostic approach can be seen in Figure 3 below.
This study introduces a refined modeling approach tailored to the unique operational characteristics of SMPS with EMI filters. The key contributions of our research are threefold. First, a generalized state-space averaging model was developed to effectively capture the dynamic interactions within the SMPS and the input EMI filter, facilitating a deeper understanding of system behavior across varying operational states and filter capacitor degradation. This model is particularly adept at identifying critical frequency regions that directly impact the stability and efficiency of SMPS. Finally, the application of these advanced modeling techniques has led to the establishment of an efficient testing scheme. This scheme enhances traditional maintenance strategies by providing precise diagnostic capabilities that can preemptively address potential failures, thereby significantly improving system reliability and operational lifespan. Through these contributions, our research offers substantial advancements in the predictive maintenance and reliability assessment of EMI-filtered SMPS, ensuring more stable and efficient power supply systems.
The remainder of the report outlines the prognostic approach. Section 2 lays the theoretical groundwork, detailing the derivation of the generalized state-space model for the buck-boost SMPS, the discrete event simulation methodology used to create the training data, and how the probabilistic SoH estimations are converted into remaining useful life estimates. This section also elucidates the technique for identifying frequency vulnerabilities using the results of the Multitask LASSO Regression. Section 3 presents a buck-boost SMPS test fixture, featuring a microcontroller with proportional integral derivative (PID) control and voltage-based current sensors for the input filter and SMPS inductor currents. These sensors use a high-impedance, time-constant matching network for accurate current measurement and are used to collect impedance information. Section 4 presents the research analysis of the results and discusses any wider implications. Finally, in Section 5, a summary of the research findings and conclusions is provided.
2. Theory
In this research, the intricacies of EMI filter and SMPS In this research, the intricacies of EMI filter and SMPS design are addressed utilizing the generalized state-space averaging (GSSA) model. This modeling approach decomposes the state signals using Fourier analysis to account for the harmonic content evolution related to the effects of the switching frequency harmonics and the degradation effects in aluminum electrolytic capacitors within the SMPS and input filters. The analysis employs a buck-boost DC-DC SMPS topology with a general input EMI LC-type low-pass filter, as illustrated in Figure 1 in Section 1.
Parasitic resistances and losses, including the input filter inductor’s parasitic resistance, the equivalent series resistance (ESR) of input and output capacitors, and the copper losses in the SMPS inductor, are assumed. Additionally, inputs associated with the input voltage, forward voltage drops across the switching transistor and diode, and load current perturbations are considered.
This comprehensive approach allows for a detailed understanding of how various parasitic elements and operational parameters influence the performance and stability of the SMPS, thereby providing a robust foundation for predictive maintenance and reliability assessment.
2.1. State Space Averaging
The development of a linearized model for a SMPS with an EMI filter employs Kirchhoff’s Voltage Law across circuit loops, focusing on continuous conduction mode (CCM) operation. In CCM, the system oscillates between states of active switching transistor and conducting diode. By averaging these states, the model smooths out non-linear transitions due to the switch’s high slew rate, simplifying the analysis. By performing the nodal analysis and solving for the state time derivatives, state space representation of the EMI filtered SMPS can be found below in (1).
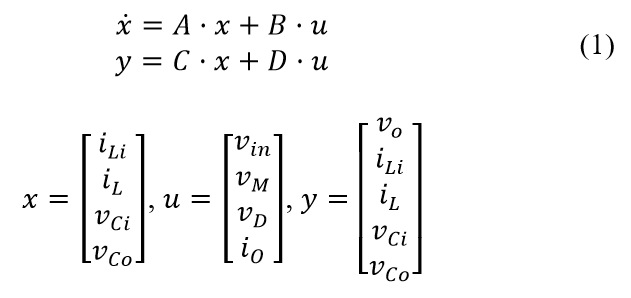
where x, u, y are the state, input, and output vectors, respectively, consisting of the input and SMPS inductor current, and , and input and output filter capacitor voltages, and , and input voltage, , switch and diode forward bias voltages, and , and load current perturbations, .
2.2. Steady State
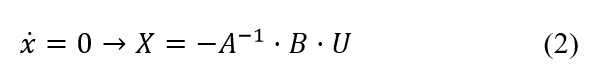
The steady state behavior is derived by setting the state derivative to zero and solving for the steady state response as shown in (2).
2.3. Linearization
Linearization is used to create a small-signal model that accounts for duty cycle perturbations and their interactions with state variables:
2.4. Proportional integral derivative Control Laws
The proportional integral derivative (PID) controller logic for the output voltage tracking objective can be below in (3).

The PID controller is formulated to manage output voltage deviations as follows in (4).
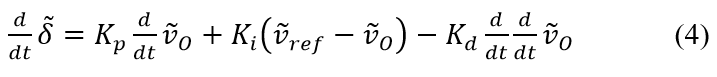
where are the respective proportional, integral, and derivative gains, the voltage reference input, , and the output voltage, . This differential form leverages linear relationships of state and input vectors to adjust the duty cycle dynamically.
2.5. Generalized State Space Averaging
Generalized state space averaging is applied to express the state as a sum of sinusoidal functions over one switching period, enhancing the model’s ability to capture the dynamic interactions within the SMPS and input EMI filter:
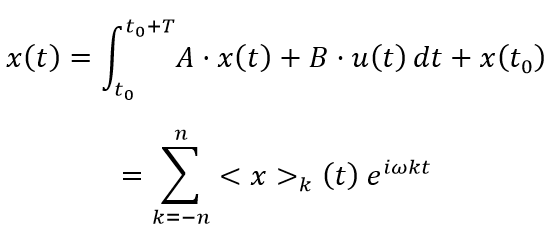
where ![]() is the angular frequency in terms of switching period, T. From the nodal analysis of the LC filtered buck boost circuit depicted in Figure 1, the original state space had four-states associated with each inductor current and capacitor voltage.
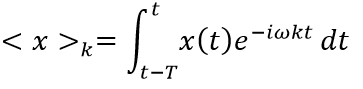
is the angular frequency in terms of switching period, T. From the nodal analysis of the LC filtered buck boost circuit depicted in Figure 1, the original state space had four-states associated with each inductor current and capacitor voltage.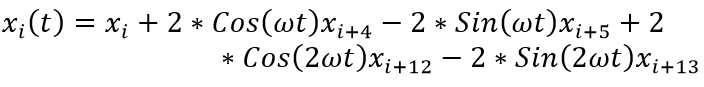 The x-coefficients are found from the real and imaginary component for each Fourier coefficient, <x>k , represents the amplitude of the k-th harmonic frequency component.
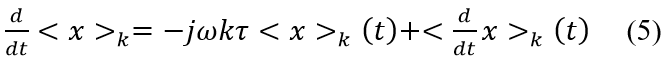
Using product rule and the chain rule, the expression for the time derivative of the Fourier coefficient is seen below in (5).
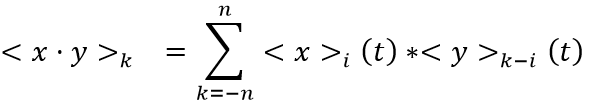
The k-th order convolution coefficient is found as the sum of the product of the Fourier coefficients of the two signals noting the ordering of the average subscript combinations.
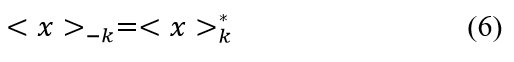
The negative k-th average harmonic relates the complex conjugate of the signal, seen below in (6).
2.6. Extracting Transfer Function Information
The use of analyzing AC frequency response features has long been used in insuring global stability of closed loop dynamic systems [2]. From linear systems theory, the complete family of output-to-input transfer function relationships can be found for a linear time-invariant multi-input multi-output dynamic system in state space representation can be found below in (7).
The output voltage to input gain, ![]() and control,
and control, ![]() are used to provide information concerning the different gain and phase margins which are measures of system’s stability. The EMI filter output impedance,
are used to provide information concerning the different gain and phase margins which are measures of system’s stability. The EMI filter output impedance, ![]() and SMPS input impedance,
and SMPS input impedance, ![]() are also used to evaluate the system’s dynamic stability relying on the Middlebrook criterion as a method to assess compatibility between the SMPS and the LC-input filter, taking into account the effects of negative incremental impedance on the constant power controller voltage buck-boost SMPS [2].
are also used to evaluate the system’s dynamic stability relying on the Middlebrook criterion as a method to assess compatibility between the SMPS and the LC-input filter, taking into account the effects of negative incremental impedance on the constant power controller voltage buck-boost SMPS [2].
2.7. Aluminum Electrolytic Degradation Models
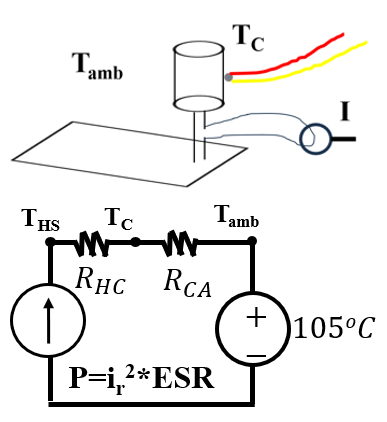
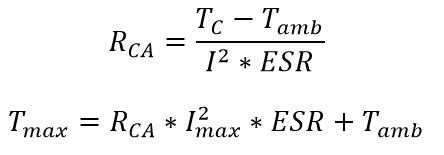
The longevity of aluminum electrolytic capacitors is chiefly compromised by electrolyte evaporation, a consequence of elevated operating temperatures and heat from ripple currents [8][9]. A thermal model, as shown in Figure 4, simplifies the system by considering the hotspot (THS) and case temperature (TC) to be approximately equal. This model integrates ripple current, capacitor ESR, and case-to-ambient thermal resistance, offering a streamlined approach to evaluating capacitor thermal behavior.
Models have been developed to account for the environmental and temporal degradation-based effects on an aluminum liquid electrolytic capacitor’s capacitance and ESR [9]. These models are contained in (8) and (9) below.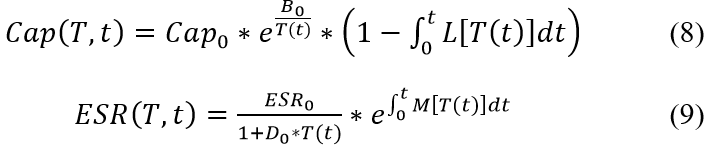 Models have been developed to account for the environmental and temporal degradation-based effects on an aluminum liquid electrolytic capacitor’s capacitance and ESR [9]. These models are contained in (8) and (9) below.
2.8. Discrete Event Simulation
A discrete event simulation (DES) was performed to model the degradation trajectories of aluminum electrolytic capacitors’ capacitance and ESR. The simulation initialized circuit attributes and parasitic elements with a 10% variation to mimic real-world deviations. Throughout the simulation, the duty cycle was dynamically adjusted based on PID control logic, targeting a 15V output from a 12V input overlaid with 10% white noise to represent input perturbations. An overview of the DES is depicted in the directed graph in Figure 5.
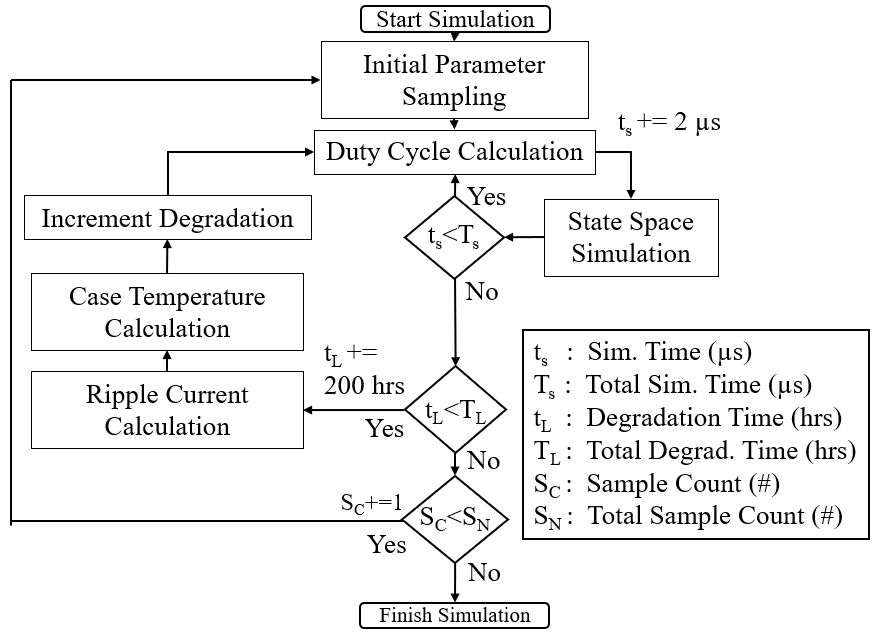
The lifecycle of three sample SMPS was simulated by analyzing startup transient responses in 2-microsecond increments over a span of 600 increments, achieving a steady state. At this steady state, the ripple current through each capacitor was calculated for every time response. This data was then applied to incrementally update the temporal degradation. The degradation cycle was advanced every 200 hours, continuing up to a maximum of 3000 hours or until a failure condition occurred. Failure was defined as an event where the output experienced an overshoot or ripple voltage exceeding 2 volts.
2.9. State of Health Prediction Methods
The following sections cover the derivation of the different prognostic approaches. The three methods focus on dimensionality reduction routines and extracting tacit information from time-series data.
2.9.1. Method 1: (PCA-DNN)
The first method involves reducing the high dimensional data using principal component analysis for feature engineering and a deep neural network for classification of the state of health (SoH) into probabilistic fuzzy estimations.
2.9.1.1. Feature Engineering with Principal Component Analysis
The features from the AC analysis create a high dimensional data set that captures the underlying behavior but are too complex for efficient analysis. Principal component analysis (PCA) is a statistical technique that reduces the dimension of the data while preserving most of the variation by identifying correlations within the data using a covariance matrix, seen below.
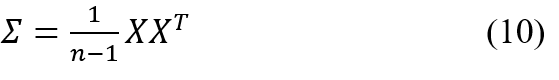
Eigen analysis is used to create synthetic variables that are linear combinations of the original features.
These variables can be truncated to only include the most significant details of the variation in the original data.
2.9.1.2. Neural Networks
The reduced-dimension PCA output data serves as an input to the first layer of a deep neural network (DNN). A neural network is composed of layers of neurons that take a linear combination of inputs, x, assigns a respective weight to each input, w, and a bias, b, and applies an activation function, .

A common activation function used for the hidden neurons is the ReLu function which adds non-linearities into the model to help learn complex patterns.

To create the binned state-of-health probabilities in the output, a SoftMax function is used which normalized exponentials to create a probability distribution.
The PCA/DNN pipeline for the AC analysis feature data can be seen in Figure 6.
2.9.2. Method 2: CWT-SVM
Continuous Wavelet Transforms (CWTs) are useful in analyzing time signals that exhibit non-stationary behavior. Such as state of health classification [19]. The time and frequency analysis capability of the CWTs make them ideal at analyzing state-of health effects from harmonics associated with the interactions between the output of the LC-type input EMI-filter and the input of the closed-loop SMPS.
2.9.2.1. Continuous Wavelet Transform
The CWT formula used in this report can be found below in (14).
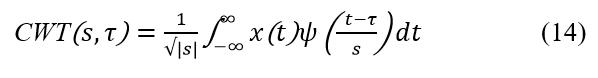
where, is the wavelet function, s adjusts the wavelet’s width and translates the wavelet thereby affecting time resolution.
2.9.2.2. Support Vector Machine
The CWT is utilized to analyze the time-frequency characteristics of the system’s output voltage. This analysis generates a high-dimensional image array, capturing intricate time-scale variations within the signal. These image arrays serve as the input for a Support Vector Machine (SVM), a powerful machine learning technique used for classification tasks. SVM operates by identifying optimal boundary support vectors among the data points that represent different classes. It constructs a hyperplane that maximizes the margin, which is the distance between the nearest data point of each class and the hyperplane itself. This maximization is crucial as it contributes to the robustness of the classification against new data. The objective function of SVM is formulated to minimize:

where wd is the normal to the hyperplane. SVM uses constraints to ensure that all data points correctly classify by maintaining a distance from the hyperplane: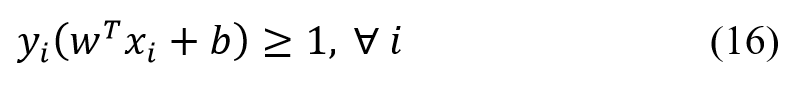
where wd is the normal to the hyperplane. SVM uses constraints to ensure that all data points correctly classify by maintaining a distance from the hyperplane:

To assist in creating separability in the data, a radial basis function is used, that measures the similarity between the data points.
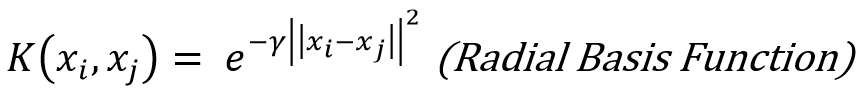
Using the kernel trick changes the constraints to the following form: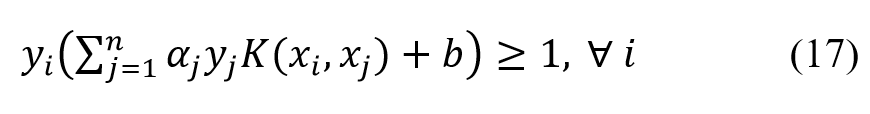
where are Lagrange multipliers, which are optimized during training.
A diagram of the CWT-SVM methodology can be found in Figure 7, illustrating how time series data from the output voltage is processed into CWT image arrays. These arrays are then used as inputs to the kernel SVM, which classifies the system’s state based on learned patterns from the training phase.
2.9.3. Method 3: Fuzzy Multi-Task Functional Fusion Predictors
The fuzzy multi-task fusion predictor uses b-spline functional curves to form versatile low dimensional representations of the AC frequency features created from the transfer function representations. The method creates fusion between the signals by extending the features using convolution integral-based cross-correlations and multi-task learning with LASSO regression to identify a sparse subset of test conditions conducive to increasing the performance of the prognostic.
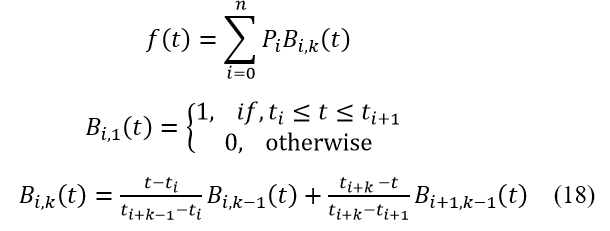
2.9.3.1. B-Spline Resampling
B-spline interpolation resamples time series data to a standard temporal scale, utilizing piecewise polynomials defined over specific intervals as can be found below in (18).
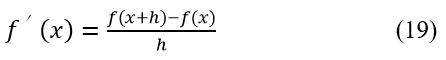
2.9.3.2. Extending the Features using Derivatives
Derivatives of the gas path parameters are approximated using the forward finite difference method to enrich the feature set, enabling more detailed analyses.
2.9.3.3. Generating Cross-Correlated Features Expansions
The individual AC features can be extended using polynomial expansion of the discrete AC waveforms and their derivatives using the expression below in (20) used to calculate the convolution integrals between two signals:

where f and g represent different AC transfer functions, represents a shift in the frequency domain, and , and is the signal frequency.
2.9.3.4. Functional Principal Component Analysis
It is possible to extract functional principal components from the functional b-spline representations of the extended states, paralleling how PCA extracts the primary variational modes from discrete multivariate cross-sectional data. This is achieved by using the inner product to generalize the multivariate principal component eigen analysis problem.
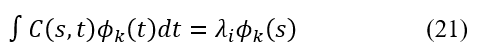
where are principle components selected from a selected from infinite set, are the sorted eigenvalues and serves as an empirical covariance function given in the following form below.
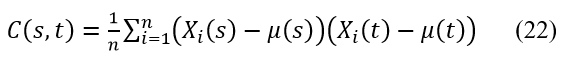
where consists of a vector of observed functional data (i.e., curves and spectra), is a mean function estimated from the data, and s and t are different points across the sample curves.
2.9.3.5. Functional Data Projections
The ith-observation within the data can be projected onto the most significant functional principal components, to summarize the principal variational aspects of the functional signal while preserving essential patterns and trends:

2.9.3.6. Creating probabilistic State of Health Estimations
State of health estimations are represented probabilistically, converting crisp inputs into a binned format to facilitate uncertainty analysis and enhance model explainability. The crisp inputs were converted to 10-bins that make up the sequential values between 0 and 1.
![]()
2.9.3.7. Predicting State of Health using Multi-Task LASSO Regression
Multi-task LASSO regression is utilized to predict state of health by exploiting commonalities across tasks and applying L1 regularization for effective feature selection. Shared information among different tasks is used to create SoH estimations that are robust to individual feature anomalies by minimizing the following cost function:

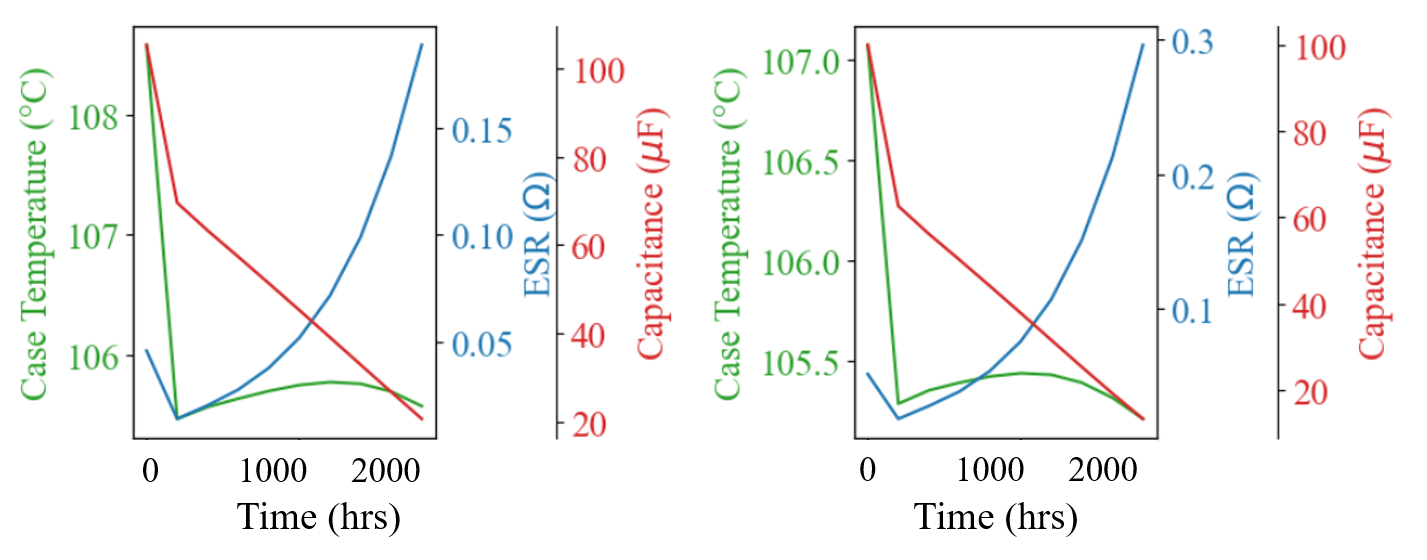
Multitask LASSO regression employs L1 regularization to promote sparsity across different tasks by zeroing out certain predictor weights, ideal for handling high-dimensional datasets. This method computes the state of health by aligning predictor weights to minimize the root mean square error (RMSE) between the predicted and actual health states. The resulting predictions are then processed through a SoftMax function, in (26) below, to generate probability density functions, enhancing the interpretability of the model’s outputs.
2.9.3.8. Developing Measure of Uncertainty using Shannon Entropy
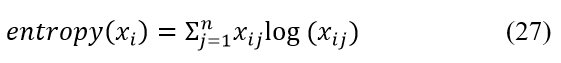
The Shannon entropy function is used to quantify the expected information contained in a random variable or distribution, with higher entropy values indicating more unpredictability or disorder within the distribution. Equation 27 below has the i-th samples entropy calculated using the state of health probabilities.
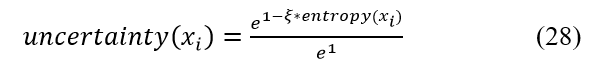
A scaling is applied to the entropy function to create a more discernable measure of uncertainty,
2.9.3.9. Predicting Remaining Useful Life from State of Health and Usage Time.
A composite function in (29) is used to predict the remaining useful life of a system based on its current State of Health (SoH) and accumulated Usage Time (UT).

2.10. Comparative Analysis of Methods Using Error-Based Performance Metrics
In this study, we assess three distinct methods for predicting SoH and the remaining useful life (RUL). The primary metric for evaluating the accuracy of these predictions is the RMSE of the output voltage compared to the reference voltage, as defined in (30):
Additionally, uncertainty measurements play a crucial role in understanding the reliability of each method’s predictions. Binned probabilistic measurements of SoH have underlying uncertainty that can be used to compare the methods. By quantifying the probabilities of different SoH states, we can gauge the confidence level in the predictions made by each method.
3. Simulation
The simulation was run according to the diagram in Figure 5 using the variables for the circuit, and degradation models found below in Table 1.
Table 1: Simulation parameter values and ranges
| Initial Electrical Parameter Selections | |||||
| Ci, Co | rCi, rCo | Li | L | rM, rD, rLi, rL | |
| 0.1±0.02 mF | 0.1±0.02 mF | 10.0±2.0 µH | 2.4±0.2 mH | 0.1±0.04 Ω | |
| Aluminum Capacitor Degradation Model Parameters [al elct testing report] | |||||
| A0 | Ea1 | Ea2 | B0 | C0 | |
| 3.462M | 0.773 | 0.694 | -111.8 | 3.999M | |
| D0 | Cap0 | ESR0 | RCA | kb | |
| 0.407m | Nominal Ci, Co | Nominal rCi, rCo | 100°C |
8.6173 eV/K |
|
| Simulation Parameter Selection | |||||
| ts | tL | Ts | Tc | TM | |
| 0.1±0.02 | 0.1±0.02 | 10.0±2.0 | 2.4±0.2 | 0.1±0.04 | |
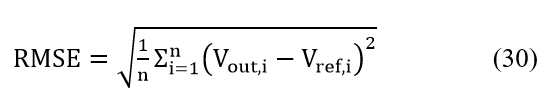
The data was collected and assigned a state of health label. The output voltage time response for a sample unit can be seen in Figure 9 below. As the degradation in the input and output filter progresses it causes parametric shifts that affect the ripple characteristics of the SMPS device.
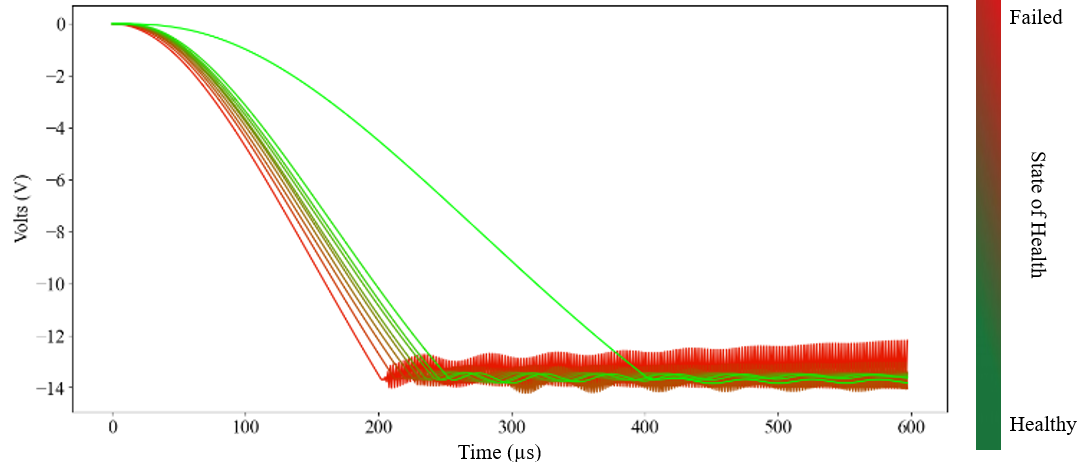
Using the state derivative information, the ripple current over the capacitors can be reconstructed, seen below in Figure 10, and used to calculate the estimated case temperature that is then used to dictate the degradation of the capacitors’ capacitance and ESR.
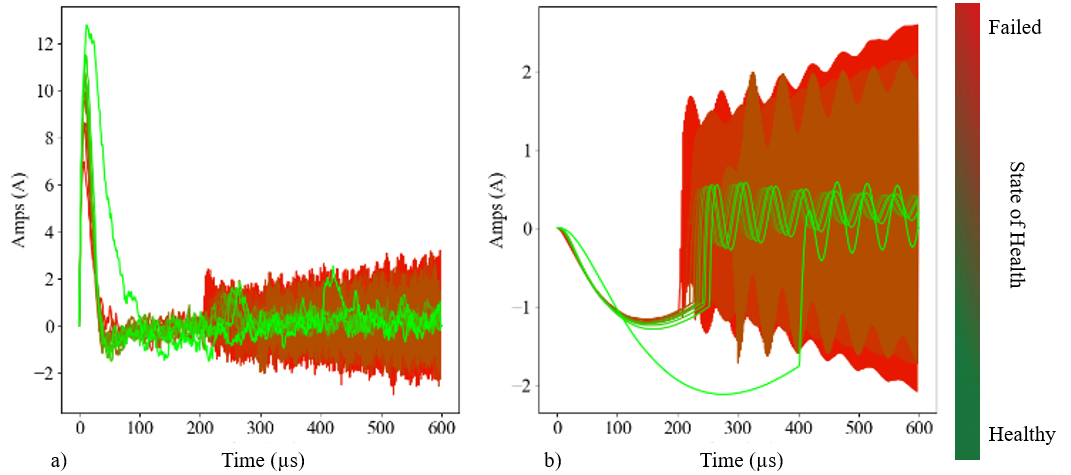
The case temperature, ESR, and capacitance and ripple for the sample device can be seen below in Figure 11. The device is utilized in an ambient temperature of 105°C which creates environmental effects on the capacitance and ESR by causing the aluminum and film layers to be more closely packed with higher temperature. Over time degradation is associated with electrolytic liquid drying and temperature effects which causes capacitance to decrease and ESR to increase.
4. Results
The following section presents visual representations of input feature samples for each of the three methods, followed by graphs illustrating the SoH and RUL estimates with calculated uncertainty. It concludes with a comparison of each method’s performance through tabulated error metrics, providing a clear evaluation of their predictive accuracy.
4.1. Visualization of Reduced Dimensional Features
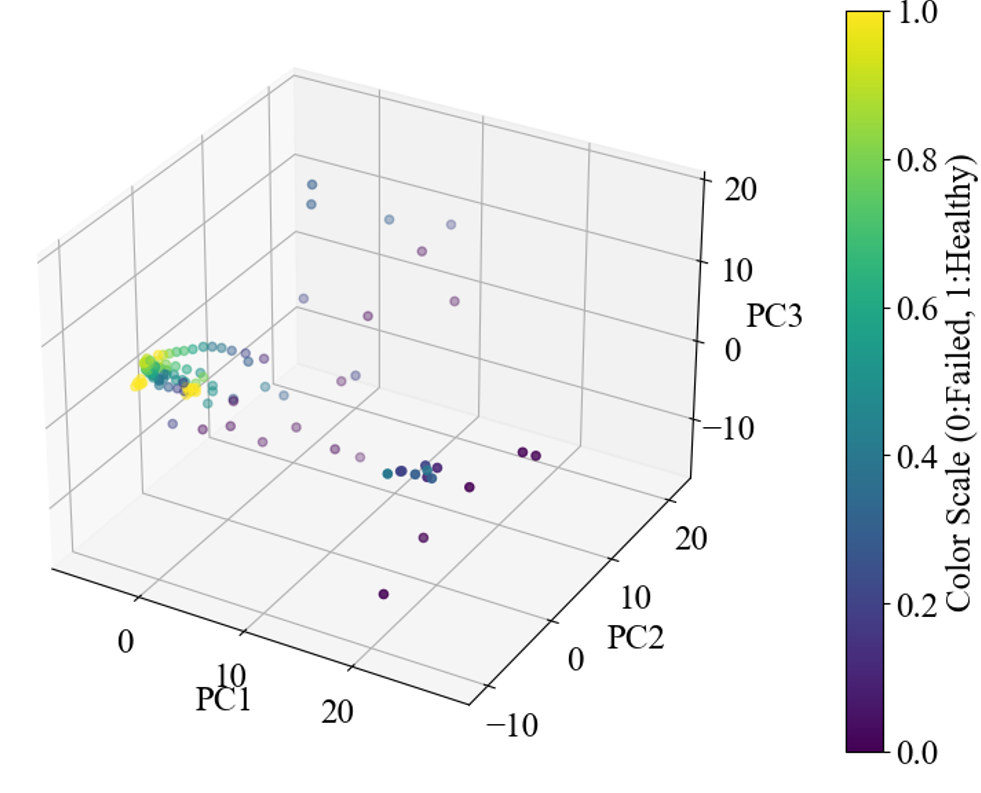
The PCA-DNN method employs Principal Component Analysis (PCA) to reduce high-dimensional data to three principal components, focusing on capturing the most critical variances. This streamlined data set forms the basis for further deep neural network analysis, ensuring that essential features are retained while excluding less informative variables.
Figure 12 displays a 3D scatter plot of the reduced-dimensional features. This visual representation plots each observation according to the three principal components, helping to elucidate the data’s underlying structure and highlighting potential patterns or anomalies within the reduced feature space.
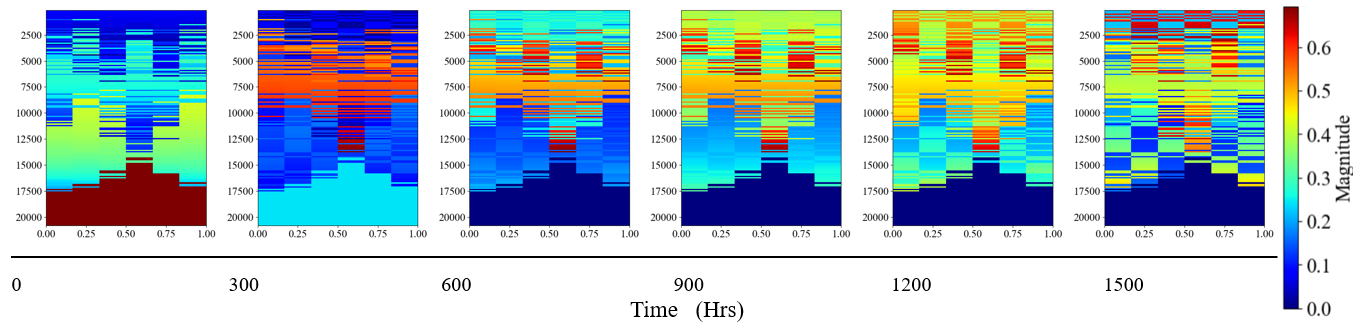
The CWT features are visualized through a set of heatmaps, representing the CWT magnitudes, ranging from 0 to 1600 hours, seen below in Figure 13. Each panel represents a distinct time slice showing the frequency content of the data evolves, revealing changes in signal properties due to operational impacts like aging or wear. By examining these patterns, you can detect critical events or degradation, aiding in predictive maintenance and system monitoring.
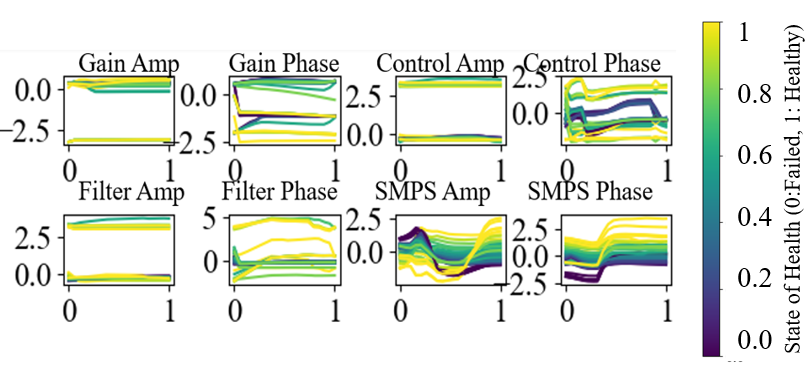
The FMT-FFP method sample input features are shown in Figure 14 showing amplitude and phase responses for gain and control transfer functions and EMI Filter output, and SMPS input impedances. The magnitudes are standardized and domain normalized, ranging from 0 to 1. Each colored line represents variable conditions, highlighting the dynamic interactions within the system.
The state of health (SoH) classification methods outlined in Section 2 were applied to the data and the results can be seen below in Figure 15. For inputs into the respective method, extended AC features were used for the PCA-DNN and FMT-FFP routines and the raw output voltage time-response features were used for the CWT-SVM method. The predictions for the binned state of health outputs were turned into probability density functions (greyscale in the plot) using the SoftMax function and the uncertainty formula was used to create a set of empirical confidence intervals for each of the SoH estimates (in red).
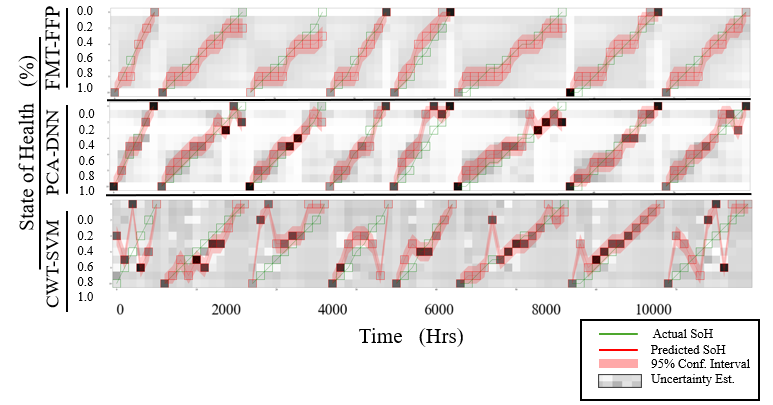
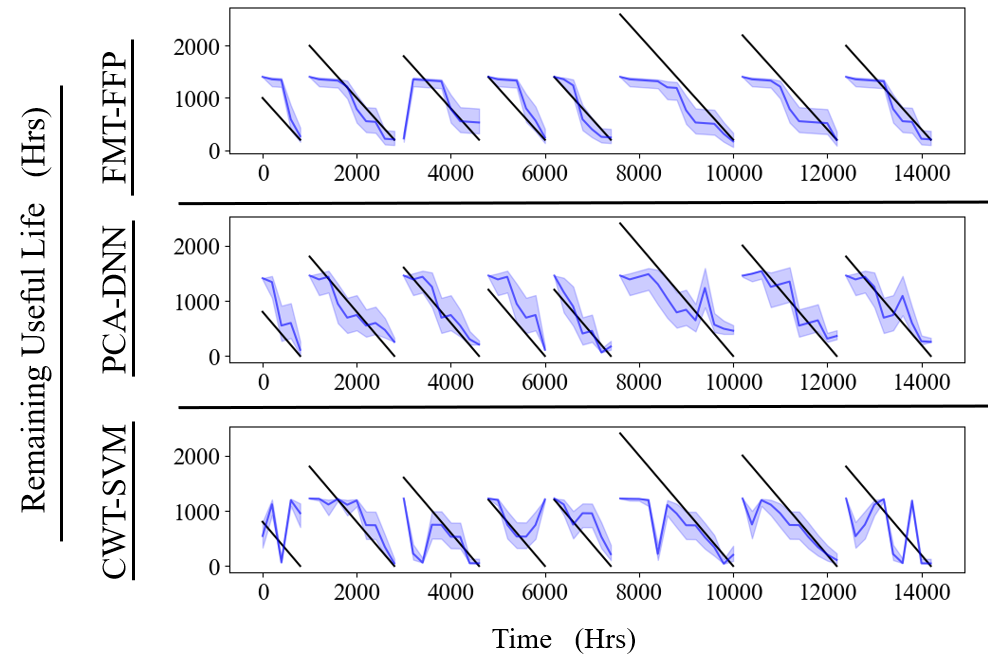
The SoH estimates were used as inputs into the RUL calculation given in Section 2, and the results can be seen for each method in Figure 16. The plot compares three methods for predicting RUL of components: FMT-FFP, PCA-DNN, and CWT-SVM. Each model’s predicted RUL is plotted against the actual RUL over time.
The FMT-FFP method shows decent trend following with moderate prediction uncertainty that increases as RUL decreases. The PCA-DNN method exhibits tighter confidence intervals close to the end of life for each component but suffers from misalignments during mid-life usage predictions. The CWT-SVM has the widest confidence intervals indicating higher uncertainty and shows considerable fluctuation, suggesting sensitivity to noise.
All methods struggle with long-term predictions, reflected by widening confidence intervals over time, but the FMT-FFP has the most predictable temporal behavior which resulted in a monotonically decreasing SoH estimate and bounds. The variability in prediction accuracy at different life stages suggests that combining models or refining calibration might yield better results. No single method consistently outperforms the others across the entire lifecycle. The RMSE error for both the SoH and RUL estimate can be found in Table 2 below.
Table 2: RMSE values for the separate methods found in the literature compared to the proposed method.
|
SoH (%) Training |
SoH (%) Testing |
RUL (Hrs) Training |
RUL (Hrs) Testing |
Ref | |
| FMT-FFP | 0.176±0.032 | 0.108±0.047 | 395.6±29.5 | 366.3 ±37.7 | 8 |
| PCA-DNN | 0.098 ±0.047 | 0.129±0.414 | 377.9±55.26 | 388.2±56.6 | 8* |
| CWT-SVM | 0.181±0.029 | 0.250±0.014 | 4501.7 ±23.0 | 569.8 ±14.12 | 3* |
Each method has its own benefits that are difficult to compare quantitatively. The PCA-DNN method can establish nonlinear trends in the data that provides superior predictive capability but would be difficult to interpret without additional approaches to interrogate the activated weight paths that lead to predictions with low uncertainty, and increased performance. The CWT-SVM method benefits from the fact that it uses an output voltage signal for feature generation and requires minimal testing compared to using the AC response features. This led to increased uncertainty in the SoH estimations that translated to misalignments in the RUL curves.
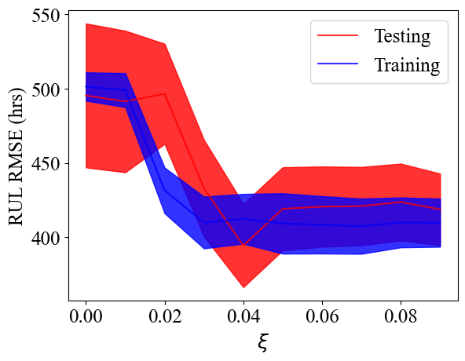
The performance of each method generally improves with more data, however the PCA-DNN is subjected to the vanishing gradient phenomena where over training causes initial weights to trend towards zero, and the CWT-SVM has hyperparameters associated with the chosen kernel that could lead to overfitting. The FMT-FFP method has a regularization parameter associated with the MTLR objective functions that was found via grid search and -hyperparameter that scales the entropy in the uncertainty function that was found using k-fold cross validation, the results of which are in Figure 17.
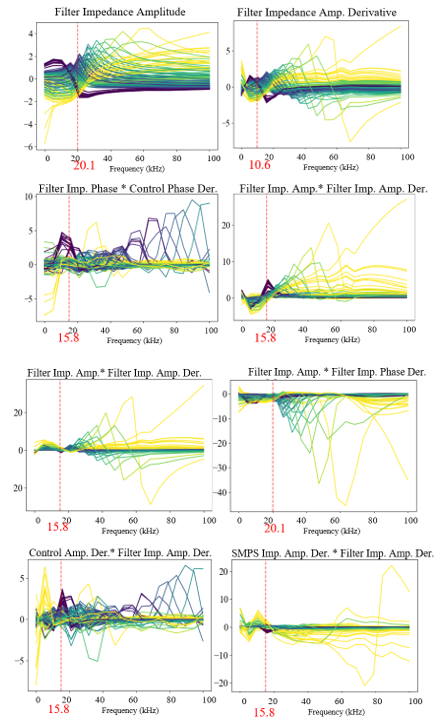
The FMT-FFP method provides the most explainable results in that the selected features are associated with specific frequency points in the AC-response information, found in Figure 18.
These points are found to be in line with the second harmonic of the switching frequency (10 kHz) and a value of 15.8 kHz which is consistent across several of the features. This allows for a targeted data sampling routine that that does not require data collection over the full frequency range.
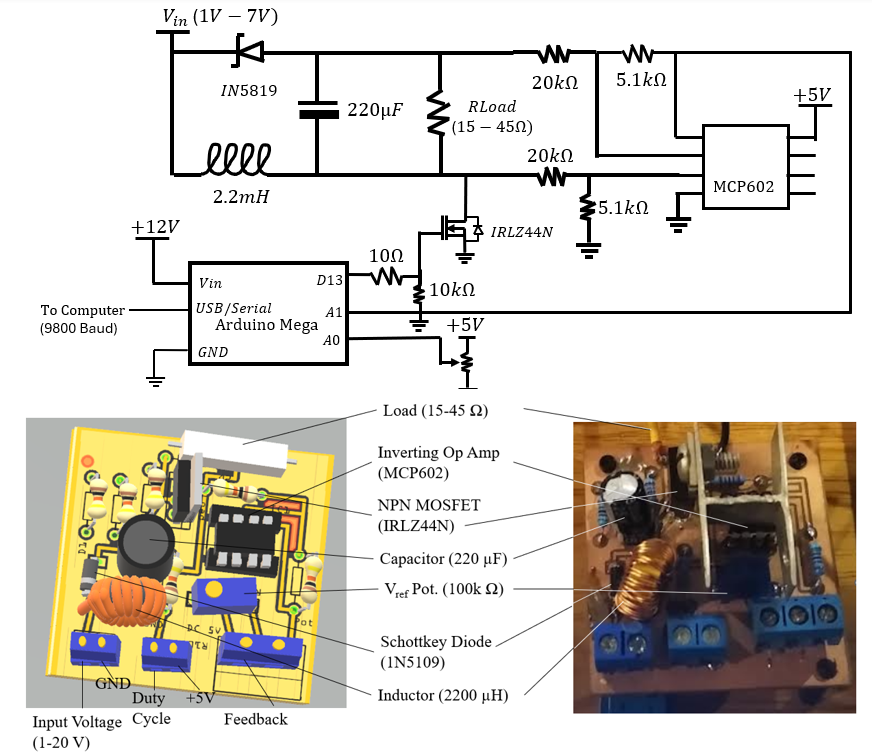
4.2. Data Validation using the test circuit
To validate the developed prognostic, a test circuit apparatus was built shown in Figure 19 was used to simulate degradation. The results of the output filter capacitor ESR degradation trajectories show a mean response of 0.1-0.3 ohms over the lifetime of the component and for the input filter and mean ESR degradation trajectory going from 0.05 to 0.15. Using parallel circuit arrangements, a digital potentiometer to vary a resistance in-series with each capacitor. This effectively created a means of simulating the ESR degradation, ignoring the effects of the diminished capacitance seen in the simulation results.
4.3. Using a test circuit for validation
The FMT-FFP method was validated using a test circuit, designed with features selected via multi-task LASSO regression. The circuit components include a 2.7mH inductor, a 220µF capacitor with 7.6 ohms series resistance, an IRLZ44N NPN MOSFET, and a 1N5109 Schottky diode. An MCP602 operational amplifier is also employed in a differential topology for voltage scaling.
The frequency features for the validation were taken from a subset of AC features identified from simulation results and used to train and validate the prognostic method. ESR degradation trajectories where modelled using a 15Ω rheostat modulates ESR degradation from the nominal 7.6 Ω to 22.6 Ω using a similar exponential relationship to that identified in Figure 10. The procedure generated a comprehensive dataset for testing.
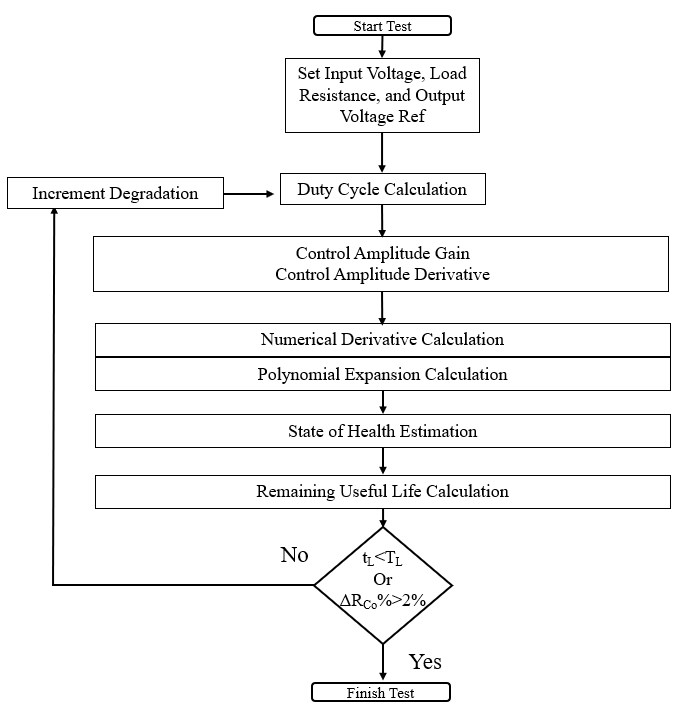
A power voltage divider circuit was used to generate the AC response features, by exciting the input signal at specific frequencies identified through simulation. The process was streamlined by limiting measurements to control amplitude gains, derived by dividing the output voltage gain by the duty cycle gain for a given input disturbance. This was chosen because only a reading of the output voltage, and a readily available duty cycle value are required. The control amplitude measurements were enhanced with numerical derivatives at ±2kHz and further extended via polynomial expansion. The overall approach to generating the features can be seen in the diagram in Figure 20.
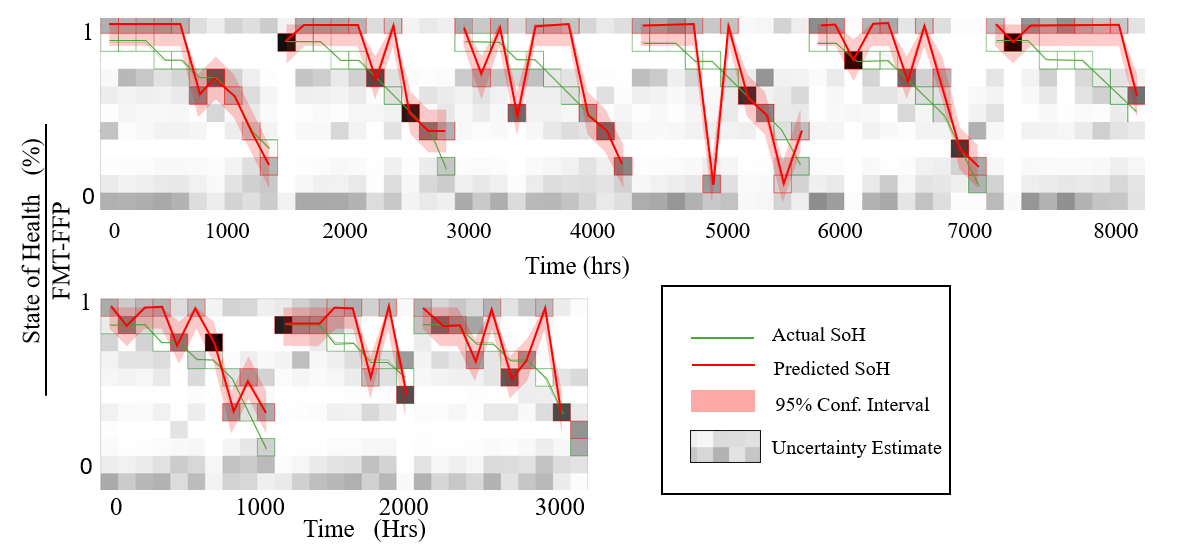
The data were standardized and split into training and testing subsets and multi-task LASSO regression was used with grid search on the λ-value to derive state-of-health probabilities and uncertainty measures, seen in Figure 21.
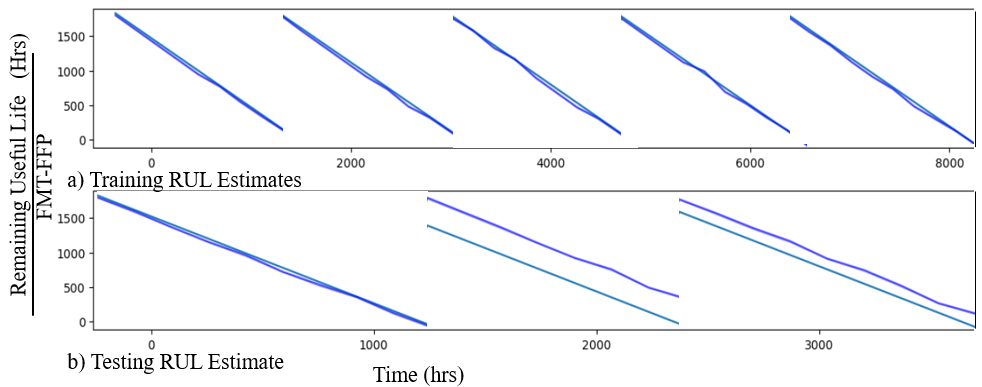
The training state of health RMSE error was found to be 1.99 +/- -0.07 and the testing RMSE error was 1.61 +/- 0.05. The state of health and usage time where combined using equation 30 to form the following RUL predictions seen in Figure 22. The training remaining useful life RMSE error was found to be 68.55+/- 0.73 and the testing RMSE error was 224.96+/- 1.89.
5. Discussion
This This research introduces a novel Fuzzy Multi-Task Functional Fusion Predictor (FMT-FFP) method for predicting Remaining Useful Life (RUL) that takes into account prediction uncertainty and incorporates multivariate functional fusion of the AC analysis raw data. The accuracy of the FMT-FFP method is improved by using functional principal component projections to handle noise that would otherwise reduce the model’s effectiveness. The method can be generalized across different systems and conditions to account for specific failure scenarios.
The FMT-FFP method is not as sensitive to the choice of hyperparameters compared to more black-box methods, making it conducive to practical implementation across varied contexts to provide domain knowledge of impending failure modes. Experimental validation has shown that the FMT-FFP framework can be used to monitor systems in real time, providing timely insights into system health and potentially averting failures before they occur.
Comparison analysis shows that the FMT-FFP method performs well against more black-box methods of prediction, such as the PCA-DNN and CWT-SVM approaches. This comparative analysis highlights the robustness and practical applicability of the FMT-FFP method in diverse operational scenarios.
6. Conclusion
This research aims to advance model-based design strategies for power electronics by developing a framework that reduces EMI in SMPS, with a particular focus on mitigating conducted emissions and their subsequent effects on radiated emissions. A key achievement of this study is the utilization of multitask LASSO regression to define data-driven stability regions, which enables the sparse mapping of design parameters directly linked to EMI sources. Employing a strategy that integrates low-dimensional feature mapping with sparsity-induced optimization, the method extracts and utilizes extended frequency-based features from the transfer functions and impedance characteristics of input filters and SMPS to create a sparse linear model. This method establishes AC frequency test criteria and addresses complex degradation behaviors associated with higher-order harmonics and specified stability criteria under high-EMI conditions.
The models have been validated through LTSPICE simulations and a test circuit, demonstrating their adaptability to diverse operational conditions and confirming their real-world feasibility and effectiveness.
Future research should focus on further validating these methods across a broader range of SMPS device topologies and operational conditions. Additionally, incorporating more comprehensive signal observations could further enhance the predictive accuracy and robustness of the model. Comparative analyses with existing methods have underscored the unique interpretability and practical effectiveness of our approach, highlighting its significant potential for industry adoption. This study not only demonstrates a significant step forward in the field of power electronics but also emphasizes the critical role of advanced analytics and modeling in boosting the reliability and efficiency of power systems amidst rapidly evolving technology demands.
Conflict of Interest
The authors declare no conflict of interest.
- S. Douzi, M. Tlig, J.B.H. Slama, 2015. “Experimental investigation on the evolution of a conducted-EMI buck converter after thermal aging tests of the MOSFET,” Microelectronics Reliability, 55(9-10), 1391-1394, 2015, doi:10.1016/j.microrel.2015.07.009.
- J. I. Corcau, L. Dinca, “Stability Studies of Power Systems for More Electric Aircraft,” in 2022 International Symposium on Power Electronics, Electrical Drives, Automation and Motion (SPEEDAM), Sorrento, Italy, 861-864, 2022, 10.1109/SPEEDAM53979.2022.9842040.
- D. Nemashkalo, N. Moonen, F. Leferink, “Practical consideration on power line filter design and implementation,” 2020 International Symposium on Electromagnetic Compatibility – EMC EUROPE, Rome, Italy, 1-6, 2020, doi: 10.1109/EMCEUROPE48519.2020.9245777.
- R. Trois, G. Viscillo, G. F. Volpi, S.A. Pignari, “Accurate prediction of conducted emissions in switch-mode power supplies for space applications,” in 2020 International Symposium on Electromagnetic Compatibility – EMC EUROPE, Rome, Italy, 1-6, 2020, doi: 10.1109/EMCEUROPE48519.2020.9245814.
- L. Eliasson, “Aluminium electrolytic capacitor’s performance in Very High Ripple Current and Temperature Applications,” in CARTS Europe, 2007.
- D. Goodman, J. Hofmeister, J. Judkins, “Electronic prognostics for switched mode power supplies,” Microelectronics Reliability, 47(12), 1902-1906, 2007.
- R. F. Orsagh, D. W. Brown, P. W. Kalgren, C. S. Byington, A. J. Hess and T. Dabney, “Prognostic health management for avionic systems,” in 2006 IEEE Aerospace Conference, Big Sky, MT, USA, p. 7, 2006, doi: 10.1109/AERO.2006.1656086.
- C.S. Kulkarni, J.R. Celaya, K. Goebel, G. Biswas, “Physics based electrolytic capacitor degradation models for prognostic studies under thermal overstress.” in PHM Society European Conference, Vol.1, No. 1, 2012, doi:10.36001/phme.2012.v1i1.1423
- B. Sun, X. Fan, C.A. Yuan, C. Qian, G. Zhang, “A degradation model of aluminum electrolytic capacitors for LED drivers,” in 2015 16th International Conference on Thermal, Mechanical and Multi-Physics Simulation and Experiments in Microelectronics and Microsystems, Budapest, Hungary, 1-4, 2015, doi:10.1109/EuroSimE.2015.7103124.
- M.M. Jovanović, “Power supply technology–past, present, and future,” in Power Conversion and Intelligent Motion China Conf. for Power Electronics (PCIM China) Shanghai, China, 3-15, 2007.
- Z. Wang, Conducted EMI Noise Prediction and Filter Design Optimization, Ph.D Dissertation, Virginia Tech, 2016.
- Z. Li, K.W. E. Cheng, J. Hu, “Modeling of basic DC-DC converters,” in 2017 7th International Conference on Power Electronics Systems and Applications – Smart Mobility, Power Transfer & Security (PESA), Hong Kong, China, 1-8, 2017, doi: 10.1109/PESA.2017.8277782.
- A. Ghosh, K. Mayank, State-space average modeling of dc-dc converters with parasitic in discontinuous conduction mode (dcm), Bachelor’s Thesis, National Institute of Technology, Rourkela, 2010.
- L. Sandrolini, A. Mariscotti, “Waveform and spectral characteristics of supraharmonic unsymmetrical conducted EMI of switched-mode power supplies,” Electronics, 11(4), p. 591, 2022, doi:10.3390/electronics11040591.
- A. Ismail, L. Saidi, M. Sayadi, M. Benbouzid, “A new data-driven approach for power IGBT remaining useful life estimation based on feature reduction technique and neural network,” Electronics, 9(10), p.1571, 2020, doi:10.3390/electronics9101571.
- A.G. EPCOS, “Aluminum electrolytic capacitors – general technical information’. White Paper, 2014.
- J. Gu, M. Pecht, “Prognostics and health management using physics-of-failure,” in 2008 Annual Reliability and Maintainability Symposium, Las Vegas, NV, USA, 481-487, 2008, doi: 10.1109/RAMS.2008.4925843.
- A.B. Kareem, J.W. Hur, “A feature engineering-assisted CM technology for SMPS output aluminium electrolytic capacitors (AEC) considering D-ESR-QZ parameters,” Processes, 10(6), p. 1091, 2022, doi: 10.3390/pr10061091.
- T. McGrew, V. Sysoeva, C.H. Cheng, C. Miller, J. Scofield, M. J. Scott, “Condition Monitoring of DC-Link Capacitors Using Time–Frequency Analysis and Machine Learning Classification of Conducted EMI,” IEEE Transactions on Power Electronics, 37(10), 12606-12618, 2022, doi: 10.1109/TPEL.2021.3135873.
- A. Altmann, B. Ng, “Joint Feature Extraction from Functional Connectivity Graphs with Multi-task Feature Learning,” in 2015 International Workshop on Pattern Recognition in NeuroImaging, Stanford, CA, USA, 29-32, 2015, doi: 10.1109/PRNI.2015.17
Citations by Dimensions
Citations by PlumX
Crossref Citations
- Tinofirei Museba Museba, Koenraad Vanhoof Vanhoof, "An Adaptive Heterogeneous Ensemble Learning Model for Credit Card Fraud Detection." Advances in Science, Technology and Engineering Systems Journal, vol. 9, no. 3, pp. 1, 2024.
No. of Downloads Per Month