Proposal and Implementation of Seawater Temperature Prediction Model using Transfer Learning Considering Water Depth Differences

Adv. Sci. Technol. Eng. Syst. J. 9(4), 01–06 (2024);
 DOI: 10.25046/aj090401
Aquaculture is one of the most important industries worldwide, and most marine products are produced by aquaculture. On the other hand, the aquaculture farmers are faced on the challenge of damage to marine products due to abnormal seawater temperatures. Research on seawater temperature prediction have been conducted, but many of them require a large amount of training data. Collecting seawater temperature data is not easy, and it takes an enormous time to introduce in new aquaculture farms. Therefore, the purpose of this study is to predict seawater temperature even with a small amount of training data for about one year. In this paper, we propose a seawater temperature prediction model using transition learning. The proposed model also attempts to improve the prediction accuracy by considering the difference in water depth between observation points. The results of the evaluation experiment showed that the prediction accuracy can be improved by transfer learning when learning with a small amount of data. In addition, we also confirmed that adding water depth values to the input layer may not lead to improved prediction accuracy for transfer learning.
1. Introduction
Aquaculture is one of the most important industries supporting the world’s food supply. Since around 1990, fisheries production has been on a flat trend, while aquaculture production has continued to increase. As a result, the share of aquaculture in the total production of the seafood industry has increased. In 2021, the production from mariculture was approximately 70 million tons, accounting for about 32% of the total production of the fisheries and aquaculture industry [1]. This is due to growing demands for edible seafood in the world. Global consumption of edible seafood is increasing and has almost doubled in the last 50 years. Also in Japan, aquaculture is an important industry. The followings are statistical data on the aquaculture industry in Japan. In 2022, the production from mariculture was about 910,000 tons, accounting for about 23% of the total production of the seafood industry [2]. Its production value was 521.1-billion-yen, accounting for about 33% of the total. These indicate that aquaculture is an indispensable industry in Japan.
Under these circumstances, one of the problems facing aquaculture farmers is the damage caused by abnormal seawater temperatures. If seawater temperature is not properly controlled, it can increase the risk of fish disease infection [3] and decrease feed efficiency [4]. To prevent such damage, aquaculture farmers need to accurately predict seawater temperatures and protect marine products in advance by moving rafts. However, temperature prediction requires years of experience and a wealth of knowledge. Furthermore, it’s getting more difficult to predict seawater temperatures due to global warming and severe weather changes. From these, water temperature management is a heavy burden for aquaculture farmers. To make these temperature management more sustainable in the future, it is necessary to provide seawater temperature predictions based on collected temperature data that can be used by anyone.
Although seawater temperature prediction is an active area of research, this is currently limited to prediction of sea surface temperature (SST) [5, 6]. One of the factors that SST prediction has been actively conducted is the abundance of SST datasets provided by satellite imagery [7]. SST prediction is used in many fields, such as marine meteorology and weather forecasting, but it is not suitable for the seawater temperature prediction required by aquaculture farmers. In aquaculture, the depth at which fish are reared depends on the type of product and the size of the fish tank. It may be appropriate to keep at a depth of several 10 meters. As seawater temperature changes with depth, it is necessary to predict using seawater temperature data from each depth. This means that abundant sea surface temperature datasets are not available, and it is necessary to measure temperatures at several depths at each location. However, since these data are measured using dedicated observation equipment, it is not easy to collect sufficiently at each aquaculture farm. Therefore, in this study, we propose and implement a seawater temperature prediction model that provides sufficient prediction accuracy even with a small amount of data for about one year.
2. Related Works
In this chapter, we introduce related studies on the prediction of seawater using measured water temperature.
In [8], the authors proposed a method based on an autoregressive model. In this method, each observation point is classified by cluster analysis, and a principal component analysis is conducted using the water temperature anomalies within each group. By autoregressive predicting using the calculated first principal component, the method enables prediction up to three months ahead. However, because they focus on a wide area such as the entire coastal area, it is difficult to predict water temperatures in a narrow area within an aquaculture farm.
In [9], the authors proposed a method for predicting water temperature in aquaculture areas. In this method, water temperature in the aquaculture area is obtained in real time by installing several small and inexpensive buoys, called ubiquitous buoys [10]. Nevertheless, it is necessary to install a large number of buoys because the prediction range covers a wide area of several kilometers.
In [11], the authors proposed a method that uses meteorological data in addition to measured water temperature data. In this method, sea temperature at multiple depths and data provided by the Japan Meteorological Agency are collected. Using these data as features, a random forest is used to make predictions for each depth. In the evaluation experiment, it was shown that using not only temperature but also wind speed improves the accuracy of the prediction. However, they did not predict for the next day or later. According to authors in [12], aquaculture farmers need to predict water temperatures up to one week ahead within an error margin of 1℃.
The authors in [13, 14] proposed a method that predicts over multiple time periods. In this method, in addition to a model that predicts up to the next day, a model that predicts daily mean water temperatures up to one week ahead is provided. These models are capable of long-term prediction using Gated Recurrent Unit (GRU) [15]. Evaluation experiments showed that the models were able to prediction with higher accuracy than existing methods. However, they required a large amount of training data, about 9 years. It is not easy to prepare such data, and it will take time to introduce them to a new farm. To solve the above issues, we develop a seawater temperature prediction method that meets the needs of aquaculture farmers even with a short period of data.
3. Proposed Method
3.1. Subject Data
In this study, we use measured sea water temperature data and meteorological data to create a prediction model. From previous studies [11, 13, 14], it is clear that in addition to seawater temperature data, it is effective to combine this data with meteorological data for learning. In this section, as an example of the seawater temperature and meteorological data used in the proposed model, details of the data collected in this study are described.
First, the seawater temperature data is described. we prepare a dataset of seawater temperature collected at five points throughout Japan. Figure 1 shows the observation points of seawater temperature in this study. The latitude and longitude of Gokasho is (34.3461°N, 136.7050°E), Matoya is (34.8807°N, 136.8807°E), Ago is (34.3071°N, 136.8038°E), Goshoura is (32.2910°N, 130.2370°E), and Otaru is (43.1904°N, 140.9951°E). As Japan is located in the Northern Hemisphere, it is generally hot in the south and cold in the north throughout the year. Similar trends are observed not only with air temperature but also with seawater temperature. To demonstrate that the proposed model can be used universally throughout Japan despite these trends, data from various locations are used.
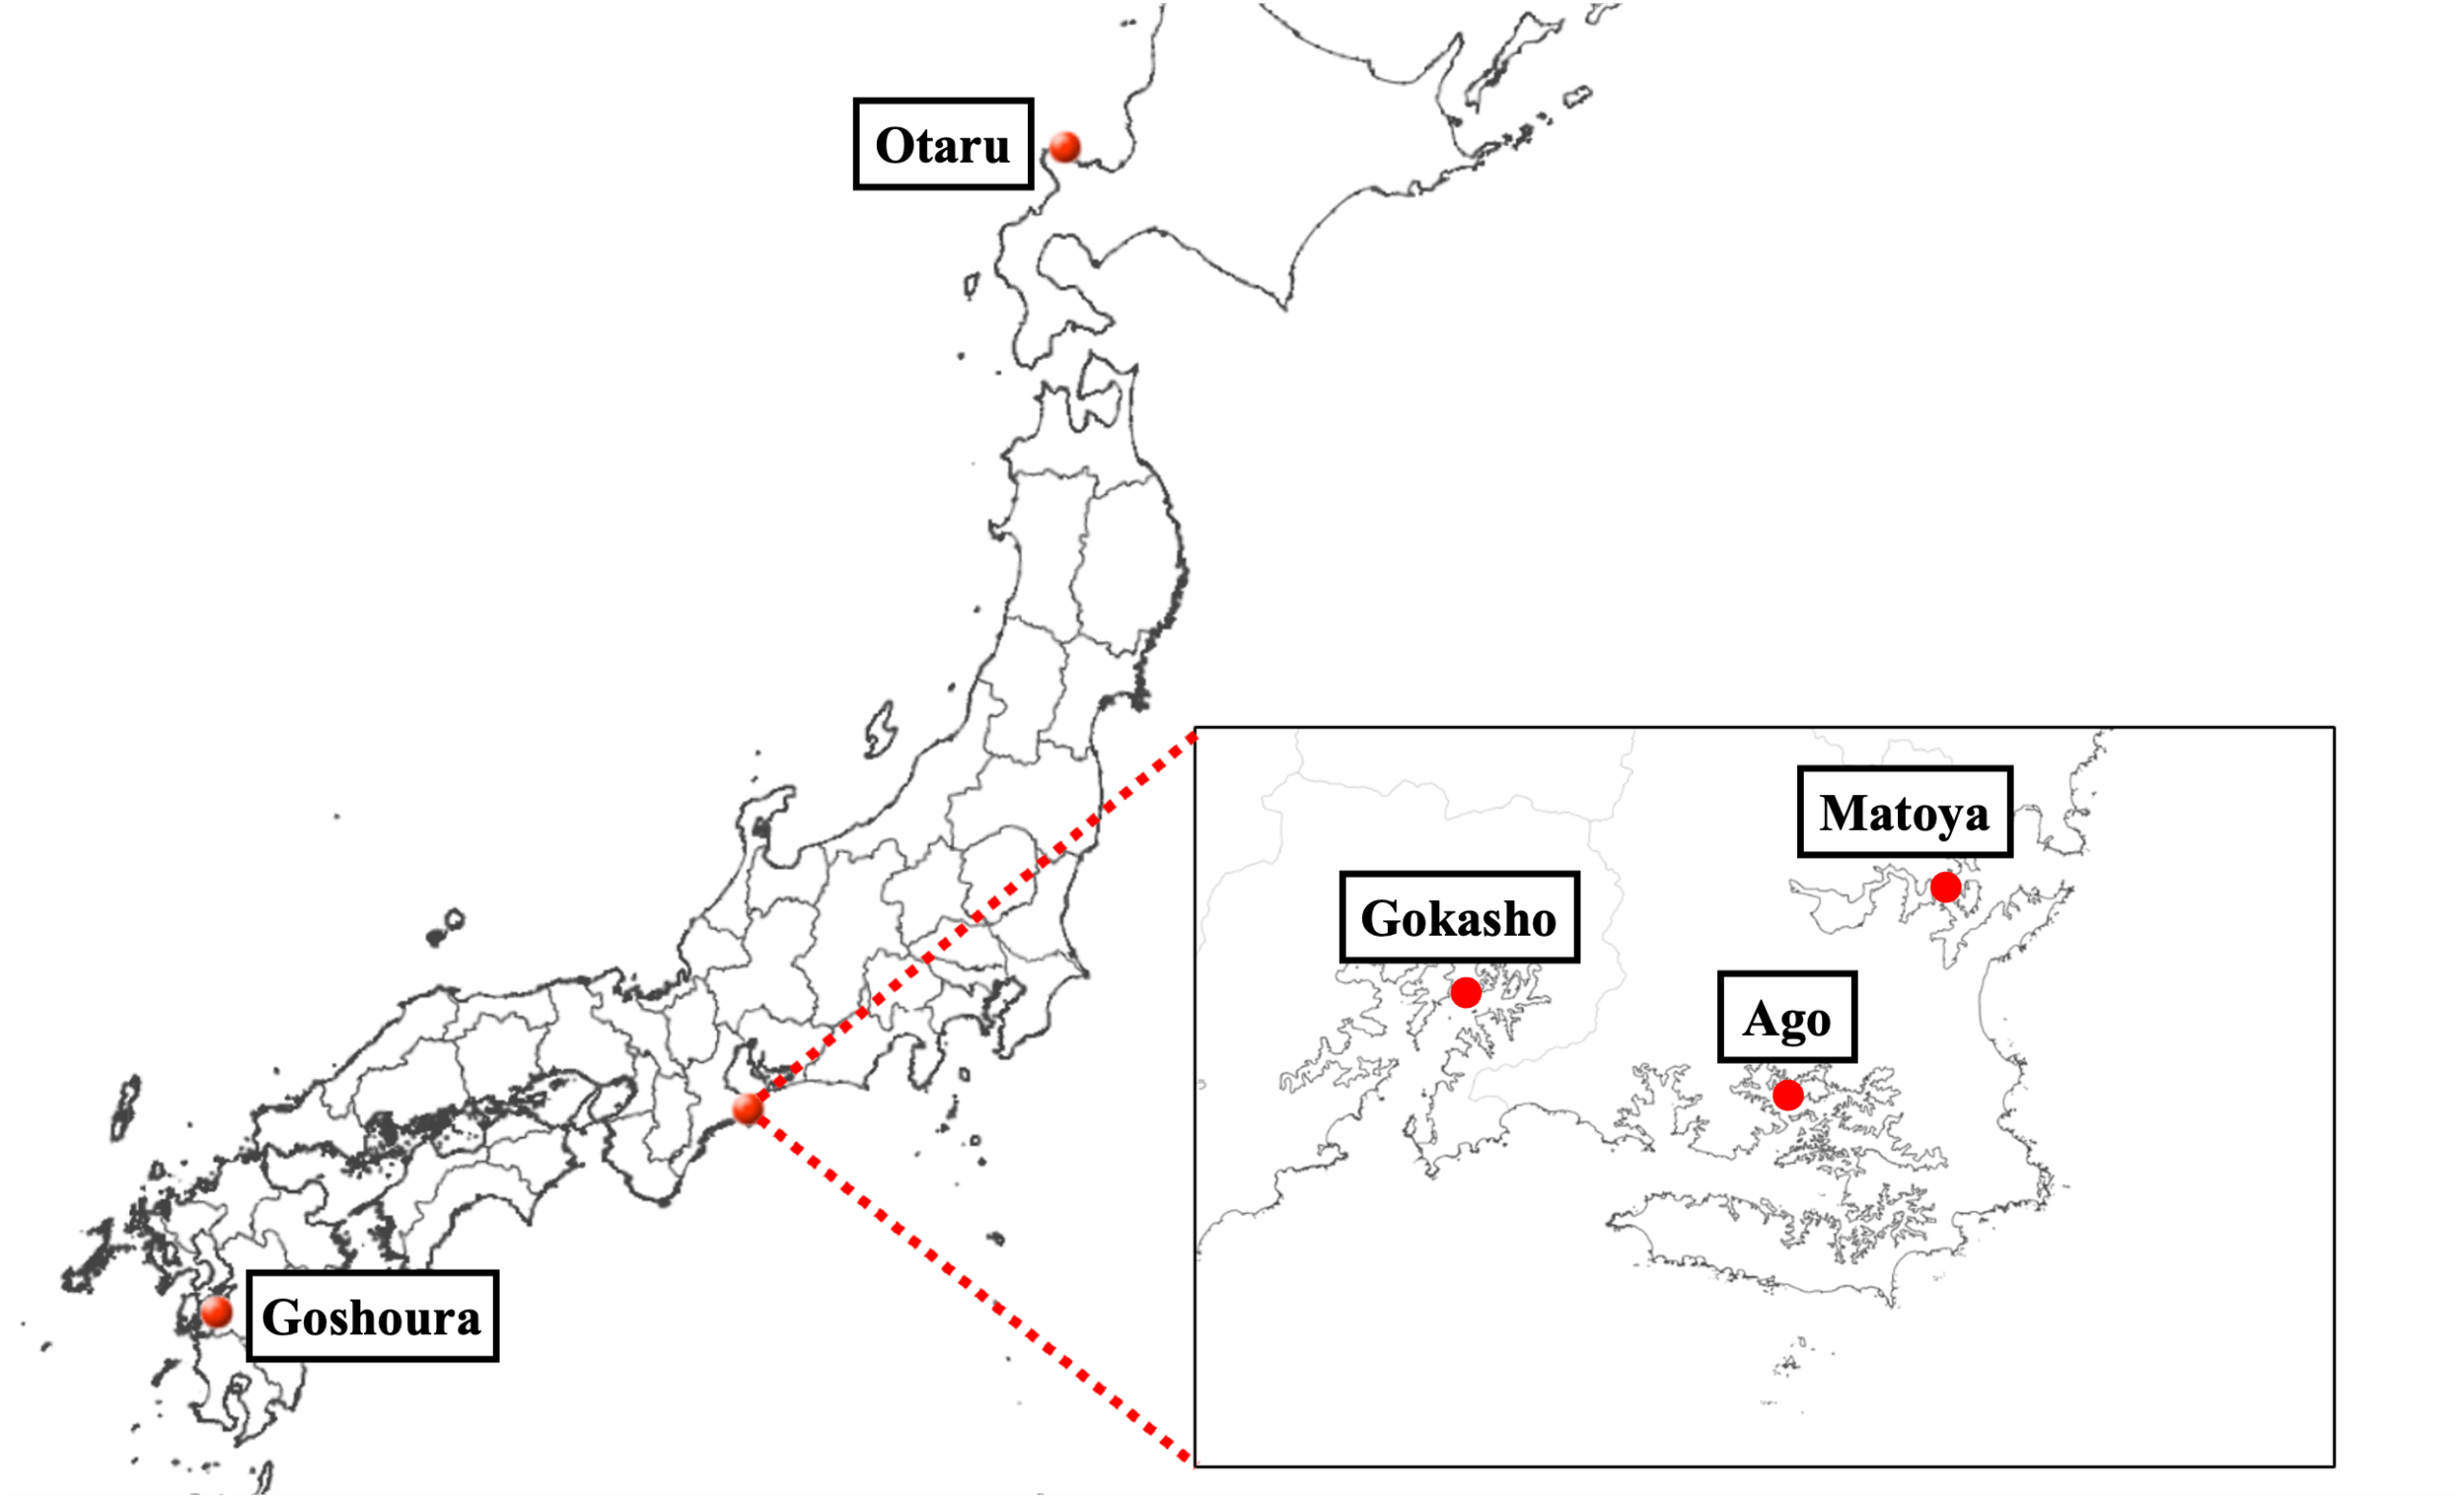
Table 1 shows the water depths and periods for which seawater temperatures are measured at each point. Under the conditions shown in Table 1, seawater temperatures are measured hourly at each point. At Gokasho, Ago, and Matoya, data are available for about 16 years from 2007 to 2022. On the other hand, Goshoura and Otaru have only about 8 years of data from 2012 to 2020, which means that the amount of data at each point varies. Seawater temperatures are measured simultaneously at three or four depths, which vary point site to point.
Table 1: Measurement conditions for seawater temperature
| Point | Depths (m) | Period |
| Gokasho | 0.5, 2, 5, 8 | 07/02/28 ~ 22/02/28 |
| Ago | 0.5, 2, 5, 8 | 07/03/20 ~ 22/02/28 |
| Matoya | 0.5, 2, 5, 8 | 07/03/20 ~ 22/02/28 |
| Goshoura | 1, 3, 10 | 12/04/01 ~ 20/01/20 |
| Otaru | 1, 10, 20 | 12/04/01 ~ 20/03/02 |
Next, the meteorological data is described. We prepare temperature and wind speed data from the meteorological database provided by the Japan Meteorological Agency [17]. We use these data measured at the nearest observation stations to the points shown in Figure 1. The periods of these data are set to be the same as the periods in which the seawater temperatures are measured at each point.
3.2. Effects of Depth on Seawater Temperature
In this section, we discuss the effects of different water depths on seawater temperature. Figure 2 shows the daily mean seawater temperature at each depth in Ago in 2015. From this graph, the difference in water temperature for each depth in Ago during the winter (December to February) is small. On the contrary, during the summer (June to August), the difference in water temperature for each depth is large. Seawater temperature tends to decrease with depth in summer. Specifically, the water temperature difference in winter is within 2℃, while that in summer ranges from 2 to 9℃.
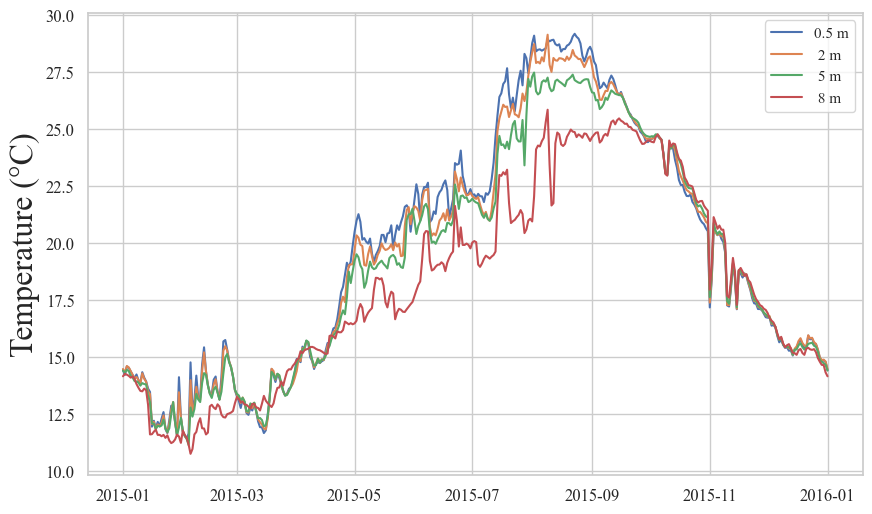
In summary, the water temperature difference with depth in summer is larger than that in winter, and the larger the water depth, the lower the water temperature in Ago. This tendency is also observed at the other four points. For example, in Gokasho, the water temperature difference in winter is within 2℃, while the water temperature difference in summer ranges from 1℃ to 8℃. In Otaru, the water temperature difference in winter is within 2℃, while the water temperature difference in summer can be as high as 5℃.
As shown in the previous section, seawater temperatures were measured at different depths at each point. This is because the appropriate water depth for aquaculture is different at each point. The depth depends on the type of marine products to be raised and the surrounding climate.
From the above, it is necessary to account for the difference in seawater temperature associated with the water depth between points. With this in mind, the proposed model is presented in the next section.
3.3. Seawater Temperature Prediction Model
The seawater temperature prediction model proposed in this study is an extension of the long-term prediction model proposed in [13,14] by using transfer learning [18], in which water depth values are included in the input layer. This approach aims to solve the problem of the huge amount of train data required by conventional models. In addition, it aims to consider differences in water temperature due to differences in water depth.
Transfer learning is a machine learning approach which applies the knowledge obtained in the source domain to learn in the target domain [19]. In this study, the domain refers to the observation points of seawater temperature. A series of learning is performed in the source domain, and then the learned model is re-learned in the target domain. For this reason, transfer learning has the advantage that it can learn efficiently even if the amount of data in the target domain is small.
Figure 3 shows an overview of the proposed seawater temperature prediction model. The structure of the proposed model is based on Recurrent Neural Network (RNN) [20], which is suitable for time-series forecasting. The proposed model has a three-layer structure consisting of an input layer, a hidden layer, and an output layer, each of which is described separately below.
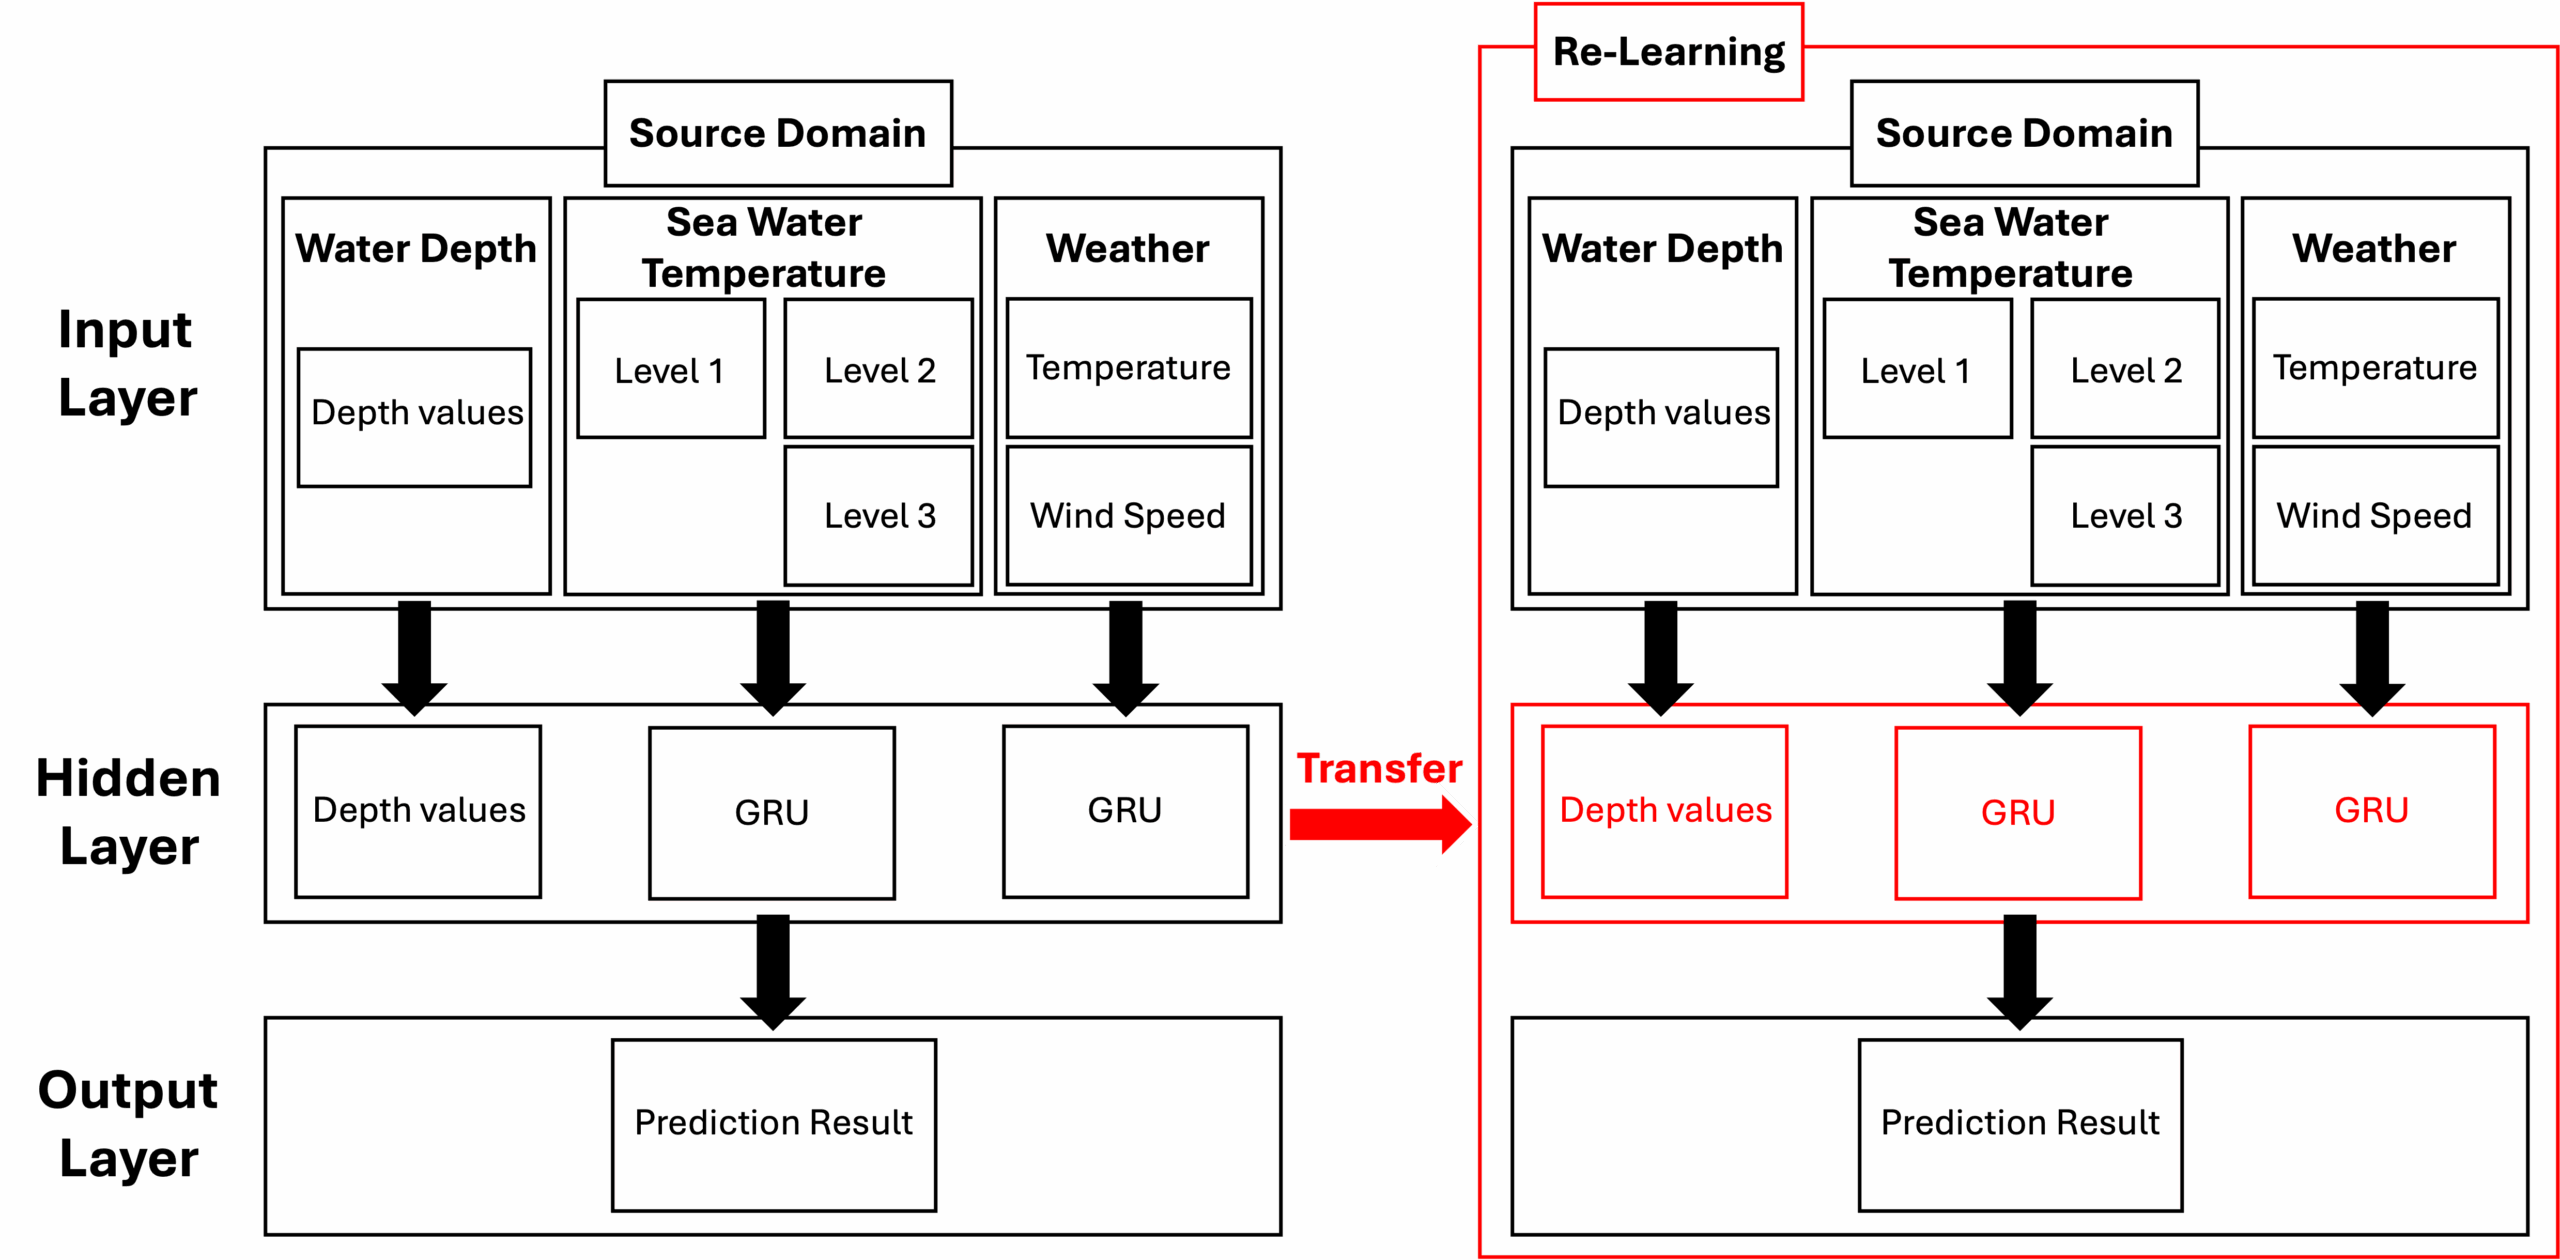
In the input layer, two types of time-series data, seawater temperature data and meteorological data, and the water depth values at which seawater temperature measured are input. Since seawater temperature does not change rapidly in a short period of time, the most recent data for the prediction target date is important. Therefore, we use the daily mean seawater temperature and meteorological data for the last seven days. As meteorological data, we use daily mean air temperature and maximum and minimum wind speeds. To account for the effects of multiple depths, we also included seawater temperatures at depths other than the prediction target as an input. As mentioned in the previous section, the depths measured are different at each point, and water temperatures vary depending on the water depth. This means that when performing transfer learning, it is necessary to consider the difference in the water depths between the source and target domains. Therefore, in the proposed model, the water depth values are added to the input layer.
In the hidden layer, we use GRU, which was also used in the model by the authors in [13,14] Conventional RNNs have two problems: gradient vanishing problem and weight collision, which make it difficult to learn long-term features. On the other hand, GRU has a reset gate and an update gate, and can select a choice of information. This makes it possible to store old information, and thus it can be applied to problems that requires long-term dependence to be considered. In the proposed model, seawater temperature data and weather data are input into another GRUs to be learned separately. The results processed by each GRU and the water depth values are combined, and then passed to the output layer.
In the output layer, the results from the hidden layer are converted to prediction results. As a prediction result, seven days of daily mean seawater temperatures up to one week ahead are output. In the proposed model, this series of learning is performed at points with sufficient seawater temperature data, and then the learned model is used to re-learn at the prediction target points with only a small amount of data.
4. Experiment
4.1. Common experimental setup
In this study, we conducted two evaluation experiments to demonstrate the effectiveness of the proposed model. The first was a comparison experiment of accuracy with and without transfer learning (Experiment 1). The second was a comparison experiment of accuracy with and without the input of water depth values (Experiment 2). This section describes the experimental setup common to both experiments.
Table 2 summarizes the details of the data used in the two experiments. Of the five observation points, we set Gokasho, Matoya, and Ago as the source domain, and Goshoura and Otaru as the target domain. Three different water depth values were set at each point. The period of train data for the source domain was eight years, the target domain was one year, and the test data was one year. Because the daily mean seawater temperature changes with a cycle of one year, we chose one year for the period of train data for the target domain. In addition, by setting the period of train data for source domain to eight years, the amount of train data used at the target domain reaches the amount of train data used by the authors in [13,14].
Table 2: Data used in evaluation experiments.
| Point | Depth values [m] | Period of train data |
Period of test data |
| Gokasho | 0.5, 2, 5 | 10/01/01 ~ 17/12/31 | |
| Ago | 0.5, 2, 5 | 10/01/01 ~ 17/12/31 | |
| Matoya | 0.5, 2, 5 | 10/01/01 ~ 17/12/31 | |
| Goshoura | 1, 3, 10 | 18/01/01 ~ 18/12/31 | 19/01/01 ~ 19/12/31 |
| Otaru | 1, 10, 20 | 18/01/01 ~ 18/12/31 | 19/01/01 ~ 19/12/31 |
As evaluation items in the two experiments, we calculated Mean Absolute Error (MAE) and the percentage of predictions with errors more than 1℃. In this study, the standard value was set to 1℃ to meet the needs of aquaculture farmers for an error less than 1℃.
4.2. Experiment 1
In this section, Experiment 1 concerning transfer learning is presented. The purpose of Experiment 1 is to evaluate whether transfer learning is valid for the seawater temperature prediction. Therefore, the proposed model with transfer learning compared with a model learned only with the train data for the prediction target points without transfer learning. The results of Experiment 1 are shown in Tables 3 and 4. Table 3 shows the results when the prediction target point is Goshoura, and Table 4 shows the results when the prediction target point is Otaru. The vertical axis of the table represents the source domain, and the horizontal axis represents the prediction target water depth. The values on the left of the table represent MAE [℃] and the values on the right represent the rate of errors above 1℃ [%].
Table 3: Results of Experiment 1 in Goshoura
| Source domain | 1m | 3m | 10m |
| none | 0.535℃, 14.5% | 0.669℃, 23.3% | 0.605℃, 21.1% |
| Gokasho | 0.293℃, 3.3% | 0.256℃, 2.5% | 0.258℃, 2.7% |
| Ago | 0.426℃, 7.7% | 0.345℃, 4.4% | 0.296℃, 3.6% |
| Matoya | 0.330℃, 3.3% | 0.280℃, 3.3% | 0.272℃, 3.3% |
Table 4: Results of Experiment 1 in Otaru
| Source domain | 1m | 10m | 20m |
| none | 0.725℃, 27.1% | 0.799℃, 31.8% | 0.941℃, 38.6% |
| Gokasho | 0.608℃, 17.5% | 0.493℃, 10.1% | 0.497℃, 9.9% |
| Ago | 0.482℃, 9.3% | 0.416℃, 6.8% | 0.473℃, 10.1% |
| Matoya | 0.495℃, 10.1% | 0.534℃, 12.9% | 0.483℃, 10.4% |
First, Table 3 shows that when the source domain was ‘none’, meaning without transfer learning, MAE ranged from 0.535°C to 0.669°C and the rate of errors above 1°C ranged from 14.5% to 23.3%. In contrast, with transfer learning, MAE ranged from 0.256°C to 0.426°C and the rate of errors above 1°C ranged from 2.5% to 7.7%. These results indicate that the proposed model has better prediction accuracy than the model without transfer learning for both evaluation items. The average MAE for each depth was roughly halved for all source domains, and the average rate of errors above 1°C for each water depth was less than one-third for all source domains.
Next, Table 4 shows that without transfer learning, MAE ranged from 0.725°C to 0.941°C and the rate of errors above 1°C ranged from 27.1% to 38.6%. In contrast, with transfer learning, MAE ranged from 0.416°C to 0.608°C and the rate of errors above 1°C ranged from 6.8% to 17.5%. Compared with the model without transfer learning, the average MAE for each depth was about one-half for all source domains, and the average rate of errors above 1°C for each water depth was approximately one-third for all source domains.
In conclusion, Experiment 1 indicated that the prediction accuracy can be improved by transfer learning, regardless of whether the prediction target point is Goshoura or Otaru, where only about one year of seawater temperature data is available. In transfer learning, prediction accuracy is improved when data from the source and target domains have similar characteristics. As the accuracy increased in transfers to various regions of Japan, the proposed model has the potential to be used in a wide range of aquaculture farms of the country.
4.3. Experiment 2
In this section, Experiment 2 on inputting water depth values is presented. The purpose of Experiment 2 is to evaluate whether water depth values are effective features for improving accuracy in transfer learning. Therefore, the proposed model adding water depth values to the input layer compared with a model that does not use water depth values as input. The results of Experiment 2 were shown in Tables 5 and 6. Table 5 shows the results when the prediction target point is Goshoura, and Table 6 shows the results when the prediction target point is Otaru. The vertical axis of the table represents the source domain and whether or not a bathymetric value was input, and the horizontal axis represents the prediction target water depth. The values on the left of the table represent MAE [℃] and the values on the right represent the rate of errors above 1℃ [%].
Table 5: Results of Experiment 2 in Goshoura
| Depth values | Source domain | 1m | 3m | 10m |
| none | Gokasho | 0.312℃, 3.3% | 0.260℃, 2.7% | 0.276℃, 3.0% |
| Ago | 0.426℃, 9.3% | 0.347℃, 4.9% | 0.278℃, 3.6% | |
| Matoya | 0.340℃, 3.8% | 0.275℃, 3.0% | 0.274℃, 3.3% | |
| input | Gokasho | 0.293℃, 3.3% | 0.256℃, 2.5% | 0.258℃, 2.7% |
| Ago | 0.426℃, 7.7% | 0.345℃, 4.4% | 0.296℃, 3.6% | |
| Matoya | 0.330℃, 3.3% | 0.280℃, 3.3% | 0.272℃, 3.3% |
Table 6: Results of Experiment 2 in Otaru
| Depth values | Source domain | 1m | 10m | 20m |
| none | Gokasho | 0.518℃, 13.2% | 0.448℃, 8.8% | 0.485℃, 9.9% |
| Ago | 0.467℃, 9.3% | 0.504℃, 11.2% | 0.577℃, 14.5% | |
| Matoya | 0.422℃, 7.7% | 0.429℃, 9.0% | 0.545℃, 11.5% | |
| input | Gokasho | 0.608℃, 17.5% | 0.493℃, 10.1% | 0.497℃, 9.9% |
| Ago | 0.482℃, 9.3% | 0.416℃, 6.8% | 0.473℃, 10.1% | |
| Matoya | 0.495℃, 10.1% | 0.534℃, 12.9% | 0.483℃, 10.4% |
First, Table 5 showed that when the depth values were ‘none’, meaning without water depth values input, MAE ranged from 0.260°C to 0.426°C and the rate of errors above 1°C ranged from 2.7% to 9.3%. On the other hand, with depth values input, MAE ranged from 0.256°C to 0.426°C and the rate of errors above 1°C ranged from 2.5% to 7.7%. These results indicated that adding water depth values to the input layer led to almost no change in MAE and a slight improvement in the rate of errors above 1°C.
Next, Table 6 showed that without water depth values input, MAE ranged from 0.422°C to 0.577°C and the rate of errors above 1°C ranged from 7.7% to 14.5%. On the contrary, when depth values were input, MAE ranged from 0.416°C to 0.608°C and the rate of errors above 1°C ranged from 6.8% to 17.5%. Adding water depth values to the input layer resulted that the average MAE for each depth was smaller when the source domain was Ago, while larger when it was Goshoura or Matoya. However, whether these prediction accuracies improved or declined, the changes were slight.
Experiment 2 indicated that some combinations improved prediction accuracy, adding water depth values to the input layer. However, regularity between source domains and the prediction target water depth could not be confirmed. Moreover, the degree of changes in accuracy was also marginal. From these results, it was not sufficient to add water depth values to the model input to learn the water depth differences between the source and target domains.
At this point, Table 5 for Goshoura and Table 6 for Otaru were compared in the proposed model. Looking at MAE at the prediction target water depth of one meter, Goshoura is lower than Otaru by 0.056°C to 0.315°C. At other depths, similar results were found. These means that the prediction accuracy is higher when the target domain is Goshoura than Otaru. Focusing on the latitude of the five observation points, Gokasho, Ago and Matoya are about 34°C and Goshoura is 32.2910°N, while Otaru is at 43.1904°N, which is significantly different from the other points. In addition, looking at the currents in the surrounding sea, Otaru is on Tsushima Current, whereas the other points are on Kuroshio Current. Thus, it was found that the two differences mentioned above changed the similarity of the data in the source and target domains. These differences in latitude and nearshore currents could have changed the similarity of the data in the source and target domains. The reason why the prediction accuracy did not improve with the addition of water depth input was thought to be due to the above two differences. Therefore, it is necessary to consider not only depth differences, but also differences in latitude and ocean currents between points in order to further improve prediction accuracy.
5. Conclusion
What is needed in the aquaculture industry is seawater temperature prediction from several meters down a few dozen meters. However, these data are not sufficient because they are not easy to collect. The objective of this study is to enable highly accurate prediction of seawater temperature even for points with a small amount of data. Therefore, we proposed and implemented a prediction model using transfer learning, in which a model that has been learned with data from other points is re-learned with data from the target point. In addition, to account for the depth differences between the two points used in the transfer learning, we added water depth values at which seawater temperature was measured to the input layer.
In the evaluation experiment, it was shown that transfer learning improves the prediction accuracy even for points with only about one year of seawater temperature data. We also showed that the accuracy of transfer learning was not improved by simply adding water depth values to the input layer.
In the future, to solve the above issue, we aim to improve prediction accuracy by considering factors such as differences in latitude and ocean currents. Then, we aim to improve the generalization performance of the model to provide seawater temperature predictions that meet the demands of more types of aquaculture farmers in more regions.
Conflict of Interest
The authors declare no conflict of interest.
Acknowledgment
This work was supported by JSPS KAKENHI Grant Number JP21K17803.
- White Paper on Fisheries, Fisheries Agency, 2022.
- Statistical data on the fisheries industry, Ministry of Agriculture, Forestry and Fisheries, 2024.
- AnssiKarvonen, PäiviRintamäki, JukkaJokela, ETellervoValtonen, “Increasing water temperature and disease risks in aquatic systems: Climate change increases the risk of some, but not all, diseases,” International Journal for Parasitology, 40(13), 1483–1488, 2010, https://doi.org/ 10.1016/j.ijpara.2010.04.015.
- Helene Volkoff, Ivar Rønnestad, “Effects of temperature on feeding and digestive processes in fish,” Temperature, 7(4), 307-320, 2020, https://doi.org/10.1080/23328940.2020.1765950.
- Q. Zhang, H. Wang, J. Dong, G. Zhong, X. Sun, “Prediction of Sea Surface Temperature Using Long Short-Term Memory,” IEEE Geoscience and Remote Sensing Letters, 14(10), 1745-1749, 2017, https://doi.org/10.1109/LGRS.2017.2733548.
- Ham, YG., Kim, JH., Luo, JJ., “Deep learning for multi-year ENSO forecasts,” Nature, 573, 568–572, 2019, https://doi.org/10.1109/LGRS.2017.2733548.
- Boyin Huang, Chunying Liu, Eric Freeman, Garrett Graham, Tom Smith, Huai-Min Zhang, “Assessment and intercomparison of NOAA daily optimum interpolation sea surface temperature (DOISST) version 2.1,” Journal of Climate, 34(18), 7421–7441, 2021, https://doi.org/10.1175/JCLI-D-21-0001.1.
- Tadahiro Saotome, Shinichi Ito, “海洋観測データを用いた福島県沿岸海域の水温予測手法の検討,” 11, 27-, 2004, https://cir.nii.ac.jp/crid/1571417125955513088.
- Masaaki Wada, Katsumori Hatanaka, Masashi Toda, “Development of personal ocean observation buoy for scallop cultivation,” IPSJ Journal(article in Japanese with an abstract in English), 2006(14), 387-392 , 2006, https://cir.nii.ac.jp/crid/1050292572092667264.
- Kesuke Abe, Masaaki Wada, “A Study of Forecasting the Seawater Temperature in Japanese Scallop Aquaculture Sea Area by Using Ubiquitous Buoy System,” The Japanese Society of Fisheries Engineering, 47(1), 43-46 , 2010, https://doi.org/10.18903/fisheng.47.1_43.
- Takanobu Otsuka, Yuji Kitazawa, Takayuki Ito, “Seawater Temperature Prediction Method for Sustainable Marine Aquaculture,” Preprints, 2017, https://doi.org/10.20944/preprints201709.0114.v1.
- Kenichi Nakagawa, Yoshikazu Fukuda, Hideki Kaneko, Hiroshi Nakamura, Tatsuo Nakamura, “東北地方の養殖漁業のための沿岸水温予測方法の紹介,” Meteorological Time Report (Japan Meteorological Agency), 85, 13-29 , 2018.
- Masahito Okuno, Takanobu Otsuka, “How to Predict Seawater Temperature for Sustainable Marine Aquaculture (Student Abstract),” In Proceedings of the AAAI Conference on Artificial Intelligence, 34(10), 13887–13888, 2020, https://doi.org/10.1609/aaai.v34i10.7216.
- Masahito Okuno, Takanobu Otsuka, “Proposal and Implementation of Multiple Term Seawater Temperature Prediction Algorithm for Marine Aquaculture,” IPSJ Journal(article in Japanese with an abstract in English), 61(3), 687–694, 2020, http://id.nii.ac.jp/1001/00204182.
- Kyunghyun Cho, Bart van Merriënboer, Caglar Gulcehre, Dzmitry Bahdanau, Fethi Bougares, Holger Schwenk, Yoshua Bengio, “Learning Phrase Representations using RNN Encoder–Decoder for Statistical Machine Translation,” Proceedings of the 2014 Conference on Empirical Methods in Natural Language Processing (EMNLP), 1724–1734, 2014, https://doi.org/10.3115/v1/D14-1179.
- Geographical Survey Institute website, Ministry of Land, Infrastructure, Transport and Tourism, 2024.
- Historical meteorological data, Japan Meteorological Agency, 2024.
- S. J. Pan and Q. Yang, ” A survey on transfer learning,” IEEE Transactions on Knowledge and Data Engineering, 22(10), 1345-1359, 2010, https://doi.org/10.1109/TKDE.2009.191.
- Weiss, K., Khoshgoftaar, T.M. & Wang, D, ” A survey of transfer learning,” Jaurnal of Big Data, 3(9), 2016, https://doi.org/10.1186/s40537-016-0043-6.
- Wim De Mulder, Steven Bethard, Marie-Francine Moens, “A survey on the application of recurrent neural networks to statistical language modeling,” Computer Speech & Language, 30(1), 61–98, 2015, https://doi.org/10.1016/j.csl.2014.09.005.