Leveraging Machine Learning for a Comprehensive Assessment of PFAS Nephrotoxicity

Adv. Sci. Technol. Eng. Syst. J. 9(3), 62–71 (2024);
 DOI: 10.25046/aj090306
Polyfluoroalkyl substances (PFAS) are persistent chemicals that accumulate in the body and environment. Although recent studies have indicated that PFAS may disrupt kidney function, the underlying mechanisms and overall effects on the organ remain unclear. Therefore, this study aims to elucidate the impact of PFAS on kidney health using machine learning techniques. Utilizing a dataset containing PFAS chemical features and kidney parameters, dimensionality reduction and clustering were performed to identify patterns. Machine learning models, including XGBoost classifier, regressor, and Random Forest regressor, were then developed to predict kidney type from PFAS descriptors, estimate PFAS accumulation in the body, and predict the ratio of glomerular surface area to proximal tubule volume, which indicates kidney filtration efficiency. The kidney type classifier achieved 100% accuracy, confirming that PFAS exposure alters kidney morphology. The PFAS accumulation model attained an R2 of 1.00, providing a tool to identify at-risk individuals. The ratio prediction model reached an R2 of 1.00, offering insights into PFAS effects on kidney function. Furthermore, PFAS descriptors and anatomical variables were identified through analyses using feature importance, demonstrating discernible links between PFAS and kidney health, offering further biological significance. Overall, this study can significantly contribute to the current findings on the effect of PFAS while offering machine learning as a contributive tool for similar studies.
Received: 04 March 2024, Revised: 18 May 2024, Accepted: 19 May 2024, Published Online: 12 June 2024
1. Introduction
Polyfluoro-alkyl substances (PFAS) have garnered significant atten- tion in recent years due to their presence in a wide range of consumer and industrial products and their existence in the environment [1]. However, the characteristics that make PFAS so prevalent in our so- ciety also underscore their challenges to human and environmental health [2].
PFAS are a group of synthetic organic compounds characterized by their perfluoroalkyl chains, which consist of carbon atoms fully saturated with fluorine atoms [3]. This unique chemical structure results in one of the most robust and most stable bonds in organic chemistry, the carbon-fluorine (C-F) bond, which is responsible for PFAS’s exceptional resistance to heat, chemical degradation, and biological breakdown processes, earning it the name of the ”for- ever chemical” [4]. The fluorine atoms in PFAS molecules form a protective shield around the carbon backbone, rendering these compounds highly hydrophobic, which contributes to their utility in various industrial applications, such as the production of non-stick coatings and water-resistant textiles [5]. However, this is also the reason behind their persistence in the environment and their ability to bioaccumulate in organisms [6].
PFAS’s hydrophobic properties make it highly insoluble in water, which prevents the chemical from dissolving into aqueous environ- ments, allowing it to persist in the soil, water, and sediment for extended periods [7]. Furthermore, this hydrophobicity disrupts normal metabolic pathways, as it partitions into fatty tissues rather than remaining in aqueous solutions [8]. This phenomenon leads to bioaccumulation in organisms, as PFAS are absorbed through ingestion or absorption and accumulate in fatty tissues over time, resulting in elevated concentrations within organisms throughout the food chain [9].
Over the past few years, various research has revealed the grow- ing dangers associated with PFAS on the body, encompassing con- cerns such as cancer, thyroid disorders, developmental anomalies in children, and immune system dysfunction [10, 11]. It is well known that the carcinogenic potential of PFAS has been associated with various cancers due to the PFAS-induced oxidative stress that plays a role in cellular damage and DNA mutations, contributing to cancer development [12, 13]. Furthermore, studies have shown that by in- terfering with hormonal regulation systems and suppressing immune system function, PFAS can lead to disorders like hypothyroidism, developmental anomalies, such as stunted growth and delayed cog- nitive development in children, and neurotoxic effects [14, 15].
However, recent studies have uncovered the notion that PFAS, in fact, also has the potential to infiltrate further and disrupt fun- damental physiological processes, namely the kidneys [16]. The kidneys, often called the body’s natural filtration and waste man- agement system, play a pivotal role in maintaining homeostasis. Their intricate network of nephrons and tubules ensures the efficient removal of waste products, excess fluids, and electrolytes from the bloodstream [17]. Consequently, the exploration of the relationship between PFAS exposure and kidney function has assumed a posi- tion of paramount importance in the realm of health research [18]. Extensive research in recent years has shed light on the profound impact of PFAS on kidney health. When introduced into the body, PFAS compounds can infiltrate renal tissues, interacting with var- ious cellular components and initiating molecular responses [19]. These interactions can lead to structural changes in the kidneys, potentially altering the distribution of kidney types, which has been identified in previous studies. Such changes in kidney morphology have significant implications for kidney function and overall health [20]. Moreover, studies have indicated that PFAS exposure can disrupt the finely tuned balance of hormonal regulation systems, potentially leading to disorders such as hypothyroidism, which can further affect kidney health [21].
Therefore, this research aims to gain further insight into the relationship between PFAS and kidney function [22]. Utilizing ma- chine learning techniques, we aim to unravel the complexities of this relationship and shed more light on how PFAS accumulation may impact the intricate structure and function of the kidneys [23]. Utilizing a dataset containing PFAS chemical features and kidney parameters, exploratory data analysis and dimensionality reduction were performed using PCA to identify patterns and correlations within the data. To ensure and verify the correlation between PFAS and kidneys, an XGBoost Classifier was used to predict kidney type from PFAS descriptors. Next, an XGBoost Regressor was used to estimate PFAS accumulation in the organ, assessing the impact of PFAS on the kidneys. Finally, a Random Forest Regressor was developed to determine the ratio of Glomerular Total Surface Area to Proximal Tubule Volume to offer insights into kidney function. The models were trained on 70% of the dataset and evaluated using metrics such as R-squared, confusion matrices, Mean Absolute Er- ror, and residual analysis. Hyperparameter tuning through methods like Grid Search and Cross-Validation was also conducted.
2. Materials and Methods
2.1. Dataset
A dataset found at [24] was used. The dataset is critical to providing a few key pieces of information in depth. The first key piece of information that it provides is the chemical features of PFAS. For example, the dataset has information about the PFAS inside of the body’s lipophilicity, the vapor pressure of PFAS, the water solubility of PFAS, and more critical descriptors of PFAS chemically. Addi- tionally, the dataset contains information about the actual animal being looked at; for example, it has information about the species type and the gender of the animal. Furthermore, some critical physiological features of the animal were kept within the dataset, such as information about the animal’s body mass, while also keeping physiological characteristics of the kidney inside of the body, which has vital information about things like the diameter of the proximal tubules. Utilizing this entire feature set, we conducted some meth- ods to see if the data could be used to create important machine learning algorithms proving correlations between different parts of PFAS and kidney functions.
2.2. Data Analysis
Before the machine learning algorithms were created, exploratory data analysis was undertaken to see the key patterns and statistical backing behind the data before any machine learning was run, en- suring that the algorithms depend on there being learnable patterns. Additionally, conducting the analysis would allow for essential pieces of data that would mess with the accuracy of the machine learning models in the future, like outliers or potential data errors that may be found.
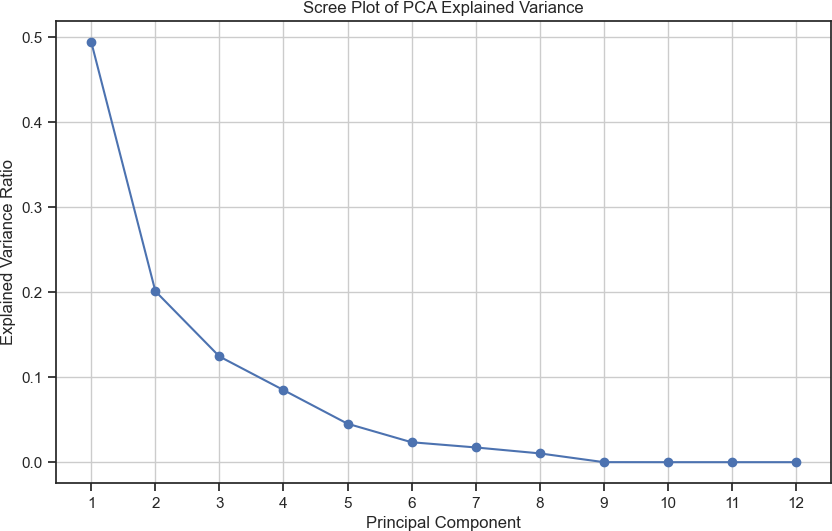
The following data analysis technique was a dimensionality reduction utilizing a Principal Component Analysis (PCA). PCA is perfect for finding the key correlations and patterns in the data, which directly leads to variation. Additionally, Figure 1 shows how the higher dimensionality is reduced to lower dimensionality spaces, making it easier to visualize data patterns while also allowing us to understand the explained variance ratio for the principal com- ponents. This allows us to see the primary source of variation in the data and how the first few components are vital in depicting the first few data points. Additionally, we can find clusters and patterns in the data, allowing us to find relationships that are not very noticeable or subgroups of data.
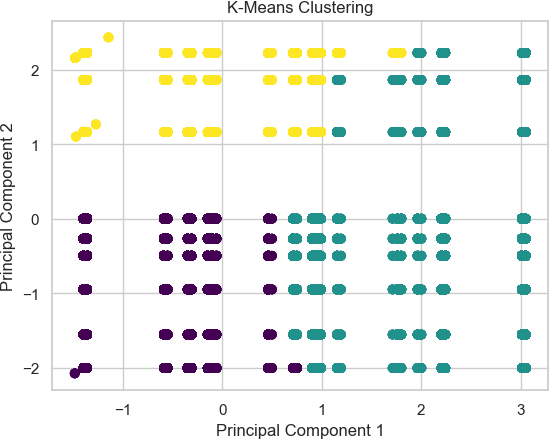
Furthermore, using methods like clustering on top of PCAs, we can better understand the patterns inside of the dataset [25]. This is a crucial method because clustering while using PCA allows us to find the natural groups of the patterns within the data, as PCA simplifies the data while keeping the essential characteristics, so the clusters of this allow us to understand the groupings of these characteristics allowing us to find these specific groups within the data [26]. Additionally, K-Means can cluster the points based on their similarity, allowing us to find the similarity between the differ- ent characteristics delineated as essential due to the PCA algorithm. As seen in Figure 2, there seems to be an essential characteristic within the dataset that can show how some parts of the principal component analysis are very close. However, there are sections in the middle where multiple clusters are near one another.
2.3. Kidney Type Prediction
Utilizing our data, we attempted first to establish and confirm a correlation between PFAS and kidneys, which we would later con- duct the rest of our analysis on. This correlation can describe if there is a relationship between the information about the PFAS and precisely how much it affects the kidney while providing the actual characteristics of the organ. To do this, we created a classifier that would classify what type of kidney was being affected by the PFAS inside of the species, which could allow for early measures and precautions to be taken based on the predicted effects of PFAS on the organ.
2.3.1. Feature Selection
The data was split up into all of the pieces of data which actively described any property or action of the PFAS chemical was used as a X variable, while just the kidney type was left as the Y variable.
2.3.2. Model Selection & Hyperparameter Tuning
The machine learning algorithm utilized an XGBoost Classi- fier(XGBC) to classify the PFAS data into the two different types of kidneys in the dataset. XGBC is critical to creating multiple weaker decision trees, which are then compiled up and added into a singular, more robust predictor while correcting previous tree errors by selectively creating new trees, allowing the algorithm to make the predictions more accurate [27]. As a result, the ensemble-based algorithm is critical to creating a robust classifier, as it uses the con- cept that if each tree has a vital understanding of the data, then when they all are combined, the final decision that the model is going to be outputting will understand all of the dimensionalities of the dataset. Additionally, the algorithm has inbuilt regularization tech- niques, which is critical because the dataset that we were working with had a ton of data points, meaning that the algorithm was very prone to just learning the pattern in training data without having a resemblance to the output data because it would be overfitting.
Furthermore, XGBC allows us to look into the specific features with the highest correlations, especially within the context of the machine learning algorithm’s trained understanding of the patterns within the data [28]. Utilizing the XGBC feature importances, we can see which columns are the most important for the training of the algorithm and which columns may potentially be negatively affect- ing the understanding of the data, which would allow us to go back to the feature selection step and ensure that they are removed from the training dataset. Additionally, we can see which features have the highest correlation with the target output that we are looking for using this feature selection to understand better the patterns within the data, which otherwise would not be understandable.
Then, after the model had been trained and the feature selector had been used to see which features were key, hyperparameter tun- ing was used to create the most optimal machine learning model, especially in the context of XGBC where there are multiple parts to the actual algorithm including important pieces like loss functions which could change. Thus, essential concepts like Grid Search and Cross-Validation were used to conduct hyperparameter tuning so the classifier could achieve the best accuracy possible.
2.3.3. Model Training & Evaluation
The model was trained using a majority of the data, but a train test split of 70% – 30% was used to evaluate the model and prevent over- fitting of the data. Then, to understand the relationship between the different pieces of data, a few metrics were used, including a confu- sion matrix to understand how the model was doing when predicting the testing data, and an accuracy score was used to understand the difference between the predicted and the actual outputs.
2.4. PFAS Accumulation Model
After establishing if there is a correlation between the kidney type and the information about PFAS, it is vital to see the amount of PFAS that is going to accumulate in the kidney based on the PFAS descriptors. We must see this information because it is critical to assessing the impact of PFAS on the kidney. Additionally, it is essential to understand if there is a correlation between the chemical descriptors of PFAS and the actual effect of PFAS when inside the human body. As a result, a machine learning model was created to make these assessments and understand if we can predict the accumulation of PFAS inside the human body.
2.4.1. Feature Selection
A fundamental difference between this algorithm and the kidney- type prediction algorithm is that this one needs to output a numerical rather than a categorical response. This delineation is critical to un- derstanding how the data will be used, as many features exist in the datasets. However, some of them are categorical, so the data must be encoded into numerical data. After the data was imputed, the data was split into all the PFAS descriptors: the X data. At the same time, the singular Y data was the amount of PFAS accumulating inside the body.
2.4.2. Model Selection & Hyperparameter Tuning
Similarly to the Kidney Type Prediction model, an XGBoost Regres- sion algorithm was used to predict the amount of PFAS that would accumulate in the body. XGBoost regression was used for this algo- rithm due to its innate ability to understand nonlinear data through its use of gradient-boosted decision trees [29]. Using these trees, the algorithm can perform an ensemble method, reducing overfitting inside the algorithm. Additionally, since it is a gradient-boosting al- gorithm, it can optimize its performance through an iterative process where it continuously improves itself [30]. Also, it can understand larger datasets with many features, delineate which ones are the most essential parts for it to learn, and then create the most optimal outputs after it has achieved the response it is attempting to get [31].
2.4.3. Model Training & Evaluation
The model was trained on a 70%-30% train test split. Using the train test split, the model could be evaluated on its ability to truly learn the training data and still apply it to the testing data without just outputting it based on the answers it was already given. On this, an R2 and MAE were calculated to output the model’s accuracy to see how closely the model truly understood and predicted the data.
2.5. Glomerular Total Surface Area vs Proximal Tubule Predictor
Following the prediction of PFAS accumulation in kidneys, we aimed to discern the effects of PFAS on the kidneys’ function. To do this, we sought to estimate the ratio of Glomerular Total Sur- face Area (GlomTotSA) to the Volume of the Proximal Tubule (ProxTubTotVol) within the kidneys, which provides insight into the structural dynamics of the organ. A higher ratio may indicate efficient filtration and reabsorption processes, suggesting healthier kidney function. In comparison, a lower ratio might suggest poten- tial kidney morphology and function alterations, providing early indicators of kidney health issues.
2.5.1. Feature Selection
The feature selection process involved carefully examining the rel- evance and significance of each feature in the dataset. Using Re- cursive Feature Elimination (RFE) and correlation analysis, we identified the most informative attributes for our algorithm. Further- more, domain expertise was crucial in selecting pertinent features, ensuring that the model captured the essence of PFAS accumulation within the kidneys.
Feature engineering, however, was not confined to feature se- lection alone. It extended to creating engineered features, such as interaction terms between PFAS accumulation descriptors and anatomical variables, enabling the model to capture nuanced rela- tionships within the data. These engineered features served as the basis for the algorithm to make precise predictions regarding the GlomTotSA/ProxTubTotVol ratio.
2.5.2. Model Selection & Hyperparameter Tuning
The choice of a Random Forest Regressor was deliberate, given its aptitude for handling complex datasets and capturing linear and non- linear relationships within the data. Our dataset encompassed a mul- titude of variables, including PFAS exposure descriptors, anatomical features, and the target variable of GlomTotSA/ProxTubTotVol ra- tio. These variables interact in intricate ways that may need to be more linear and straightforward. The ensemble nature of Random Forest, comprising multiple decision trees, allows the algorithm to capture these complex relationships effectively. Each decision tree contributes its unique perspective, and the ensemble aggregates these insights to yield robust and accurate predictions. This ro- bustness is particularly advantageous when dealing with biological data, which often exhibits intricate and nonlinear interactions. The ensemble nature of the Random Forest algorithm, comprising mul- tiple decision trees, enhances its robustness and predictive power [32]. Another compelling aspect of the Random Forest Regressor is its innate ability to provide insights into feature importance [33]. Understanding which features are most influential in predicting the GlomTotSA/ProxTubTotVol ratio is essential for gaining mecha- nistic insights into the relationship between PFAS exposure and kidney morphology [34]. Random Forest calculates feature impor- tance scores, enabling us to identify which PFAS descriptors and anatomical variables are pivotal in predicting the target variable [35].
On the other hand, hyperparameter tuning, a pivotal aspect of model development, involved an exhaustive search for optimal parameters. We employed techniques such as grid search and cross- validation to find the parameter configuration that yielded the best predictive accuracy and generalization performance.
2.5.3. Model Training & Evaluation
The Random Forest Regressor was trained on the training data, utilizing a 70/30 train test split, allowing the selected features and engineered descriptors to learn the intricate relationships between PFAS accumulation and the GlomTotSA/ProxTubTotVol ratio.
To gauge the model’s performance, we employed several eval- uation metrics, including Mean Absolute Error (MAE) and R2, which quantified the model’s predictive accuracy. Additionally, we assessed the model’s ability to generalize to unseen data through k- fold cross-validation, ensuring robustness and mitigating overfitting concerns.
3. Results
3.1. Accuracy
3.1.1. Kidney Type Prediction
To assess the performance of the model, the accuracy of the model had to be calculated by comparing the model’s prediction of the training dataset against the actual values of the training dataset. Us- ing this metric to calculate the model’s accuracy, the model achieved an accuracy of 100%. The accuracy of this model can be depicted through the confusion matrix as seen in Figure 3. The figure shows that the predictions give the same output as is expected from the actual data, allowing for the machine learning model to be associ- ated with perfect accuracy. Additionally, other performance metrics were used to measure the machine learning algorithm’s performance, which can be seen in Table 1. These metrics can depict the fact that the accuracy can perfectly classify what type of kidney is affected by PFAS and the spread of PFAS throughout the body.
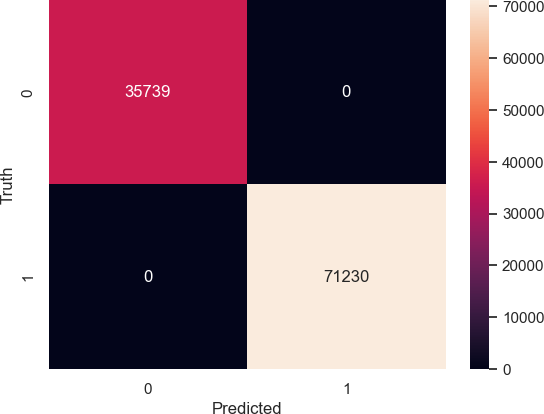
Table 1: Machine Learning Model Performance Metrics
| Labels | Precision | Recall | F1 Score | Support |
| Multirenculated | 1.00 | 1.00 | 1.00 | 35739 |
| Unipapillary | 1.00 | 1.00 | 1.00 | 71230 |
| Accuracy | 1.00 | 106969 | ||
| Macro Average | 1.00 | 1.00 | 1.00 | 106969 |
| Weighted Average | 1.00 | 1.00 | 1.00 | 106969 |
Cross-validation scores were also calculated to ensure that the accuracy of the model was generealizable to data that wasn’t specific to training the machine learning model itself. When done on a 5-fold cross validation model, all five scores contained 100% accuracy and and the standard deviation from these scores was 0%.
3.1.2. PFAS Accumulation Model
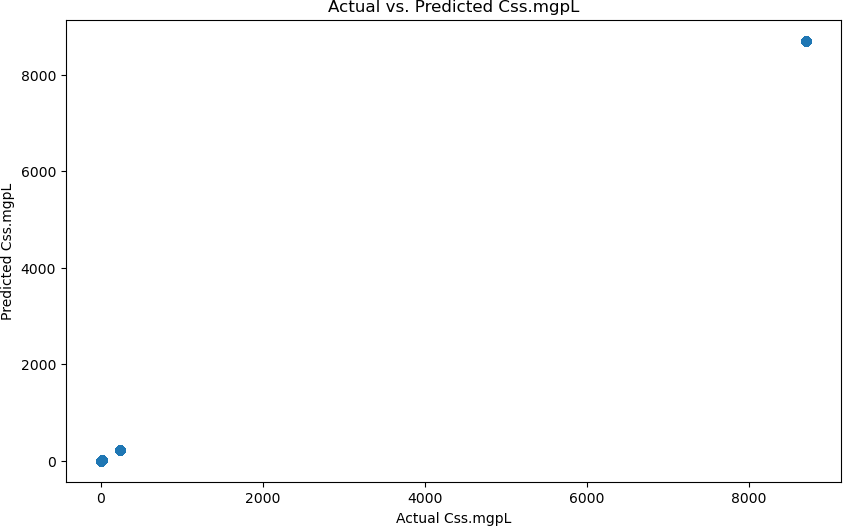
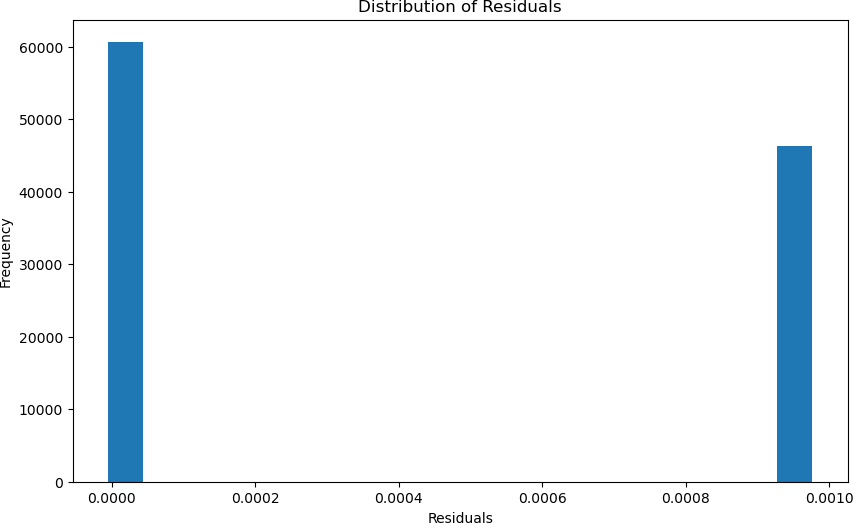
This machine learning model’s accuracy was calculated using a few different methods since the model is a regression algorithm rather than a classifier. The first method used to calculate the accuracy of the model was to statistically evaluate the created regression line, which is done utilizing a R2 value and the Mean Absolute Error(MAE). The R2 value was 1.00, and the MAE was 0.00. These values indicate that the model was able to model the data perfectly. These values can be seen in Figure 4, where you can see how the graph depicts the alignment between the predicted and actual pre- dictions. Additionally, these values were further justified through a cross-validation algorithm, which can prove the robustness of the model by verifying that the data split is not done by chance; it shows if the machine learning model is genuinely learning the data. The cross-validation statistics also validated that the machine learning model perfectly predicted the accumulation of PFAS, as it gave the same 1.00 R2 value and 0.00 MAE. Additionally, these values can be further depicted in Figure 5, which shows the distribution of the residuals, which are calculated by subtracting the actual value from the predicted value, and the figure shows how the values are very close to 0, indicating that the model is predicting to almost perfection.
The cross validation results that were achieved for this model was a 0.00 MAE and a 1.00 R2 on a 5-fold cross validation model.
3.1.3. Glomerular Total Surface Area vs Proximal Tubule Predictor
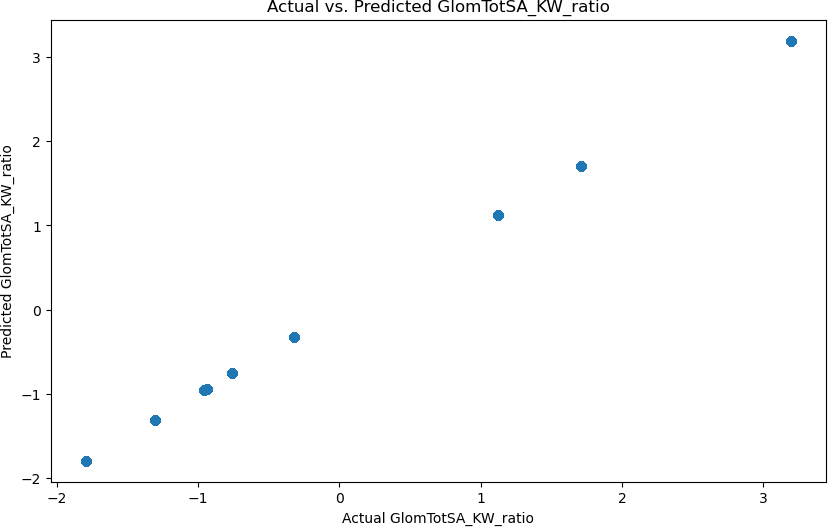
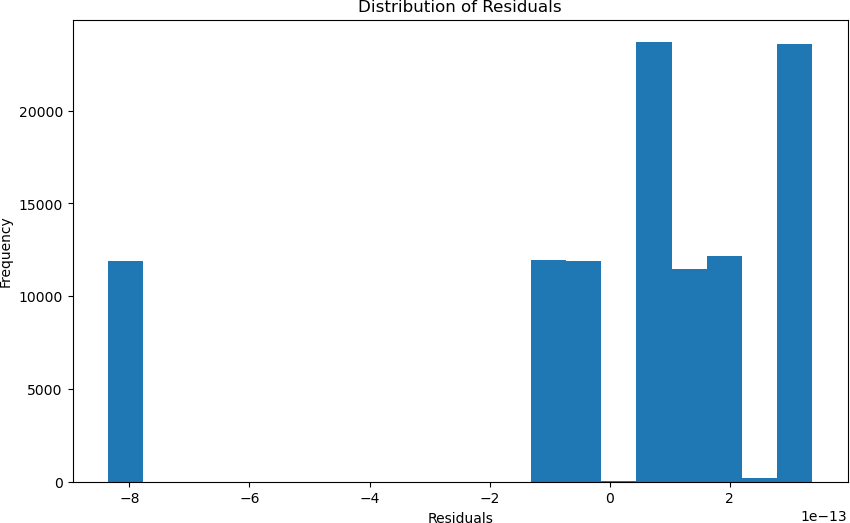
Similarly to the PFAS Accumulation Model, the accuracy of the machine learning model was calculated by finding the statistical values, which were verified through cross-validation, and the residu- als were calculated. The initial statistical values calculated for the machine learning model were a 0.00 MAE and a 1.00 R2 statistic. Furthermore, using cross-validation, the model still achieved an accuracy of 1.00. These values can be depicted through Figure 6, where it can be seen how the model is predicting the values with an incredibly high accuracy. Additionally, in Figure 7, you can see the plot of the distribution of the residuals, which shows an apparent discrepancy that spans a lot of data points. However, most of the data points are relatively close to the actual value.
On a 5-fold cross validation the model is achieves a R2 value of 1.00 and a MAE value of 0.00, showing the model is not just bound to the training data that was fed into it and it has based its information off of.
3.2. Feature Importance
After understanding the performance of the models, it is also essen- tial to understand the key features indicating these specific outputs. Additionally, due to the specific models chosen as discussed in the methodology, it can be seen what features were critical to the spe- cific models training rather than just looking at correlations within the dataset.
3.2.1. Kidney Type Prediction
The feature importances for the first model can be seen in Figure 8. The first model had some features with very high indications, but most did not correlate much with the type of kidney. The key features that can be seen in Figure X are the species of the anime and the proximal tubule diameter, which both seem to be understandable They both are reasonable indicators because the species directly affects the type and function of the kidney, which is critical to understanding which type it will be. Additionally, the proximal tubule diameter is a physical characteristic of kidneys, which indi- cates the type of kidney because it is a very clear descriptor of the kidney being affected.
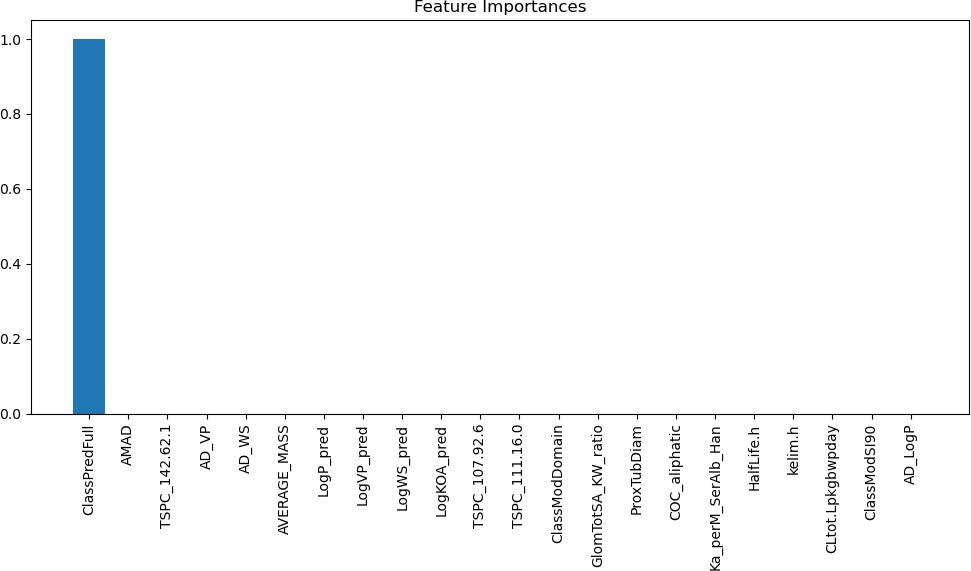
3.2.2. PFAS Accumulation Model
For this machine learning model, one feature that the model indi- cates has a direct correlation with the output of the model. The feature that the model is showing is the ClassPredFull, which is a metric inside of the dataset that tells us the level of exposure the body is to PFAS, which indicates that using this level, the machine learning algorithm is learning how to accurately predict how much PFAS is going to accumulate inside of the body and damage the kidney. This can be seen in Figure 9
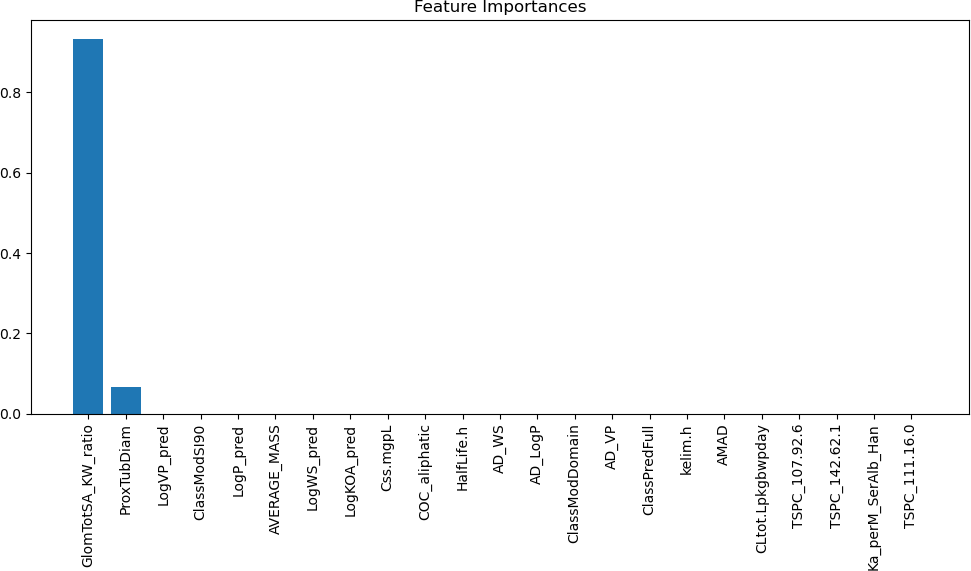
3.2.3. Glomerular Total Surface Area vs Proximal Tubule Predictor
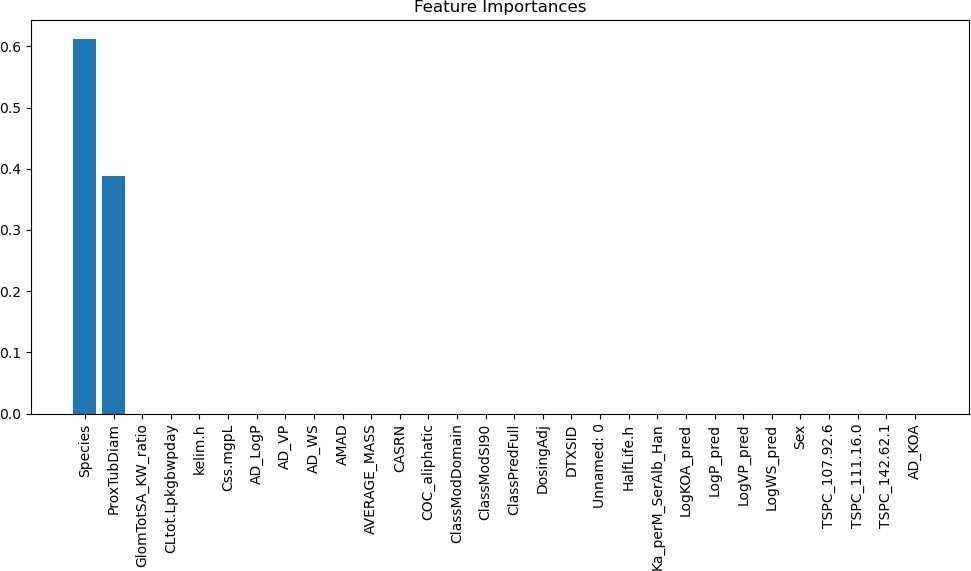
As seen in Figure 10, the third machine learning model indicates that two key features allow it to achieve a high accuracy. The two fea- tures that can indicate this are GlomTotSA KW ratio, which shows the ratio between the glomerular total surface area to the kidney weight, and the other feature, which can show a correlation to the output of this model is the diameter of the proximal tubule. Both of these features are understandable because they are descriptors of the physiological characteristics of the kidney or the specific proximal tubule, allowing for them to be correlated to the measurements that the machine learning model is concerned with predicting.
4. Biological Significance
As seen by the accuracy of the Kidney Type Prediction Model, we can safely verify previous studies and conclude that there is indeed a correlation between PFAS descriptors and kidneys to base the rest of our analysis. The ability of PFAS descriptors to predict kidney type with perfect accuracy suggests that PFAS compounds are not passive bystanders in the body but actively influence kidney mor- phology. As mentioned, PFAS, once absorbed into the bloodstream, can infiltrate renal tissues, where they interact with cellular compo- nents and trigger molecular responses [36]. This interaction may lead to structural changes in the kidneys, potentially altering the distribution of kidney types [37]. The fact that PFAS descriptors alone can reliably distinguish between different kidney types under- scores the pronounced and biologically meaningful impact of PFAS exposure on renal structures.
Furthermore, the model provides significance in early diagnoses and organ assessment by predicting the amount of PFAS accumula- tion in the kidneys utilizing an XGBoost Regressor. Understanding how PFAS chemicals accumulate in vital organs like the kidneys is crucial for assessing the long-term health impacts of PFAS exposure. By employing XGBoost, researchers gain a powerful tool for model- ing and predicting these accumulations, allowing for more accurate risk assessments and informed policy decisions. This predictive capability can guide regulatory bodies and healthcare providers in designing effective strategies to mitigate PFAS exposure and protect public health. By forecasting PFAS accumulation, we move beyond reacting to environmental contamination and instead proactively manage and mitigate its impacts.
The estimation of the ratio of Glomerular Total Surface Area (GlomTotSA) to the Volume of the Proximal Tubule (Prox- TubTotVol) also offers significant scientific insight into the health and performance of our kidneys. The GlomTotSA-to- ProxTubTotVol ratio holds the key to understanding the structural efficiency of the kidneys. The glomerular surface area represents the vast expanse of tiny filtering units within the kidney, where blood is meticulously sieved to remove waste and excess substances [38]. The volume of the proximal tubule reflects the space available for the reabsorption of essential substances into the bloodstream, a cru- cial process in maintaining bodily homeostasis [39]. When this ratio is higher, it suggests that the kidneys are adept at filtration and reab- sorption, indicative of a well-functioning organ [40]. This signifies that the kidneys efficiently clear waste and retain vital compounds, reflecting good renal health. Conversely, a lower GlomTotSA-to- ProxTubTotVol ratio can signify potential kidney morphology and function issues. This may point to structural alterations within the kidneys that affect their ability to filter and reabsorb substances optimally [41]. On a chemical level, this ratio can also be linked to the renal clearance of various substances, including drugs and toxins [42]. Understanding these chemical processes is pivotal for predict- ing how the kidneys will handle different compounds, informing medication dosages and toxicity assessments.
This ratio further provides insight into the complex interplay of filtration, reabsorption, and structural integrity within the kidneys [43]. It allows researchers to investigate the effects of PFAS expo- sure on these processes, potentially uncovering early indicators of kidney health issues. Moreover, it has applications beyond PFAS research, as it can be used as a valuable biomarker for assessing kid- ney function and diagnosing renal diseases. The ability to estimate this ratio with precision, informed by predictive PFAS accumulation models, represents a powerful tool for advancing our understanding of kidney health and clinical interventions and treatments.
However, the GlomTotSA-to-ProxTubTotVol ratio also offers a fruitful perspective on the intricate relationship between kidney structure and its functional role, particularly in the context of esti- mating glomerular filtration rate (eGFR) [44]. The eGFR is a critical indicator of kidney function, primarily based on factors like creati- nine levels, age, sex, and race, ultimately reflecting how efficiently the kidneys filter waste products from the bloodstream [45]. The GlomTotSA-to-ProxTubTotVol ratio and eGFR (estimated glomeru- lar filtration rate) in kidneys are interconnected in a complex and critical manner, biologically and chemically. This relationship is pivotal for understanding renal function, particularly how well the kidneys filter waste and maintain overall homeostasis in the body. The GlomTotSA-to-ProxTubTotVol ratio is essentially a representa- tion of the glomerular surface area relative to the proximal tubular volume, and eGFR is an estimate of the rate at which the glomeruli in the kidneys filter blood [46].
Biologically, this relationship hinges on the intricate anatomy and physiology of the renal system. The glomeruli, small tuft-like structures within the kidney, are the primary filtration units. They filter blood and allow water and solutes to enter the tubular sys- tem while retaining larger molecules like proteins. The proximal tubules, on the other hand, are involved in reabsorbing valuable substances such as glucose and electrolytes [42]. The ratio of the glomerular surface area to the proximal tubular volume reflects the balance between filtration and reabsorption in the kidney. A high GlomTotSA-to-ProxTubTotVol ratio suggests efficient filtration rel- ative to reabsorption, typically associated with better renal function [47]. When the kidneys function optimally, the eGFR is higher be- cause the glomeruli are efficiently filtering a greater blood volume, and waste products are being excreted. Conversely, if the ratio is skewed or compromised due to kidney damage or disease, the eGFR decreases, indicating impaired filtration capacity and potential renal dysfunction [48].
Chemically, the interaction is also governed by the intricate molecular exchange processes within the kidney. The glomeruli filter blood by using a combination of pressure-driven physical forces and the selective permeability of their basement membranes and podocyte cells [49]. These structures allow small molecules and water to pass into the renal tubules while preventing larger molecules like proteins from crossing over. The proximal tubules then selectively reabsorb essential molecules and regulate the con- centration of electrolytes and waste products in the urine [50]. The ratio signifies the efficiency of these filtration and reabsorption pro- cesses. When the balance between filtration and reabsorption is disrupted, such as in kidney damage, inflammation, or glomerular dysfunction, the GlomTotSA-to-ProxTubTotVol ratio can change [51]. This imbalance decreases eGFR, as less blood is effectively filtered and more waste products may accumulate in the bloodstream [52]. In this chemical interplay, disruptions in the GlomTotSA-to- ProxTubTotVol ratio can serve as a valuable indicator of kidney function and provide insights into renal health or dysfunction. This ratio may also signify how effectively the kidneys handle the ex- cretion of various substances. Efficient filtration and reabsorption are vital for maintaining electrolyte balance and eliminating waste, pharmaceuticals, and toxins from the body [53]. Therefore, if the ratio tilts towards a more significant glomerular surface area rela- tive to the proximal tubule volume, it may suggest that the kidneys can process substances more effectively, potentially contributing to higher eGFR values.
5. Discussion
5.1. Limitations
The models were based off of a single dataset, so a dataset with more diversity and different populations is necessary to truly assess the causality and relationships that the models are indicating are true from the data provided. Additionally, investigations into the biological mechanisms which are highlighted through the research study and experimental validation are necessary for understanding the true biological processes and pathways that are associated with PFAS and its effect on the body. Also, there are some confounding variables which could have potential effects on the results of the finding, such as environmental exposures which have the ability to effects the observed relationships.
5.2. Conclusion
This study demonstrates machine learning’s potential to elucidate the intricate impacts of PFAS on kidney health. The models pre- sented confirm discernible links between PFAS and renal function. The kidney type classifier verifies that PFAS alters morphology. The PFAS accumulation regressor enables clinical monitoring to protect at-risk groups. Estimating the GlomTotSA/ProxTubTotVol ratio provides significant insights into PFAS’s effects on filtration and reabsorption efficiency.
The models showcase PFAS’s multifaceted effects on kidney structure and function. The techniques pave the way for enhanced risk assessment, improved clinical surveillance, and targeted thera- peutics. This study underscores the power of machine learning to unravel PFAS toxicity mechanisms. It makes significant contribu- tions to the current understanding of PFAS nephrotoxicity.
The high predictive accuracy, feature importance analyses, and model interpretability reveal concrete biological impacts of PFAS on kidneys. PFAS descriptors actively influence morphology and accumulation. The ratio estimation sheds light on filtration and reabsorption dynamics. These findings confirm PFAS’s pronounced effects on renal physiology.
This research demonstrates machine learning’s immense po- tential for elucidating PFAS nephrotoxicity. The models provide actionable clinical insights and expand mechanistic knowledge of PFAS-kidney interplay. This paves the way for more informed risk analysis, earlier diagnosis of PFAS-associated kidney damage, and targeted therapies. The study sets a strong foundation for future machine-learning investigations into PFAS toxicity.
Conflict of Interest The authors declare no conflict of interest.
Acknowledgment We would like to thank the University of North Texas for providing us with the resources and support to conduct this research. The invaluable guidance and encouragement from our professors and mentors have been instrumental in shaping the di- rection and scope of this study. We would also like to acknowledge the National Kidney Foundation for their support and inspiration in conducting this project. Finally, we would also like to thank our families for supporting us throughout our research.
- J. Gl¨uge, M. Scheringer, I. T. Cousins, J. C. DeWitt, G. Goldenman, D. Herzke, R. Lohmann, C. A. Ng, X. Trier, Z. Wang, “An overview of the uses of perand polyfluoroalkyl substances (PFAS),” Environmental Science: Processes & Impacts, 22, 2345–2373, 2020, doi:10.1039/D0EM00291G.
- P. Dewapriya, L. Chadwick, S. G. Gorji, B. Schulze, S. Valsecchi, S. Samanipour, K. V. Thomas, S. L. Kaserzon, “Per- and polyfluoroalkyl substances (PFAS) in consumer products: Current knowledge and research gaps,” Journal of Hazardous Materials Letters, 4, 100086, 2023, doi:10.1016/j.hazl.2023.100086.
- B. E. Blake, S. E. Fenton, “Early life exposure to per- and polyfluoroalkyl substances (PFAS) and latent health outcomes: A review including the placenta as a target tissue and possible driver of peri- and postnatal effects,” Toxicology, 443, 152565, 2020, doi:10.1016/j.tox.2020.152565.
- D. Renfrew, T. W. Pearson, “The Social Life of the “Forever Chemical”,” Environment and Society, 12, 146–163, 2021, doi:10.3167/ares.2021.120109.
- M. Kotthoff, J. M¨uller, H. J¨urling, M. Schlummer, D. Fiedler, “Perfluoroalkyl and polyfluoroalkyl substances in consumer products,” Environmental Science and Pollution Research, 22, 14546–14559, 2015, doi:10.1007/s11356-015- 4202-7.
- S. A. B˘alan, V. C. Mathrani, D. F. Guo, A. M. Algazi, “Regulating PFAS as a Chemical Class under the California Safer Consumer Products Program,” Environmental Health Perspectives, 129, 2021, doi:10.1289/EHP7431.
- M. N. Ehsan, M. Riza, M. N. Pervez, M. M. O. Khyum, Y. Liang, V. Naddeo,“Environmental and health impacts of PFAS: Sources, distribution and sustainable management in North Carolina (USA),” Science of The Total Environment, 878, 163123, 2023, doi:10.1016/j.scitotenv.2023.163123.
- J. Fabregat-Palau, M. Vidal, A. Rigol, “Examining sorption of perfluoroalkyl substances (PFAS) in biochars and other carbon-rich materials,” Chemosphere, 302, 134733, 2022, doi:10.1016/j.chemosphere.2022.134733.
- G. Jha, V. Kankarla, E. McLennon, S. Pal, D. Sihi, B. Dari, D. Diaz, M. Nocco,“Per- and Polyfluoroalkyl Substances (PFAS) in Integrated Crop–Livestock Systems: Environmental Exposure and Human Health Risks,” International Journal of Environmental Research and Public Health, 18, 12550, 2021, doi:10.3390/ijerph182312550.
- B. E. Blake, S. M. Pinney, E. P. Hines, S. E. Fenton, K. K. Ferguson, “Associations between longitudinal serum perfluoroalkyl substance (PFAS) levels and measures of thyroid hormone, kidney function, and body mass index in the Fernald Community Cohort,” Environmental Pollution, 242, 894–904, 2018, doi:10.1016/j.envpol.2018.07.042.
- M. L. Ljubicic, A. Madsen, A. Juul, K. Almstrup, T. H. Johannsen, “The Application of Principal Component Analysis on Clinical and Biochemical Parameters Exemplified in Children With Congenital Adrenal Hyperplasia,” Frontiers in Endocrinology, 12, 2021, doi:10.3389/fendo.2021.652888.
- M. Bonato, F. Corr`a, M. Bellio, L. Guidolin, L. Tallandini, P. Irato, G. Santovito,“PFAS Environmental Pollution and Antioxidant Responses: An Overview of the Impact on Human Field,” International Journal of Environmental Research and Public Health, 17, 8020, 2020, doi:10.3390/ijerph17218020.
- K. M. Fraley, H. N. Fraley, D. Arthur, E. J. Walther, “Per- and Polyfluoroalkyl Substances ( PFAS ): Anglers May Be Exposed to Harmful Chemicals in Their Catch,” Fisheries, 45, 138–144, 2020, doi:10.1002/fsh.10389.
- L. Anderko, E. Pennea, “Exposures to per-and polyfluoroalkyl substances (PFAS): Potential risks to reproductive and children’s health,” Current Problems in Pediatric and Adolescent Health Care, 50, 100760, 2020, doi:10.1016/j.cppeds.2020.100760.
- S. H. Baker, A. Kinde, “The Pathway to a Green New Deal: Synthesizing Transdisciplinary Literatures and Activist Frameworks to Achieve a Just Energy Transition,” Environs: Environmental Law and Policy Journal, 44, 1–40.
- P.-I. D. Lin, A. Cardenas, R. Hauser, D. R. Gold, K. P. Kleinman, M.-F. Hivert, A. M. Calafat, T. F. Webster, E. S. Horton, E. Oken, “Per- and polyfluoroalkyl substances and kidney function: Follow-up results from the Diabetes Prevention Program trial,” Environment International, 148, 106375, 2021, doi:10.1016/j.envint.2020.106375.
- W. PFALLER, M. RITTINGER, QUANTITATIVE MORPHOLOGY OF THE RAT KIDNEY, 17–22, Elsevier, 1980, doi:10.1016/B978-0-08-025517- 0.50011-4.
- J. Yun, E.-C. Jang, S.-C. Kwon, Y.-S. Min, Y.-J. Lee, “The association of perfluoroalkyl substances (PFAS) exposure and kidney function in Korean adolescents using data from Korean National Environmental Health Survey (KoNEHS) cycle 4 (2018–2020): a cross-sectional study,” Annals of Occupational and Environmental Medicine, 35, 2023, doi:10.35371/aoem.2023.35.e5.
- J. W. Stanifer, H. M. Stapleton, T. Souma, A. Wittmer, X. Zhao, L. E. Boulware,“Perfluorinated Chemicals as Emerging Environmental Threats to Kidney Health,” Clinical Journal of the American Society of Nephrology, 13, 1479– 1492, 2018, doi:10.2215/CJN.04670418.
- B. Conway, A. Badders, T. Costacou, J. Arthur, K. Innes, “Perfluoroalkyl substances and kidney function in chronic kidney disease, anemia, and diabetes,”Diabetes, Metabolic Syndrome and Obesity: Targets and Therapy, Volume 11, 707–716, 2018, doi:10.2147/DMSO.S173809.
- F. Coperchini, L. Croce, G. Ricci, F. Magri, M. Rotondi, M. Imbriani, L. Chiovato,“Thyroid Disrupting Effects of Old and New Generation PFAS,” Frontiers in Endocrinology, 11, 2021, doi:10.3389/fendo.2020.612320.
- A. Raza, S. Bardhan, L. Xu, S. S. R. K. C. Yamijala, C. Lian, H. Kwon, B. M. Wong, “A Machine Learning Approach for Predicting Defluorination of Per- and Polyfluoroalkyl Substances (PFAS) for Their Efficient Treatment and Removal,” Environmental Science & Technology Letters, 6, 624–629, 2019, doi:10.1021/acs.estlett.9b00476.
- C.-W. Huang, R. Lu, U. Iqbal, S.-H. Lin, P. A. Nguyen, H.-C. Yang, C.-F. Wang, J. Li, K.-L. Ma, Y.-C. Li, W.-S. Jian, “A richly interactive exploratory data analysis and visualization tool using electronic medical records,” BMC Medical Informatics and Decision Making, 15, 92, 2015, doi:10.1186/s12911- 015-0218-7.
- D. E. Dawson, C. Lau, P. Pradeep, R. R. Sayre, R. S. Judson, R. Tornero-Velez, J. F. Wambaugh, “A Machine Learning Model to Estimate Toxicokinetic Half- Lives of Per- and Polyfluoro-Alkyl Substances (PFAS) in Multiple Species,” Toxics, 11, 2023, doi:10.3390/toxics11020098.
- R. Paul, A. S. M. L. Hoque, “Clustering medical data to predict the likelihood of diseases,” in 2010 Fifth International Conference on Digital Information Management (ICDIM), 44–49, 2010, doi:10.1109/ICDIM.2010.5664638.
- X. Gong, L. Liu, S. Fong, Q. Xu, T. Wen, Z. Liu, “Comparative Research of Swarm Intelligence Clustering Algorithms for Analyzing Medical Data,” IEEE Access, 7, 137560–137569, 2019, doi:10.1109/ACCESS.2018.2881020.
- J. Ma, Z. Yu, Y. Qu, J. Xu, Y. Cao, “Application of the XGBoost Machine Learning Method in PM2.5 Prediction: A Case Study of Shanghai,” Aerosol and Air Quality Research, 20, 128–138, 2020, doi:10.4209/aaqr.2019.08.0408.
- H. Liang, K. Jiang, T.-A. Yan, G.-H. Chen, “XGBoost: An Optimal Machine Learning Model with Just Structural Features to Discover MOF Adsorbents of Xe/Kr,” ACS Omega, 6, 9066–9076, 2021, doi:10.1021/acsomega.1c00100.
- J. Li, X. An, Q. Li, C. Wang, H. Yu, X. Zhou, Y. ao Geng, “Application of XGBoost algorithm in the optimization of pollutant concentration,” Atmospheric Research, 276, 106238, 2022, doi:10.1016/j.atmosres.2022.106238.
- A. Ogunleye, Q.-G.Wang, “XGBoost Model for Chronic Kidney Disease Diagnosis,” IEEE/ACM Transactions on Computational Biology and Bioinformatics, 17(6), 2131–2140, 2020, doi:10.1109/TCBB.2019.2911071.
- X. Zhang, C. Yan, C. Gao, B. A. Malin, Y. Chen, “Predicting Missing Values in Medical Data Via XGBoost Regression,” Journal of Healthcare Informatics Research, 4, 383–394, 2020, doi:10.1007/s41666-020-00077-1.
- R. Sapir-Pichhadze, B. Kaplan, “Seeing the Forest for the Trees: Random Forest Models for Predicting Survival in Kidney Transplant Recipients,” Transplantation, 104, 905–906, 2020, doi:10.1097/TP.0000000000002923.
- A. Subasi, E. Alickovic, J. Kevric, Diagnosis of Chronic Kidney Disease by Using Random Forest, 589–594, 2017, doi:10.1007/978-981-10-4166-2 89.
- M. Z. Alam, M. S. Rahman, M. S. Rahman, “A Random Forest based predictor for medical data classification using feature ranking,” Informatics in Medicine Unlocked, 15, 100180, 2019, doi:10.1016/j.imu.2019.100180.
- P. G. Polishchuk, E. N. Muratov, A. G. Artemenko, O. G. Kolumbin, N. N. Muratov, V. E. Kuz’min, “Application of Random Forest Approach to QSAR Prediction of Aquatic Toxicity,” Journal of Chemical Information and Modeling, 49, 2481–2488, 2009, doi:10.1021/ci900203n.
- E. Gorrochategui, S. Lacorte, R. Tauler, F. L. Martin, “Perfluoroalkylated Substance Effects in Xenopus laevis A6 Kidney Epithelial Cells Determined by ATR-FTIR Spectroscopy and Chemometric Analysis,” Chemical Research in Toxicology, 29, 924–932, 2016, doi:10.1021/acs.chemrestox.6b00076.
- J. Zhao, P. Hinton, J. Chen, J. Jiang, “Causal inference for the effect of environmental chemicals on chronic kidney disease,” Computational and Structural Biotechnology Journal, 18, 93–99, 2020, doi:10.1016/j.csbj.2019.12.001.
- R. B. Jain, A. Ducatman, “Associations between the concentrations of α-klotho and selected perfluoroalkyl substances in the presence of eGFR based kidney function and albuminuria: Data for US adults aged 40–79 years,” Science of The Total Environment, 838, 155994, 2022, doi:10.1016/j.scitotenv.2022.155994.
- B. M. Brenner, J. L. Troy, T. M. Daugharty, I. F. Ueki, D. P. Nicholas, C. F. Wong, “On the Mechanism of Inhibition in Fluid Reabsorption by the Renal Proximal Tubule of the Volume-Expanded Rat,” Journal of Clinical Investigation, 50, 1596–1602, 1971, doi:10.1172/JCI106647.
- R. Quigley, “Androgens stimulate proximal tubule transport,” Gender Medicine, 5, S114–S120, 2008, doi:10.1016/j.genm.2008.03.011.
- A. Quan, S. Chakravarty, J.-K. Chen, J.-C. Chen, S. Loleh, N. Saini, R. C. Harris, J. Capdevila, R. Quigley, “Androgens augment proximal tubule transport,” American Journal of Physiology-Renal Physiology, 287, F452–F459, 2004, doi:10.1152/ajprenal.00188.2003.
- A. A. McDonough, “Mechanisms of proximal tubule sodium transport regulation that link extracellular fluid volume and blood pressure,” American Journal of Physiology-Regulatory, Integrative and Comparative Physiology, 298, R851–R861, 2010, doi:10.1152/ajpregu.00002.2010.
- B. Kaissling, I. Hegyi, J. Loffing, M. Hir, “Morphology of interstitial cells in the healthy kidney,” Anatomy and Embryology, 193, 1996, doi:10.1007/BF00186688.
- P. Delanaye, R. P. Radermecker, M. Rorive, G. Depas, J. M. Krzesinski, “Indexing glomerular filtration rate for body surface area in obese patients is misleading: concept and example,” Nephrology Dialysis Transplantation, 20, 2024–2028, 2005, doi:10.1093/ndt/gfh983.
- J. R. Nyengaard, T. F. Bendtsen, “Glomerular number and size in relation to age, kidney weight, and body surface in normal man,” The Anatomical Record, 232, 194–201, 1992, doi:10.1002/ar.1092320205.
- C. C. Geddes, Y. M.Woo, S. Brady, “Glomerular filtration rate what is the rationale and justification of normalizing GFR for body surface area?” Nephrology Dialysis Transplantation, 23, 4–6, 2007, doi:10.1093/ndt/gfm662.
- G. Vervoort, B. Veldman, J. H. M. Berden, P. Smits, J. F. M.Wetzels, “Glomerular hyperfiltration in type 1 diabetes mellitus results from primary changes in proximal tubular sodium handling without changes in volume expansion,” European Journal of Clinical Investigation, 35, 330–336, 2005, doi:10.1111/j.1365- 2362.2005.01497.x.
- W.-A. S. Mula-Abed, K. A. Rasadi, D. A. Riyami, “Estimated Glomerular Filtration Rate (eGFR): A Serum Creatinine-Based Test for the Detection of Chronic Kidney Disease and its Impact on Clinical Practice,” Oman Medical Journal, 27, 108–113, 2012, doi:10.5001/omj.2012.23.
- S. Rayego-Mateos, R. Rodrigues-Diez, J. L. Morgado-Pascual, F. Valentijn, J. M. Valdivielso, R. Goldschmeding, M. Ruiz-Ortega, “Role of Epidermal Growth Factor Receptor (EGFR) and Its Ligands in Kidney Inflammation and Damage,” Mediators of Inflammation, 2018, 8739473, 2018, doi:10.1155/2018/8739473.
- J. Tang, N. Liu, E. Tolbert, M. Ponnusamy, L. Ma, R. Gong, G. Bayliss, H. Yan, S. Zhuang, “Sustained Activation of EGFR Triggers Renal Fibrogenesis after Acute Kidney Injury,” The American Journal of Pathology, 183, 160–172, 2013, doi:https://doi.org/10.1016/j.ajpath.2013.04.005.
- C. A. O’Callaghan, B. Shine, D. S. Lasserson, “Chronic kidney disease: a large-scale population-based study of the effects of introducing the ¡em¿CKDEPI¡/ em¿ formula for eGFR reporting,” BMJ Open, 1, e000308, 2011, doi:10.1136/bmjopen-2011-000308.
- N. Richards, K. Harris, M. Whitfield, D. O’Donoghue, R. Lewis, M. Mansell, S. Thomas, J. Townend, M. Eames, D. Marcelli, “The impact of populationbased identification of chronic kidney disease using estimated glomerular filtration rate (eGFR) reporting,” Nephrology Dialysis Transplantation, 23, 556–561, 2008, doi:10.1093/ndt/gfm839.
- J. A. Hirst, M. D. L. A. V. Montes, C. J. Taylor, J. M. Ord´o˜nez-Mena, E. Ogburn, V. Sharma, B. Shine, T. James, F. D. R. Hobbs, “Impact of a single eGFR and eGFR-estimating equation on chronic kidney disease reclassification: a cohort study in primary care,” British Journal of General Practice, 68, e524, 2018, doi:10.3399/bjgp18X697937.