Spatial Distribution Patterns of the Royal Development Projects Initiated by King Rama 9th of Thailand
Volume 9, Issue 2, Page No 26-32, 2024
Author’s Name: Puntip Jongkroy, Ponthip Limlahapuna)
View Affiliations
Geography Department, Kasetsart University, Bangkok, 10900, Thailand
a)whom correspondence should be addressed. E-mail: thip.limlahapun@gmail.com
Adv. Sci. Technol. Eng. Syst. J. 9(2), 26-32 (2024); ![]() DOI: 10.25046/aj090204
DOI: 10.25046/aj090204
Keywords: King Rama IX, Spatial distribution patterns, Spatial web-based, The Royal development projects, Virtual platform learning

Export Citations
The study aimed to create a chronological overview of the royal development projects initiated by King Rama IX and to analyze their spatial distribution patterns. The research used a mixed-methods approach, combining quantitative and qualitative data collection methods such as obtaining data from relevant offices, internet research, and field observations. Data analysis involved descriptive statistics and content analysis across three dimensions as temporal, spatial, and disciplinary. The findings were visualized using digital mapping, tables, and diagrams. The analysis revealed that over King Rama IX’s seven-decade reign, there was a strong focus on improving the lives of marginalized populations in areas with limited development opportunities and services. The research specifically aimed to 1) present the timeline of changes in the number of royal development projects and 2) analyze the spatial distribution patterns of these projects. The minor objectives included analyzing the patterns of the projects and their spatial distribution. The spatial distribution of the royal development projects was found to be extensive, covering various regions of the country from north to south. However, while there was comprehensive information on the projects, there was no centralized spatial database. Online data accessibility provided a flexible way for users to access project information based on their interests. Additionally, a virtual learning platform was developed to engage younger generations and present the research findings in a more engaging and accessible manner.
Received: 05 January 2024, Revised: 15 March 2024, Accepted: 16 March 2024, Published Online: 31 March 2024
1. Introduction
The current polarization of ideas in society, exacerbated by political differences, has widened the generation gap in thinking. This divide has expanded beyond political matters to include challenges to the monarchy, often seen on platforms like Twitter, Facebook, and Instagram. While there is a growing demand for democratic change, actions against the monarchy, especially considering King Rama IX’s contributions, based on distorted data from unreliable sources, unfairly undermine one of the country’s key institutions. This research focuses on analyzing data related to King Rama IX’s royal duties over his seven-decade reign, particularly emphasizing the Royal Development Projects initiated. Quantitative methods were used to analyze the spatial distribution patterns of these projects, with the findings presented through maps, tables, graphs, and diagrams. This study, along with a related project titled “Development Web Spatial Database System of the Royal Projects under the Inspiration of King Rama 9th” [1], which employs web-based GIS for easy retrieval and comprehension, aims to accurately showcase the late King’s contributions. The data were categorized into two main types: those with identifiable locations (e.g., reservoir development projects, road construction, schools, hospitals) and those without (e.g., scholarships, public health initiatives, facilities, utilities, conservation and reforestation efforts). To process the data, three approaches were employed which are geocoding to reference coordinate locations using Python in Jupyter and Anaconda, creating project locations as points using QGIS (an open-source GIS software) and storing geospatial data using GeoServer and Openlayers. Additionally, a website was developed using HTML and PHP to integrate the web-based system, enabling users to visualize project information on a map [2] and access detailed project data without needing to install software.
2. Research Materials and Methods
2.1. Scope of Study
Quantitative and qualitative data collection and analysis methods.
- Spatial dimension: Thailand and analyzed at the provincial and the regional levels. The six geographic regions and their respective provinces under study are 21 provinces and 1 metropolis in the Central Region, 9 provinces in the Northern Region, 7 provinces in the Eastern Region, 20 provinces in the Northeastern Region, 14 provinces in the Southern Region, and 5 provinces in the Western Region.
- Temporal dimension : The changes in the number of the royal development projects throughout the 70 years of the late King’s reign from 1946 when he ascended to the throne to 2016, the year of his passing. The changes were divided into 7 periods of 10 years each: from 1946-1956 through to 2007-2016, and illustrated with diagrams.
- Disciplinary dimension : The disciplinary focus was divided into two major issues in harmony with the research objectives as timeline of the project development based on changes in the number of the royal projects in each decade of the reign classified provincially by the project type.The spatial distribution of the projects in each province and each region was analyzed by comparing the number of the projects to 100,000 population on the provincial and the regional. For the demographic and urbanization perspective, the researchers analyzed the level of urbanization, population density, and the average population growth rate. Finally, the constraint to development from the physical perspective was scrutinized through topography and infrastructures.
These concepts were grouped into eight categories by the Office of the Royal Development Project Board (ORDPB) to be summarized into “the project pattern” in three major groups, as follows. Development projects on resources and the environment (water supply source projects and other environmental and resource projects). Sectoral development projects (agricultural projects; socio-economic project consisting of occupational support, public health, social and educational projects; and infrastructure projects, namely, those involving transportation and communication). Other development projects (projects with integrated concepts or agricultural projects based on the late King’s New Theory) [3].
Software and techniques utilized primarily on spatial web-based application. During the web development phase, the focus was on effectively managing data, handling backend operations, and ensuring a user-friendly interface. The system preparation was divided into four main components, namely geocoding, geospatial server setup, database management, and web development.
Geocoding, a notable aspect of this process included restructuring more than 4,500 project records in MS Excel to facilitate streamlined location searches [4]. This required the conversion of address text into geographic coordinates (latitude and longitude) [5], facilitating accurate mapping of locations. While users typically engaged through a Google web browser without the requirement for additional software installation or programming proficiency, the scale of data prompted the adoption of a scripted approach to simultaneously locate multiple locations. The Anaconda and Jupyter environment were set up to execute Python programming for acquiring geocoordinates [6].
GeoServer, a freely available geospatial server environment, is utilized for storing spatial data in diverse formats such as geopackage, shapefile, image, PostGIS, among others. It operates seamlessly on the Windows operating system or functions as a web server service.
General databases such as MySQL and MS Access lack spatial capabilities. Instead, project information was stored using PostGIS, PostgreSQL, and PgAdmin software [7-9]. The developed system incorporates interactive time-series data on an annual basis. Hence, project information was loaded into PostgreSQL and organized based on the dates when the projects were initiated.
Geoserver and web elements were incorporated to provide users with project information presented in spatial and non-spatial formats [10]. Additionally, interactive time-series maps and virtual learning platforms were integrated to enrich user engagement and enhance comprehension of the data.
2.2. Literature Reviews
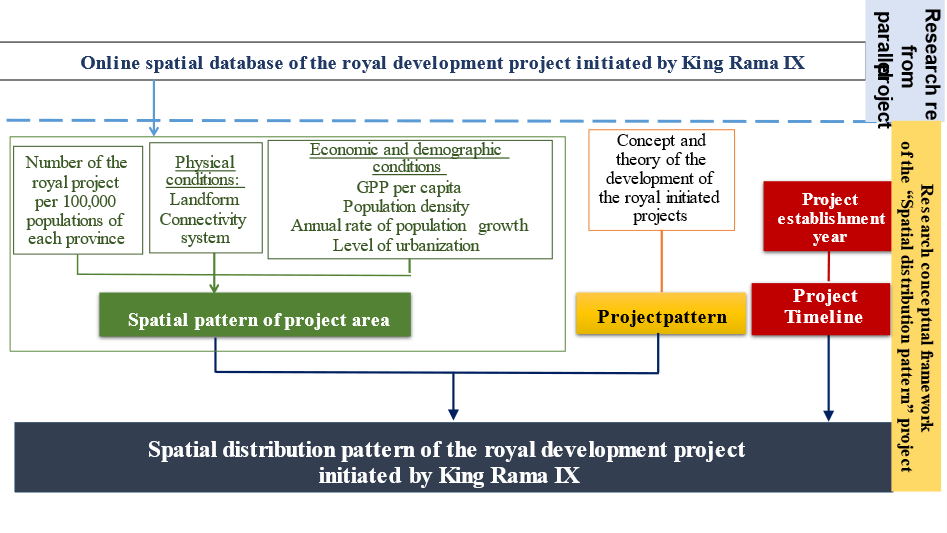
Analysis on the spatial distribution pattern is part of the spatial process analyses that focuses on the dynamic locational decision-making for land use activities. In [11], the authors highlighted human geographer’s interests in people and places that are key to understanding of natural and human-made geographic phenomenon. In this regard, distribution, diffusion, and interaction are the main subsections of the concepts of interaction, communication, and movement on the earth surface. Similarly, in [12], the authors described spatial distribution as the starting point for analyzing the structured content of place that distinguishes geography from other sciences. Common elements to analyze spatial distributions are density, dispersion, and pattern. In [13], the author aims to describe the regular distribution of objects in space. By observing spatial arrangement of research objects across the earth the three properties of distribution: density, concentration, and pattern can be analyzed. For the purpose of the analysis of spatial distribution pattern, the spatial geometric arrangement of interested objects involved two features: 1) the data for the number of projects in each administrative division are depicted by polygons; and 2) quantitative data across an area or surface are illustrated with various shades of color. The research conceptual framework is presented in Figure 1.
The challenge with spatial data lies in accurately locating all the projects. Traditional techniques for converting address text to geographic coordinates using ArcGIS software are not suitable for Thai addresses. Instead, the Geocoding Application Interface (Geocoding API) from Google is utilized to convert text addresses into geographic coordinates, represented as latitude and longitude [14]. To streamline this process, a custom-written program is employed to handle multiple records simultaneously, eliminating the need for manual searches through Google. This automated approach improves efficiency and accuracy in geocoding a large volume of project records.
In summary, this research project was designed to transform the number of projects and the spatial data on provinces and regions into the ordinal scale. Indices and criteria used in the spatial ordering were set for five issues. They were the spatial ordering of project distribution per 100,000 population in each province of each region; the ordering by economic index (per capital income); the ordering of population and urbanization (annual average of population growth rate, level of urbanization, and population density). Five levels of ordering and interpretation were set including the summary of the overall development level in each province, as shown in Table 1.
Table 1: Development Level
| Number of projects per capital | Economic index | Population and urbanization indices | Level | ||
|
GPP per capita (USD/ year) 1 |
Average annual growth rate (%)2 | % of urban population3 | Population density (per sq.km.) 4 | Interpretation | |
|
Very few (0.08-5.69) |
Low (<1,045) |
Contracted (<0.00) |
Low-very low (<30%) |
Low-very low (<100) |
Low |
|
Few (5.70-11.30) |
Middle-low (1,046-4,125) |
Low (0.00-0.34) |
Moderate (30.1-40%) |
Low (101-250) |
Slightly low |
|
Moderate (11.31-16.91) |
Middle (4,126-8,431) |
Moderate (0.35-1.00) |
Slightly high (40.1-60%) |
Moderate (201-500) |
Moderate |
|
Slightly large (16.92-22.52) |
Middle-high (8,432-12,735) |
Slightly high (1.01-2.00) |
High (60.1-80%) |
Slightly high (501-1,000) |
Slightly high
|
|
Large (22.53-28.13) |
High (>12,735) |
High (>2.00) |
Very high (>80%) |
High-very high (>1,000) |
High
|
Remarks: 1Applied from the criteria of national development level according to the World Bank’s average income per capita [15]..; 2Classified by the maximum and minimum values from research results; 3Applied from the United Nations’ guideline on urbanization classification [16].;4Applied from CIESIN’s criteria (Center for International Earth Science Information Network [17].
The developed website integrates virtual learning platforms [18] aimed at involving younger generations in comprehending the vision and concepts driving project development. This includes knowledge about the philosophy and theories of His Majesty King Bhumibol Adulyadej’s reign, focusing on projects like the Sufficiency Economy, the Chai Pattana Aerator, a floating buoy that rotates slowly to pump oxygen into wastewater, and Soil Development. These initiatives aim to address issues such as soil acidity, saline soil, vetiver grass, and the prevention of soil erosion and degradation.
3. Results
3.1. Timeline of Changes in the Number of the Royal Development Projects
Quantitative data analysis together with the temporal dimension indicated that 42% of the royal development projects were carried out in the fourth decade of the late King’s reign (1977-1986). Only a small number of these projects (0.3%-20%) took place in other decades. It can be argued that the royal development projects were concentrated mostly Table 1. Criteria to summarize “level of area” for spatial pattern analysis of projects with multi-faceted factor displayed with the radar graph. in the fourth decade, especially the water supply source development projects—when as many as 93% of them were implemented. In the fourth decade of the late King’s reign, Thailand was in the 4th and 5th National Socio-economic Development Plans. It was also the period of economic transition for Thailand, from an agricultural country to one of the newly industrialized countries. Discovery of natural gas in the Gulf of Thailand had spurred economic growth especially in manufacturing and urban infrastructure system. At the same time, remote rural areas had no accessibility to such development (Figure 2). Moreover, the 4th decade of the late King’s reign saw the world in turmoil from the oil crisis that negatively impacted people’s lives. Development of the royal development projects, then, put the emphasis primarily on water supply source for the agricultural sector followed by the promotions of occupation, society, and education, as well as other projects such as the New Theory for agriculture or those with integrated activities within the same project. These projects were found mainly outside the metropolitan area.
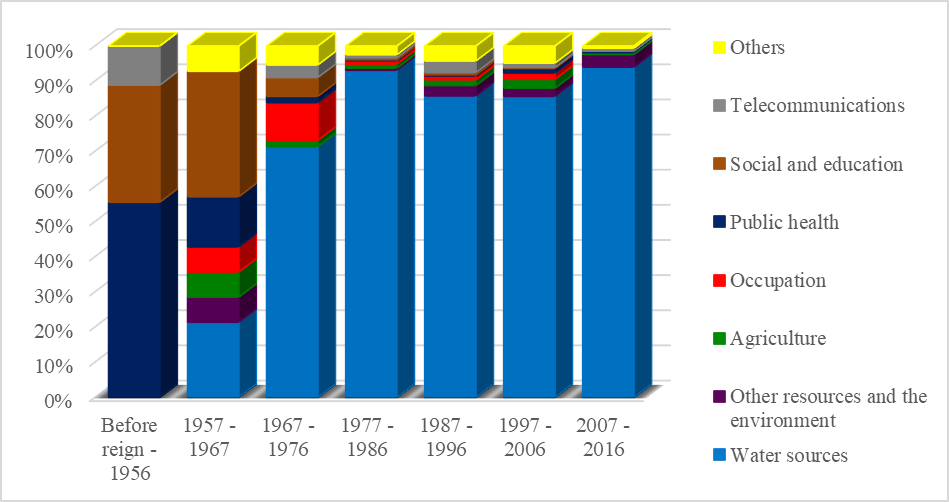
Towards the end of the 4th decade, the “Royal Development Center” had been inaugurated in every region. Each center is the hub of efficient coordination and dis-semination of all the royal development projects throughout the regions, supported by numerous experimental projects King Rama IX had established on the grounds of the Chitralada Rahotan Royal Residence. The inauguration of these regional centers and the acceleration of the experimental pilot projects truly laid the strong foundation and the manifestation of sustainable progress of the royal development projects. Features of the above-mentioned development projects were different from the previous three decades that mainly involved projects focusing on people’s quality of life, first in the capital and eventually diffused to other regions, specifically to the West and the North. However, the issues regarding the King’s health particularly in the last three decades of His reign (5th-7th decades) saw a sharp drop in the number of new projects. These mainly involved transportation and communication, resources and the environment, and public health. Such projects were the direct act in response to the dilapidated natural resources and the environment from industrial development and urbanization. It should be pointed out that development projects concerning transportation and communication had markedly increased in the 5th decade of His reign (1987-1996) with the continuation of infrastructure system development to support urbanization in Thailand from the previous decades. In the latter part of His reign, the area of the royal development projects had been scattering in almost every province of the country, with the metropolitan area taking the backseat. Projects concerning flood mitigation in the metropolis were initiated in the 6th decade but none in the 7th decade. Overall, it is clear that in all the decades of King Rama IX’s reign, the royal development projects all aimed at fighting poverty in both urban and rural areas, with great emphasis on the most underprivileged groups in remote rural areas.
3.2. Spatial distribution pattern of the royal development project
- Pattern of the royal development project.
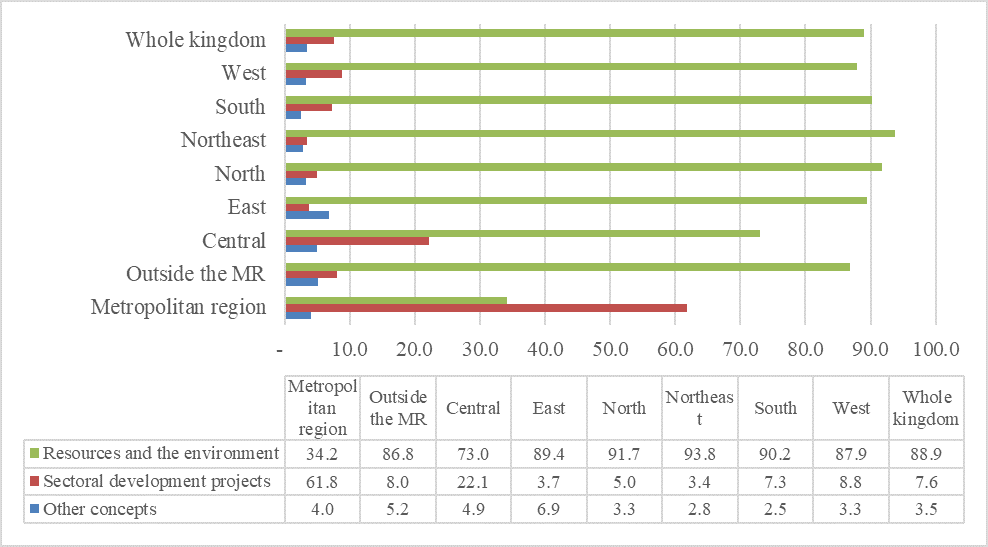
From the three groups of the royal development projects, namely, projects on re-sources and the environment, regional-based development projects, and other projects, it was found that 88.9% of them involved resources and the environment. Among these were mainly for water supply source–the major pattern of the royal development project that could be found in every region, especially in the North. Overall, the distribution of the royal development projects, as illustrated in Figure 3, could be summarized in two patterns.
The first pattern was based on the development concept for resources and the environment. Almost all of the projects in this pattern involved water supply source development and were established in almost every region in Thailand, except in the metropolitan area known as Bangkok Metropolitan Region (BMR) (comprising of Bangkok Metropolis or Krung Thep Maha Nakhon and its 5 vicinity provinces: Nonthaburi, Pathum Thani, Samut Prakarn, Samut Sakhon, and Nakhon Pathom provinces). Nevertheless, differences in the pattern of regional development concept were discovered. In this regard, the North, the Northeast, and the South had well over 90% of all the projects whereas the East, the West, and the Central, with the exception of BMR had 80.1-90%. Overall, only 40-80% of all the projects in the Central Region (including BMR) involved resources and the environment. The second pattern was based on various sectoral project development concepts and was found to cover as much as 60% of all the projects. In this pattern, the development project for resources and the environment was not the major concept as found in other regions of the country. This second pattern was found specifically in the metropolitan area, consisting of Bangkok Metropolis and the surrounding five provinces.
- Spatial pattern of the royal development project
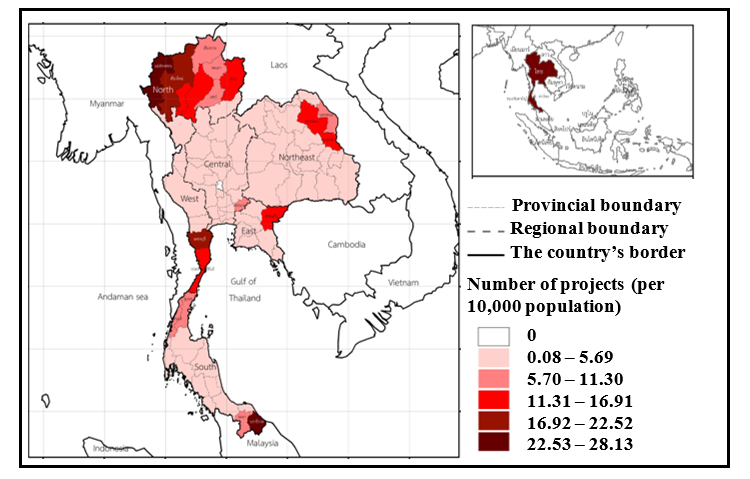
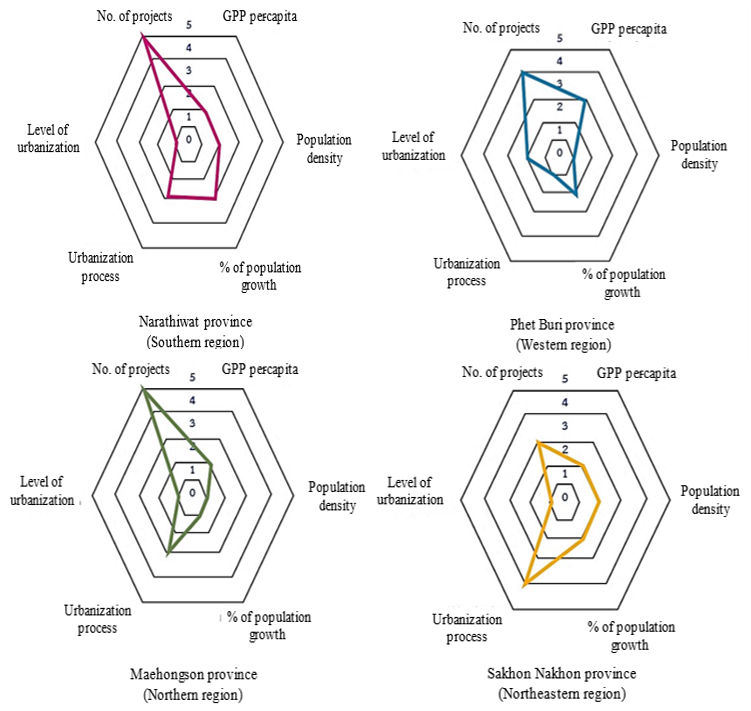
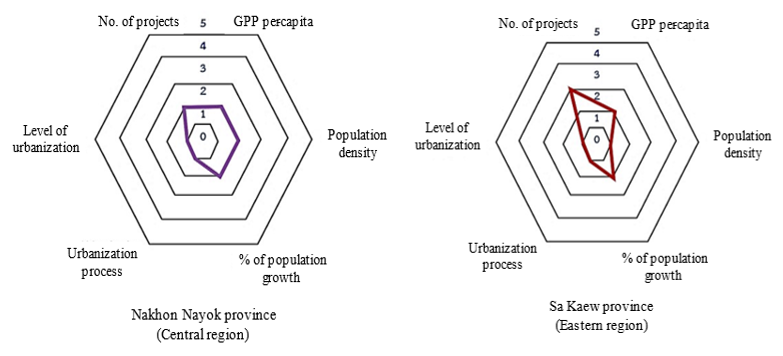
Results from spatial distribution analysis of the 2,738 royal development projects in Thailand on the regional basis albeit the total number of projects, the project density per area, or the number of projects per capita—clearly showed the dominance of the North as a major development target with 838 projects or 31% of all the projects in the country. The project density in the North was 9 per 1,000 square kilometers (higher than the national average of 5:1,000 sq.km.) with the highest project numbers per capita of 13.25 per 100,000 population whereas other regions had less than 6 projects per capita. When the data on the number of projects per 100,000 population in each province were depicted in the spatial distribution map of the royal development project, it was found that the province with the highest number of projects per capita was Mae Hong Son in the North (28.11 projects), followed by Narathiwat in the South (25.98 projects). These two provinces had the highest project density, as shown in Figure 4.
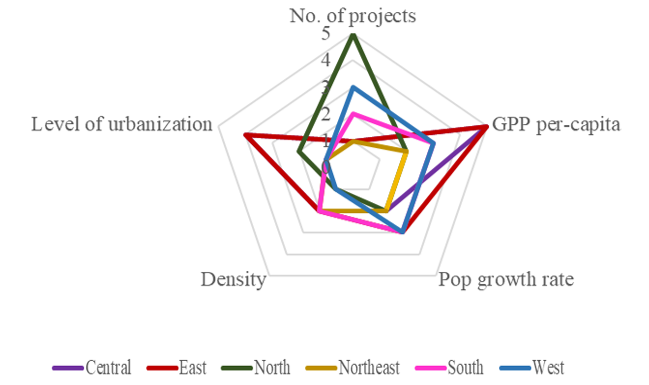
Results of the spatial pattern analysis in terms of the economic, demographic, and urbanization perspectives together with the number of projects per 100,000 population as illustrated in the radar chart (Figures 5 and 6) could be interpreted into the findings on the regional and provincial spatial pattern (showing the selected provinces with the highest number of project per capita in each region only), as follows. The regional perspective, it was found that the North, a target area for the royal development project, is mostly mountainous interspersed with hills, valleys, and
intermontane basins. Steep areas are headwaters of numerous rivers and creeks. On the socio-economic condition, its population had “middle to low income” which was the lowest income level found in Thailand; its economic base was mixed, its population density was “low”, its average annual population growth rate was “low”, and its urbanization was “moderate”. In fact, the North is the only region experiencing population contraction with six out of nine provinces having lost their population in recent years which was similar or lower than almost every region in Thailand. The provincial perspective, the two provinces with the highest number of projects per capita in the country, classified as the “high” level were Mae Hong Son (28.11 projects) and Narathiwat (25.98 projects). The socio-economic conditions in almost all dimensions of these two provinces were in the “low-lowest” levels in comparison to other provinces in their respective region. Direct fieldwork survey in Mae Hong Son, with the highest number of projects in the country, indicated that most of the royal development projects were in remote areas and far from the provincial center. Its population had limited infrastructure system in both public utility and public facility.
3.3. Web development
The web component is intended to enable the sharing of data and information. Data is organized by project types and provinces. The web development is dynamic and comprehensive, incorporating complex web applications that present detailed project information in an interactive and user-friendly manner. An example of this is the virtual learning platform depicted in Figure 7. The website can be accessed at [19].
4. Discussions
The spatial distribution of the royal development projects in the seven decades of His reign could be summarized into two major parts: timeline, and spatial patterns of the distribution of royal development projects in all regions of Thailand during the past seven decades of His reign.
4.1. Timeline of the Royal Development Projects
The distribution of the 2,738 projects were mostly initiated in the fourth decade of His reign (1977-1986) when Thailand was in the process of laying down the infrastructure that was the foundation of national development to become a newly industrialized country. The fourth decade saw a complete inauguration of all types of development project, but the focus was on water supply source development. This focus – in reality, was the core pattern that could be found in every decade of His reign. Moreover, it was also found that most of the projects were distributed in remote regions, far from the capital city. The overall findings in terms of timeline of the royal development projects throughout seven decades of His reign indicated that His Majesty aimed his efforts at alleviating poverty and hardship in remote areas where the poorest poor reside and at the water source development that benefits particularly those in agricultural sector. This was likely the same as a couple of Ayoo’s suggestions on poverty reduction strategies in developing countries. To alleviate poverty, the author [20] recommended stimulating inclusive economic growth, economic and institutional reforms, promoting microfinance institutions and programs, improving the marketing systems, and cash and income transfer programs.
4.2. Spatial Distribution Pattern of the Royal Development Project
Analysis based on the regional perspective indicated that pattern of most of the royal development projects focused on the development of ‘resources and the environment’ particularly water supply source development which accounted for more than 80% of all the projects. The largest concentration of these projects was found in the North-the only region where the number of projects per capita was classified as “high”. The findings noted his focus on water source development which aligns with the concepts explored in the study on water allocation management during scarcity [21]. Setting aside the search for feasible study of applying a bankruptcy approach to water allocation management under scarcity, the authors also pointed out the prominent of the scarcity of water resource that decision makers should focus. This is because it dealt closely with the most vulnerable households, especially those in remote areas.
Regarding the spatial pattern of the North as a development target, it was found that this region had the lowest average income per capita, low population density, and low population growth rate in comparison to other regions. At the same time, its level of urbanization was “moderate” (lower than the Central and the East that were at “high level”, but higher than the Northeast, the South, and the West which were at the “low level”). Thus, it could be argued that King Rama IX placed the first priority on the neediest area – where the majority of the most vulnerable group resided.
However, projects concerning rural livelihood and agricultural society such as those for water supply source, agriculture, the environment, occupational development, and other aspects had a random spatial pattern. That is to say that although the projects were distributed in every region but in each region the royal development projects would be concentrating only in selected provinces where poverty and hardship in life were their common problem issues.
From the provincial perspective, the royal development projects could be found primarily in provinces with very low level of urbanization but contained the highest number of projects per capita in each region. As seen in the provinces with the highest number of projects per capital of each region, all had the lowest level of development in almost all aspects (income level, average annual population growth rate, population density, or level of urbanization).
In the end, it can be concluded that targeting the royal development projects on water supply sources and putting focus on remote areas highlighted the uniqueness of what was known as the King’s Philosophy. In reference [22], the authors observed that the unique philosophy was a practice that took into account the geographical, economical, and social contexts of each area inclusively. Problem solving strategies were designed not only in a holistic way but also with the focus on building the sense of belonging of local people in order to achieve three ultimate goals: survival, self-reliance, and sustainability.
5. Conclusions
The research findings on the timeline of the royal development projects and the above-mentioned spatial distribution patterns clearly indicated that almost half of the royal projects initiated in the fourth decade of His reign (1977-1986) when Thailand was in the process of the infrastructure installation that was the foundation of national development to become a newly industrialized country. Regardless of the year, King Rama IX placed the highest emphasis on alleviating poverty and raising marginal people’s livelihood through the development of water supply sources.
In relation to the spatial distribution patterns, it was found that most of the royal development projects focused on the development of ‘resources and the environment’ particularly water supply source development which accounted for more than 80% of all the projects. The largest concentration of these projects was found in Northern Thailand where not only the number of projects per capita was classified as “high” but also where the most vulnerable inhabitants lived. Apart from the problems of poverty, destituteness, and disparity in the chance for development; it should be pointed out that hardship in everyday life and inadequate infrastructure system all acted as the pull factor for the initiation of the royal development project as well.
6. Recommendations
The above-mentioned findings clearly echo the royal grace of King Rama IX whose primary intention was to raise life quality of the impoverished. His effort as well as those of the Royal Family resulted in almost 5,000 royal development projects 2,738 of which were initiated within the seven decades of His reign, averaging 40 projects annually that are unparalleled amongst monarchies the world over. His royal grace be-stowed upon the nation should be appreciated and commemorated. Relevant agencies should expedite dissemination of correct information both academically and in-depth in response to false accusation and fake news appearing in Thai society lately that had reached parts of society especially among the youths.
Furthermore, the findings clearly pointed out that most of the royal development projects were found in provinces with low to slightly low level of economic, demographic, and urbanization conditions. Such projects have benefitted communities in remote areas with poor accessibility. Field surveys conducted in various provinces still found the royal development projects in remote areas that had there been without them they would have been in a much worse condition than at present. The social gap and economic disparity between urban areas and remote rural areas would have been far greater than what it is today. Nonetheless, many royal development project areas visited on field surveys in 2022 were found to be dilapidated and poorly maintained. Therefore, relevant agencies should expedite the rejuvenation of these project areas so that they will continue to effectively raise the quality of life of the underprivileged and impoverished.
Conflict of Interest
The authors declare no conflict of interest.
Acknowledgment
The researchers wish to thank the Faculty of Social Sciences for the funding and the Department of Geography for the research equipment. Special appreciation is given to the Office of the Royal Development Projects Board for providing the information concerning the royal development projects that were the basis for analyzing the project spatial distribution pattern. The researchers are also indebted to the Department of Provincial Administration, the Ministry of Interior as well as the Office of the National Economic and Social Development Council for invaluable data on population and gross provincial product.
- P. Limlahapun, P. Jongkroy, “Development web spatial database system of the Royal Projects under the Inspiration of King Rama 9th,” Association for Computing Machinery, In Proceedings of the 8th International Conference on Frontiers of Educational Technologies (ICFET ’22), New York, NY, USA, 201–209, 2022. DOI: 10.1145/3545862.3545894.
- P. Limlahapun, H. Fukui, W. Yan, T. Ichinose, “Integration of flood forecasting model with the web-based system for improving flood monitoring, and the alert system,” in International Conference on Control, Automation and Systems, 767-772. 2011.
- Office of the Royal Development Projects board (in Thai), http://www.rdpb.go.th.
- K. A. Kupzyk, M. Z. Cohe, “Data validation and other strategies for data entry,” Western Journal of Nursing Research, 37 (4), 546-556, 2014. DOI: 10.1177/0193945914532550
- C. Owusu, Y. Lan, M. Zheng, W. Tang, E. Delmelle, “Geocoding fundamentals and associated challenges,” in Geospatial Data Science Techniques and Applications, 2017. doi: 10.1201/9781315228396-3.
- Anaconda, https://www.anaconda.com/products/individual.
- PostGIS, https://postgis.net/.
- PostgreSQL, https://www.postgresql.org/.
- PgAdmin, https://pgadmin.org/.
- Geoserver, https://geoserver.org/.
- W. Norton, M. Mercier, Human geography, Tenth edition, Oxford University Press, Don Mills, Ontario, 2019.
- J.D. Fellmann, M. Bjelland, A. Getis, J. Getis, Human Geography: Landscapes of Human Activities, Eleventh edtion, McGraw-Hill, 2010.
- J.M. Rubenstein, Contemporary Human Geography, Pearson Education, Inc., 2016.
- H. M. Habeeb and N. Al-A’araji, “Extracting implicit geolocation based on google maps geocoding API of social media networks,” Research Journal of Applied Sciences, 11(10), 2016. doi: 10.3923/rjasci.2016.1083.1088.
- World Bank, World Bank countries classifications by income level, https://blogs.worldbank.org/opendata/new-world-bank-country-classifications-income-level-2021-2022, 2021.
- United Nations, World Urban prospects 2018, Population Division, https://population.un.org/wup/Maps/World Urbanization Prospects, 2018.
- Center for International Earth Science Information Network, Mapping urban and rural population, In FAO, 2021. https://www.fao.org/3/a0310e/A0310E06.htm.
- J.M. Rubenstein, Contemporary Human Geography, Pearson Education, Inc., 2016.
- Royal Majesty Project, Web-based development, 2023. http://geosocial-soc.ku.ac.th:81/king_projects/en/index.html.
- C. Ayoo, “Poverty reduction strategies in developing countries”, Rural Development – Education, Sustainability, Multifunctionality, Intech, 2022. http://dx.doi.org/10.5772/intechopen.101472.
- Y. Zheng, X. Sang, Z. Liu, S. Zhang, P. Liu, “Water allocation management under scarcity: a bankruptcy approach,” Water Resources Management, 36, 2891–2912, 2022. Doi: 10.1007/s11269-022-03098-0
- P. Disayathat, S. Chitsuchon, S. Chandrarat, D. Latthapipat, P. Siriprapanukul, A. Muthitacharoen, P. Luengaram, P. Luengnarumitchai, S. Manprasert, “King Rama IX and Economics” (in Thai)”, 2016. https://www.pier.or.th/abridged/2016/23/.