Minimum Static VAR Compensation Capacity for Bad Voltage Drop Buses in Power Systems

Adv. Sci. Technol. Eng. Syst. J. 8(3), 212–217 (2023);
 DOI: 10.25046/aj080324
The quality of the electric power system must be maintained properly, one of which is voltage. Under certain operating conditions, the bus voltage may drop below its minimum level, called bad voltage. A large reactive load can cause a voltage drop across the bus or the location of the bus is far from the generator stations, so that the line impedance has a large value. One technique to increase the voltage is through compensation technique. This paper presents the determination of the minimum statistical VAR compensation for increasing the voltage to the minimum safety limit. The methodology creates a compensating model for bad bus voltages. Electrical quantities (voltage, power and system losses) are calculated through the power flow technique. The compensating capacity is increased until the voltage rise reaches its minimum security limit. The simulation results on the IEEE 9 bus system show that the voltage increases on all buses with minimal compensation on buses 5 and 8, and can save up to 1.37 MW of power
1. Introduction
The electric power system must maintain its quality. One of its qualities is voltage, where voltage must be kept within its safety limits (minimum and maximum limits). In addition, the operation of the electric power system is highly desirable to be safe, efficient, and economical.
The existence of reactive power flow in the network will worsen the quality of service because it will cause voltage drops. An improved voltage profile by controlling the reactive power flow needs to be considered. Reactive power compensation (RPC) in power systems can increase voltage in addition to improving power factor [1]. However, determining the amount of effective compensation needs to be considered in maintaining voltage security. Maintaining voltage stability through reactive power control has been extensively discussed in [2–4]. This work succeeded in controlling the voltage at the desired level to improve the quality of the voltage to the customer. In electric power, the voltage must not drop below its minimum level. Voltage correction through compensation must consider the voltage limit. The effect of compensation can effects voltage fluctuations and it is an option to support reactive power flow into the network [5–7]. The reactive power flow in the network can be shown to decrease when it is compensated. However, the eff ect of reactive power flow on the voltage drop has not been clearly formulated.
Intelligent algorithm to control voltage has been studied in [8–10]. The [8] has developed an intelligent algorithm to control voltage. Meanwhile, controlling the flow of reactive power through the application of intelligent algorithms has been implemented in [9]-[10]. These works have successfully applied artificial methods to control the voltage on the demand side.
Whereas in [11–16], compensation techniques are used to control the voltage in the distribution system. The voltage control strategy to maintain the continuity of the distribution network [11] and for optimizing the voltage coordination [12]-[13]. Generally, the centralized voltage control is a good option. Multi-agent techniques can be used for centralized voltage control in power systems as discussed in [14]. The coordinated voltage control for fast location determination is a problem and the solution has been developed in the scheme in [15]. Meanwhile, the voltage control globally in a coordinated online system has been proposed in [16]. One of the problems in the operation of electric power is how to keep the voltage from going out of bounds. If there is a voltage below the minimum level, it must be increased to the minimum level.
Compensation technique can repair voltage drop in the medium voltage feeder [17,18] The voltage drop monitor of the load side can been implemented by using compensation [17]. The simple voltage drop calculation is presented in [18]. The methodology uses the feed current approach. While in [19–22] has studied the optimal compensation to voltage control. The [19-20] presents the formulation to control the optimal reactive power. Repair power factor and optimal saving losses depend on the location of capacitor bank in the line feeder [21]. Power system large losses can be repaired by compensation. Optimal compensation to get minimum system losses has been clearly formulated in [22]. Considering that the cost of compensation in high-voltage networks is quite expensive, it is necessary to pay attention to the minimum compensation option so that voltage security can be maintained.
This paper proposes a method to improve voltage quality through minimum compensation in power systems using SVC devices on buses that have bad voltage. The methodology is based on compensation modeling on the observed bus, where the power supply comes from the network, generator and SVC to meet the load.. The compensating capacity is updated until the voltage level has reached the minimum security limit. Each process changes in compensation capacity, the voltage value is calculated using the Newton-Rapson technique. This technique has proven to be robust in power flow calculations in power systems.
This SVC device will act as a reactive power generator that supplies the network. The reactive power flow before the SVC device is installed will be compensated by the reactive power generated by the SVC device. In addition to increasing the voltage, this compensation technique also reduces system losses. In theory, the loss vs compensation curve is as a saddle horse. System losses will decrease towards optimal compensation, but system losses will increase if compensation is greater than optimal compensation. While the voltage tends to rise when compensation increases. The proposed method formulation has been tested with an IEEE 9-bus power system. The test results can increase the voltage to the minimum security limit (0.9 pu) on bad voltage buses (buses 5 and 8) and save system losses of 1.37 MW.
The systematics of this paper consists of 5 parts. The first session explained the state of the art regarding voltage repair through compensation techniques. The third paragraph from the end of this section explains the contribution of the work done.. The second paragraph at the end of this section describes the contribution of the work performed. The second session is to define the problem formulation. This section consists of Newton-Rapson technique, modeling of SCV and effect SCV to system losses. The third part contains procedures for solving problems in the form of a flowchart. The fourth session discussed the simulation results of the IEEE 9-bus power system. The last, fifth session, is to provide conclusions based on the findings in this work.
2. Problem Formulation
2.1. Newton-Raphson Technique
Refer to [22], the power flow problem is to solve the work network equation in (1).
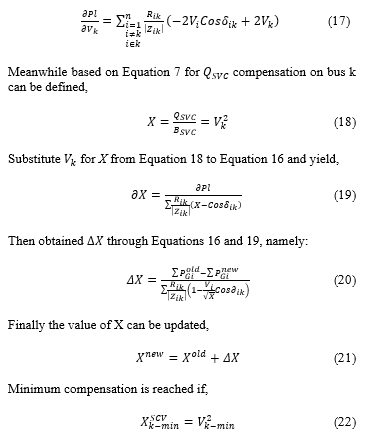
![]()
where and are the active and reactive powers. δ and V are the complex voltage. are Jacobean matrices. By using the Newton-Raphson technique, the solution to the network equation through an iteration process will converge when the power balance is reached. The power balance is expressed in (2) and (3).
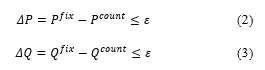
where ε is the smallest number, it represents the degree of accuracy.
2.2. Modeling of SVC
The SVC model is shown in Figure 1. Assumed that the active and reactive power flows from the grid are and , respectively. From the figure, the convergent power flow will satisfy (4) and (5).
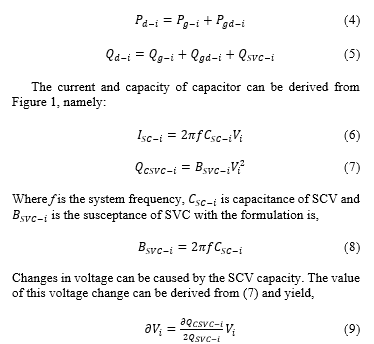
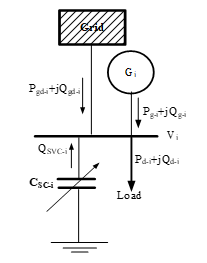
Figure 1: SCV model
While the susceptance change is,
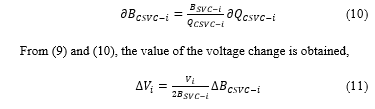
When the bus voltage drops below the minimum security limit, it must be increased at least to the lower limit to maintain the quality of the power flow. In this paper, the voltage increase is limited to the lower limit so that a minimum SCV capacity is required.
![]()
In this proposed method, the value of already meets the minimum-security limit voltage ( ), where previously ( ) is below the minimum-security limit voltage.
From (9) and (12) it can be derived the change in the minimum SCV capacity to increase the voltage to the minimum-security limit, namely:
![]()
2.3. Effect SVC to Losses
Calculation of the effect SVC to losses refer to [22]. The line representation is shown in Figure 2. SCV generates reactive power in the network so that it will have an impact on line losses.
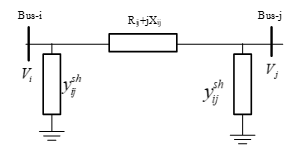
Figure 2: Phi equivalent circuit of line i-j
From Figure 2, line losses can be derived and yield,
where is the power generated by generator i, and is the total load. The effect of the voltage on the bus k on the minimum system losses is shown in Figure 3. Increasing the voltage in (15) will reduce losses.
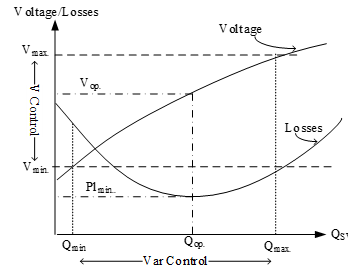
Figure 3: Bus voltage control
From Figure 3 it can be seen that the addition of SCV capacity will increase the voltage. Raising the voltage to the minimum safety limit ( ) requires the SCV capacity of . The effect of the voltage on the bus k on the system losses can be derived from Equation 15 and yield,
where is the minimum compensation. is the lower voltage limit at bus k.
3. Flowchart of Proposed Method
The procedures for completing this work will follow the step by step diagram in Figure 4. Base case is determined by the results of calculating the power flow without SVC. Initial conditions are obtained from the base case. The voltage value is calculated from the updated compensation (X). This process is repeated until the voltage has reached the value of the minimum limit security ( ). Repeat for bad voltage drop on other buses. Finally, the calculation results are obtained: the minimum SCV capacity.
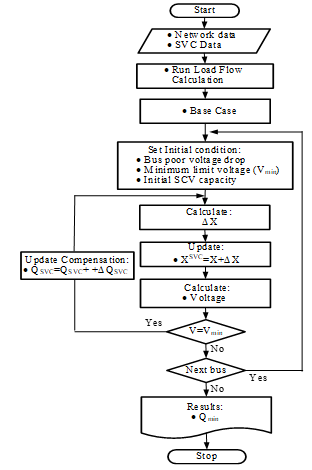
Figure 4: Flowchart of the proposed method
4. Simulation, Results and Discussion
The simulation is carried out through application software based on the flowchart in Figure 4 using the FORTRAN language. The software application is run using an Asus Core i3 laptop.
4.1. Simulation
The proposed method has been tested through simulations on electric power systems in order to validate it. This simulation uses an IEEE 9-bus system with a one-line diagram in Figure 5. The data for this system are presented in Tables 1 and 2. In particular, Table 1 is the result of load flow based on the IEEE standard and is used as a basis for calculations. While Table 2 shows the line characteristics. From the base case the voltage at buses 5 and 8 is below the minimum-security limit (0.90 pu). For this reason, minimum compensation is needed on these two buses to increase the voltage to the minimum-security limit.
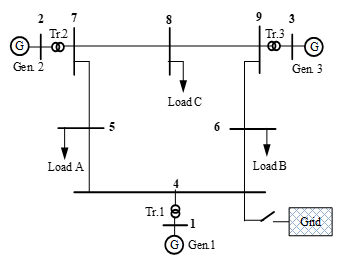
Figure 5: IEEE 9-bus power system
Table 1: Base case
| No bus | V
[pu] |
Pg
[MW] |
Qg
[MVAR] |
Pd
[MW] |
Qd
[MVAR] |
| 1 | 0.950 | 0 | 0 | 0 | 0 |
| 2 | 1.025 | 163.00 | 130.75 | 0 | 0 |
| 3 | 1.025 | 85.00 | 192.92 | 0 | 0 |
| 4 | 0.953 | 0 | 0 | 0 | 0 |
| 5 | 0.872 | 0 | 0 | 200.0 | 100.0 |
| 6 | 0.909 | 0 | 0 | 90.0 | 30.0 |
| 7 | 1.040 | 391.84 | 203.21 | 0 | 0 |
| 8 | 0.884 | 0 | 0 | 150.0 | 95.00 |
| 9 | 0.916 | 0 | 0 | 180.0 | 130.0 |
| Total | 639.84 | 526.88 | 620.0 | 335.0 | |
Table 2: Line characteristic
| From bus | To | R(pu) | X(pu) | 1/2Y(pu) |
| 1 | 2 | 0 | 0.0625 | 1.000 |
| 2 | 8 | 0 | 0.0625 | 1.000 |
| 3 | 6 | 0 | 0.0586 | 1.000 |
| 4 | 5 | 0.0085 | 0.0720 | 0.0745 |
| 4 | 9 | 0.0320 | 0.6110 | 0.1530 |
| 5 | 6 | 0.0170 | 0.0920 | 0.0790 |
| 6 | 7 | 0.0170 | 0.0920 | 0.0790 |
| 7 | 8 | 0.0170 | 0.0920 | 0.0790 |
| 8 | 9 | 0.0320 | 0.6110 | 0.1530 |
4.2. Results
The comparison of the results of the base case simulation without the SCV device is shown in Table 1. This table indicates the need for compensation for buses 5, and 8 because low voltage. From the results of the simulations carried out to increase the voltage on buses 5 and 8, the minimum compensation values are obtained as shown in Table 3.
Table 3: Minimum compensation
| # | Before Compensation | After Compensation | ||||
| V
(pu) |
BSCV
(pu) |
Q
(MVar) |
V
(pu) |
BSCV
(pu) |
Q
(MVar) |
|
| Bus 5 | 0.872 | 0 | 0 | 0.9 | 0.1978 | 21.0 |
| Bus 8 | 0.884 | 0 | 0 | 0.9 | 0.0942 | 10.0 |
| 0.771958 | 0.803636 | |||||
| Losses | 19.84 MW | 18.47 MW | ||||
Note: is the system power factor.
The load flow simulation results after compensation are presented in Table 4. The gain from this compensation is that the system loss drops by 1.37 MW.
Table 4: Power flow after compensation
| No bus | V
[pu] |
Pg
[MW] |
Qg
[MVAR] |
Pd
[MW] |
Qd
[MVAR] |
| 1 | 0.961 | 0 | 0 | 0 | 0 |
| 2 | 1.025 | 163.00 | 112.77 | 0 | 0 |
| 3 | 1.025 | 85.00 | 179.83 | 0 | 0 |
| 4 | 0.965 | 0 | 0 | 0 | 0 |
| 5 | 0.900 | 0 | 0 | 200.0 | 79.0 |
| 6 | 0.921 | 0 | 0 | 90.0 | 30.0 |
| 7 | 1.040 | 390.47 | 180.21 | 0 | 0 |
| 8 | 0.900 | 0 | 0 | 150.0 | 85.00 |
| 9 | 0.923 | 0 | 0 | 180.0 | 130.0 |
| Total | 638.47 | 472.81 | 620.0 | 324.0 | |
4.3. Discussion
The proposed method has successfully simulated the IEEE 9 bus system, which is presented in Tables 3 and 4. Table 3 presents the results of the minimum compensation on buses 5 and 8. The previous voltages (based on the base case) were below the minimum safety limits of 0.872 and 0.884 pu, all marked in bold. In the simulation using voltage security 0.9-1.1 pu, so the voltage on the bus becomes bad. To increase the voltage on buses 5 and 8 installed SCV. The SCV capacities required to increase the voltage to the minimum safety level (0.9 pu) are 0.1978 pu and 0.0942 pu, respectively.
The effect of Compensation (see Table 3) is to increase the voltage, not only at the bus being compensated but also at other buses. For example Bus-1 has a voltage of 0.95 pu (see Table 1) before compensation increasing to 0.961 (see Table 4) after compensation. In addition, shown by Table 3, the system power factor increased from 0.803636 to 0.771958 and losses decreased from 4MW to 3 MW or losses were saved by 6.9%.
This increase in voltage needs to be watched out for when it exceeds its maximum limit. If there is an overvoltage due to compensation, the compensation capacity is stopped until one/several bus voltages reach their maximum limit. Furthermore, the load shedding operation needs to be considered to increase the voltage on buses that have the bad voltage.
Besides that, compensation has advantages because it reduces losses. The load flow simulation after compensation in Table 4 states that total power production degrease from 639.84 MW to 638.47 MW or saving 1.37 MW. When these savings are converted to costs, the value is quite large.
Comparison with other results from [23] is shown in Table 5, where compensation on bus 8. The amount of compensation based on the reference is 27.46 MVar to increase the voltage at bus 5 by 0.993 pu compared to the proposed method requiring compensation of 10.00 MVar and the voltage at bus 5 increases to 0.921 pu.
Table 5: comparison results with another method
| Item | Base
Case |
Reference Method | Proposed Method |
| SVC at Bus 8 | SVC at Bus 8 | ||
| Losses
(MW) |
5.300 | 4.773 | 4.5389 |
| QSCV
(MVar) |
0 | 27.46 | 10.00 |
| Bus | V(pu) | V(pu) | 0.961 |
| 1 | 0.950 | 1.040 | 1.025 |
| 2 | 1.025 | 1.025 | 1.025 |
| 3 | 1.025 | 1.025 | 0.965 |
| 4 | 0.953 | 1.024 | 0.900 |
| 5 | 0.872 | 0.993 | 0.921 |
| 6 | 0.909 | 1.010 | 1.040 |
| 7 | 1.040 | 1.023 | 0.900 |
| 8 | 0.884 | 1.000 | 0.923 |
| 9 | 0.916 | 1.027 | 0.961 |
This proposed method should be supported by fast and robust power flow calculations. There are three power flow methods that should be considered, namely the Gauss-Seidel, Newton and Fast Decouple methods, The Gauss-Seidel method uses an elimination technique that involves all parameters and variables so that the calculations at each iteration step will process large power system data. In addition, it takes many iteration steps to reach convergence. However, this method will be effective for small power system sizes. Newton’s method is called the complete power flow method because it uses a complete Jacobean matrix. This causes a large memory usage. The fact that the changes in the calculation results to reach the solution point are quite small so that many iteration steps are needed. Whereas the Fast Decoupled method works by ignoring the out diagonal sub matrix of the Jacobean matrix and the element values of the Jacobean matrix are constants through the approach =1 and for . Through the Fast Decoupled method approach, it can work very quickly with a few iteration steps. The condition needed by this method is that each line must meet r/x<1, where line impedance is z = r + jx.
The IEEE 9 bus system simulation results for the three methods are shown in Table 6. The Fast Decoupled method can work very fast, so it is very advantageous to apply it to real time calculations. However, this method does not work well for the line impedance conditions r/x>1. If the Fast decoupled method cannot work, it is necessary to consider the full method option (Newton method).
Table 6: Comparison of three load flow methods
| Item | Gauss-Seidel | Newton | Fast Decoupled |
| Process | Iteration | Iteration | Iteration |
| Technique | Elimination | Full Jacobean | Ignore out diagonal of sub-Jacobean.
Approximate sin and cost values for small angles. |
| Accuracy | 0.00000001 | 0.00000001 | 0.00000001 |
| Iteration step | 28 | 25 | 9.5 |
| Running time | 3.715s | 3.125s | 0.5s |
5. Conclusion
The method of calculating the minimum compensation in the electric power system has been presented in this paper. Formulation validation has been tested through simulation of electric power systems in section 4 of this paper.
This work uses the IEEE 9-bus power system, based on the base case there are bad voltages on buses 5 and 8. SCV capacities of 0.19 and 0.9 pu are required to increase the voltage to the minimum safety level (0.9 pu) on bus 5 and 8 respectively. The effect of compensation is to increase the voltage across all buses. It should be noted that the voltage increase at the bus does not exceed the maximum-security limit. The addition of compensating capacity must be stopped if the bus voltage reaches its maximum safety limit.
The advantage of compensation is the reduction of system losses. This is caused by a decrease in reactive flow in the network so that the current is reduced. From the simulation results obtained a power saving of 1.37 MW to increase the voltage to the minimum limit level (0.9), where the voltage on bus 5 and 8 is 0.872 pu and 0.884 pu.
- T. Gonen, Electrical Power Distribution System Engineering, McGraw-Hill, 1986.
- X. YE, J. LE, Y. LIU, W. ZHOU, K. LIU, “A coordinated consistency voltage stability control method of active distribution grid,” Journal of Modern Power Systems and Clean Energy, 6(1), 85–94, 2018, doi:10.1007/s40565-017-0294-z.
- J. Dixon, L. Moran, J. Rodriguez, R. Domke, “Reactive Power Compensation Technologies: State-of-the-Art Review,” Proceedings of the IEEE, 93(12), 2144–2164, 2005, doi:10.1109/JPROC.2005.859937.
- P. Kundur, Power System Stability and Control, McGraw-Hill, New York, 1994.
- D. Quoc Hung, Y. Mishra, “Voltage fluctuation mitigation: fast allocation and daily local control of DSTATCOMs to increase solar energy harvest,” IET Renewable Power Generation, 13(14), 2558–2568, 2019, doi:10.1049/iet-rpg.2019.0223.
- M. Alrashidi, “Community Battery Storage Systems Planning for Voltage Regulation in Low Voltage Distribution Systems,” Applied Sciences, 12(18), 9083, 2022, doi:10.3390/app12189083.
- M. Aybar-Mejía, J. Villanueva, D. Mariano-Hernández, F. Santos, A. Molina-García, “A Review of Low-Voltage Renewable Microgrids: Generation Forecasting and Demand-Side Management Strategies,” Electronics, 10(17), 2093, 2021, doi:10.3390/electronics10172093.
- R. Anilkumar, G. Devriese, A.K. Srivastava, “Voltage and Reactive Power Control to Maximize the Energy Savings in Power Distribution System With Wind Energy,” IEEE Transactions on Industry Applications, 54(1), 656–664, 2018, doi:10.1109/TIA.2017.2740850.
- K.-D. Kim, W.-K. Yu, E.-J. Lee, I.-S. Wang, H.-J. Kang, J.-H. Shin, H.-J. Lee, “Development of an Intelligent Voltage Control System for Jeju Island in Korea,” Journal of International Council on Electrical Engineering, 1(2), 156–162, 2011, doi:10.5370/JICEE.2011.1.2.156.
- H. Van Pham, S.N. Ahmed, Multi-Agent based Approach for Intelligent Control of Reactive Power Injection in Transmission Systems, John Wiley & Sons, Ltd, Chichester, UK: 269–282, 2018, doi:10.1002/9781119214984.ch13.
- Y. Zhang, A. Srivastava, “Voltage Control Strategy for Energy Storage System in Sustainable Distribution System Operation,” Energies, 14(4), 832, 2021, doi:10.3390/en14040832.
- A.K. Ali, M.M. Mahmoud, “Coordinated Distributed Voltage Control Methods for Standalone Microgrids,” International Journal of Robotics and Control Systems, 2(2), 262–276, 2022, doi:10.31763/ijrcs.v2i2.612.
- M. Hojati Tabatabaei, H. Siahkali, J. Olamaei, “A quick solution to optimal coordinated voltage-control, based on dimension-reduction of power system via Modified Ward-PV,” Scientia Iranica, 0(0), 0–0, 2021, doi:10.24200/sci.2021.56970.4999.
- H. Shahbazi, F. Karbalaei, “Decentralized Voltage Control of PowerSystems Using Multi-agent Systems,” Journal of Modern Power Systems and Clean Energy, 8(2), 249–259, 2020, doi:10.35833/MPCE.2018.000628.
- J.Y. Wen, Q.H. Wu, D.R. Turner, S.J. Cheng, J. Fitch, “Optimal Coordinated Voltage Control for Power System Voltage Stability,” IEEE Transactions on Power Systems, 19(2), 1115–1122, 2004, doi:10.1109/TPWRS.2004.825897.
- K. Alzaareer, M. Saad, H. Mehrjerdi, D. Asber, S. Lefebvre, “Development of New Identification Method for Global Group of Controls for Online Coordinated Voltage Control in Active Distribution Networks,” IEEE Transactions on Smart Grid, 11(5), 3921–3931, 2020, doi:10.1109/TSG.2020.2981145.
- C.K. Wachjoe, H. Zein, “A Method for Voltage Drop Monitoring on Load Sides in Medium Voltage Feeder,” in 2020 7th International Conference on Control, Decision and Information Technologies (CoDIT), IEEE: 1215–1220, 2020, doi:10.1109/CoDIT49905.2020.9263852.
- R. Thakur, P. Chawla, Voltage Drop Calculations & Design of Urban Distribution Feeders.
- X.Y. Xu, P. Zhou, Q.Z. Huang, C.M. Deng, M.M. Shi, G. Xue, “Optimization of Voltage and Reactive Power in Regional Power Network Based on MCR,” Advanced Materials Research, 986–987, 394–399, 2014, doi:10.4028/www.scientific.net/AMR.986-987.394.
- S.-I. Go, S.-Y. Yun, S.-J. Ahn, J.-H. Choi, “Voltage and Reactive Power Optimization Using a Simplified Linear Equations at Distribution Networks with DG,” Energies, 13(13), 3334, 2020, doi:10.3390/en13133334.
- H. Zein, E. Dermawan, “Optimal Location of a Capacitor Bank in a Primary Feeder to Load up Linearly,” IPTEK Journal of Proceedings Series, 0(1), 2014, doi:10.12962/j23546026.y2014i1.370.
- H. Zein, S. Saodah, S. Utami, C.K. Wachjoe, “Static VAR Compensation Capacity for Bus Voltage Setting in Electric Power Systems,” in 2022 International Conference on Technology and Policy in Energy and Electric Power (ICT-PEP), IEEE: 1–6, 2022, doi:10.1109/ICT-PEP57242.2022.9988871.
- J.V. and S.A.S. Parate, “Reactive Power Control and Transmission Reduction with Realization of SVC and TCSC,” International Journal of Engineering Science and Technology (IJEST), 4(7), 3592–3600, 2012.