Three-phase Continuously Variable Series Reactor – Realistic Modeling and Analysis

Adv. Sci. Technol. Eng. Syst. J. 8(3), 202–211 (2023);
 DOI: 10.25046/aj080323
Continuously Variable Series Reactor (CVSR) is a device that can vary the reactance in an ac circuit by controlling the magnetization of a ferromagnetic core, shared by ac and dc windings. The bias dc current can change the equivalent ac reactance(inductance) in order to, for example, control load flow, damp oscillations, or fault current limitation. Gyrator-Capacitor (G-C) approach in modeling electromagnetic devices provides a strong and practical way in simulating an integrated system composed of magnetic and electric/electronic circuits. The G-C model provides key advantages in analysis of electromagnetic devices, including CVSR. Understanding the performance and the operational characteristics of the CVSR is essential for its proper utilization in the power grid. This paper presents a detailed G-C approach that includes the ferromagnetic core nonlinearities, namely, hysteresis and saturation. The approach has been applied in modeling the electromagnetic coupling between the ac and dc circuits of a three-phase CVSR. Analysis of the effect of different control dc circuit types on the equivalent ac inductance is presented, during operating conditions at different ferromagnetic states. In addition, induced voltages across the windings and the power exchange with the control circuit are presented.
1. Introduction
This article augments the underlying work introduced in the 2022 IEEE Kansas Power and Energy Conference (KPEC) [1]. The major contributions and improvements to that work included here are the following:
1) Comprehensive analysis of the performance of the CVSR in terms of the induced voltages across the dc winding, to assess the counter impact of the power system on the control circuit.
2) Modeling of hysteresis in order to capture the effect of the phenomenon on the induced voltages in the windings and make the model as realistic as possible.
3) Power exchange between the controlled and control circuits.
Contemporary power grids operate under increased stress and strain due to the growing demand for electric energy, along with the growing penetration of variable renewable sources. The primary concern system operators have in running the power system and satisfying the demand is to deals with the contingencies in generation and transmission, system oscillations and other events that may result in instabilities and result with blackouts [ 2]. This is mainly due to the absence of a comprehensive load flow control. Traditionally, load flow control has been implemented using phase-shifting transformers, shunt capacitors and reactors, generator controls, switching system elements on and off and, in the past few decades, various types of power electronics-based controllers [3]. However, these devices either provide only limited control or they come at very high cost. In addition, the meshed topologies of the power systems, make it quite complicated for some of these control means to be effectively employed. More recently, continuously variable series reactor (CVSR) technology was proposed as an alternative option [3-5].
CVSR is a series-connected reactor in the ac power circuit that can continuously vary its reactance within the design boundaries. It is characterized with high reliability and low maintenance, installation, and operating costs [4,6]. Continuous control is achieved by varying a bias control current. Whereas in FACTS controllers, power flows through the high-rated power electronic components, the CVSR control circuit is isolated from the power system and can use low-rated power electronic converters.
Line decongestion and overload relief are easily accomplished by the CVSR through inserting additional impedance in the power circuit in series with its ac winding. Furthermore, CVSR can also be used in dynamic applications such as oscillations damping and fault currents limiting by varying the impedance accordingly. Due to the versatility of applications, it is essential to study the mutual impact of the CVSR and the power grid under different operating conditions [4,5].
Gyrator-Capacitor (G-C) modeling approach is a suitable and effective method for modeling magnetic circuits in detailed analyses of power magnetic devices. It directly links electrical and magnetic circuits for comprehensive studies of complex hybrid devices which are part of the power system. In this approach, the analogy between the magnetomotive force (MMF) and the electromotive force is preserved, however the electrical current is analogous to the rate of change of the flux. As a result, the permeance (inverse reluctance) becomes analogous to capacitance.
In a basic representation of the CVSR, as is usual, the magnetic circuit is generally modeled with no core losses, hysteresis in particular. However, some research has been done to include this effect in the analysis [7]. the Jiles-Atherton method can have convergence problems which can be detrimental in transient studies. Furthermore, in some cases, it may result with high percentage error. In [8], alternative models have been examined, with their accuracy and ease of computation compared. The study indicates that Rayleigh model offers sufficient accuracy for cores with high coercivity. On the other hand, Potter model employs simpler mathematical expressions but may lead to significant errors in certain cases. The Frölich and Preisach models provide results that are consistent with experimental findings, although they may not be suitable for dynamic analysis due to their high computation burden. It should be stated that another characteristic of these methods is parameter sensitivity which may also lead to significant errors.
The G-C model represents hysteresis by adding a resistor. The value of this resistor depends on the core geometry, and specific losses [9].
In most studies of electromagnetic devices with controlled bias flux, for simplicity, the source in the control circuit of the device is considered as an ideal current source. This, of course, is not realistic. Three other bias control sources are considered here that have quite different internal impedances. One is an ideal voltage source with zero internal impedance, as opposed to the infinite impedance of the ideal current source. The other two are typical power electronics-based sources: H-bridge converter and buck converter. Their internal impedance values are realistic, in between the two extremes of the ideal sources.
Accurate modeling and simulation of power system elements is fundamental to enhance our understanding of the behavior of the components and their interaction with the power system. This is true in general, but it is also essential in the analysis of the CVSR – a device in which the power circuit is magnetically coupled with a control circuit of much lower ratings. The usual approximations that are justified at the power system level can lead to significant errors and oversights of detrimental conditions on the sensitive controls. Hence, to investigate the impact that the power system has on the CVSR itself, it is important to take all the details into account. The goal of this paper is to provide comparison between idealistic and realistic models of the CVSR and highlight the differences in its performance as a result of the improved accuracy.
The rest of the paper is structured as follows: the concept of three-phase CVSR is discussed in Section 2. The G-C model general concept, expanded to include nonlinearities from core saturation and hysteresis, and applied to the three-phase CVSR is introduced in Section 3. Section 4 introduces the different types of bias dc sources. Section 5 provides a case study with results from simulations with different models and presents the impact on the CVSR in terms of equivalent ac inductance, induced voltages, and the power exchange with the control bias winding. The conclusions are drawn in Section 6.
2. Three-phase CVSR
A three-phase CVSR with a five-legged magnetic core, as shown in Fig. 1, includes three-phase ac winding wound on the inner legs that is part of a three-phase ac power circuit that delivers power to the load. Typically, the three inner legs have air gaps to achieve the desired nominal reactance in unsaturated conditions, and to prevent core saturation even at small ac currents. In this particular case, five dc coils are wound on each leg, connected in series and fed by a dc source. The outer legs are gapless in order to provide unimpeded return path for the bias flux. To balance the bias MMFs, the number of turns in the outer dc windings is 1.5 times the number of turns on the inner ones [1]. The controlled bias dc current creates a flux passing through the entire core, hence controlling the ac inductance of the three-phase CVSR. The induced voltages on the coils are proportional to and the voltage across the whole dc winding is their algebraic sum: .
The core can be heterogeneous whose specifications are taken from [1].
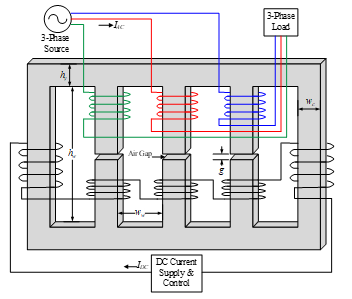
Figure 1: Three-phase CVSR [1]
3. Gyrator-Capacitor Model
3.1. General Concept
Magnetic circuits are typically represented using the electric circuit analogy [10]. The corresponding circuits are constructed using resistors. Magnetic circuits store energy and they are not suitably modeled by resistors which only dissipate energy. The G-C modeling concept illustrated in Fig. 2 maintains the power equivalence and is energy/power invariant [11,12].
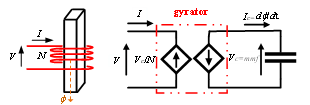
Figure 2: Magnetic circuit and its equivalent gyrator-capacitor model
These expressions lead to representation of magnetic permeances, reciprocal values of magnetic reluctances, (magnetic conductances) with capacitances. Nonlinear magnetic paths with nonlinear permeances are represented with nonlinear capacitors. Each coil is represented by a gyrator that relates voltage and current with the number of turns N.
The reluctances can be expressed approximately with (1):
![]()
where: is the magnetic reluctance which depends in general on the magnetic flux ; = 4π× is the relative magnetic permeability of the material; A is the cross-sectional area; l is the mean length of the core path.
3.2. Hysteresis Modeling
Hysteresis is modeled on one of the most common electromagnetic devices– a two-winding transformer shown in Fig. 3. The hysteresis is modeled by adding a resistor in series with the core capacitance, which represents the magnetic circuit shared by the two windings. The modeling of hysteresis is explicit, meaning that it is reflected in the core B-H characteristic [9]. Besides modeling the ensuing hysteretic losses, more importantly, it captures the other effects of the hysteretic nonlinearity on the performance of the CVSR, as shown later in the case study.In Fig. 3, represent the primary and secondary winding impedances on the electrical side. The core saturation is modeled by a nonlinear capacitor on the magnetic side. This concept can be extended to the three-phase CVSR.
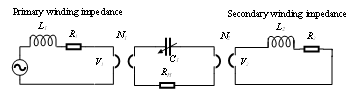
Figure 3: G-C model of a two-winding transformer with hysteretic losses
3.3. Three-phase CVSR
An improved G-C model of the physical configuration of the CVSR from Fig.1, with nonlinear core in MatLAB /Simulink® is represented in Fig. 4.
The nonlinear magnetic paths are modeled with variable capacitors, and linear permeances Cg model the air gaps in the inner legs. They can also include the fringing effect by an effective increase in the cross-sectional area. As described, the coils of the ac and dc windings are modeled with gyrators. The hysteresis in the core is modeled with corresponding resistors ( ) [10].
The capacitances that represent leakage permeances can be divided into two primary categories: leg leakage permeances ( ) and yoke leakage permeances ( ).[13]
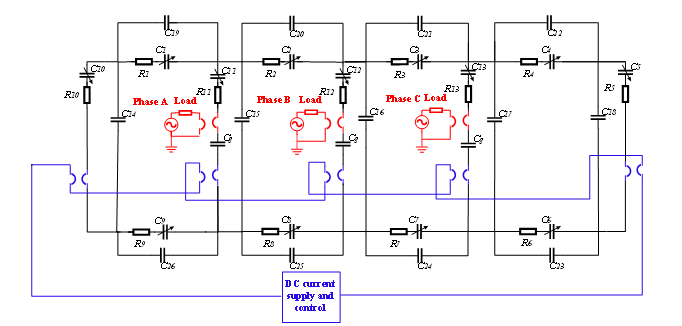
Figure 4: Gyrator-capacitor model of three-phase CVSR
The dc electric control circuit is connected to the dc source via five gyrators that represent each dc windings.
4. Bias Dc Sources
As stated before, four different methods to control the current in the dc winding are assumed. They are applied to explore how different types of the dc electric control circuits impact the operation of the three-phase CVSR in terms of equivalent ac inductance, induced voltage across dc winding, ac terminal voltage, and power interchange with the dc control circuit during different operating conditions.
All of the dc circuit controllers (DCCs) are simulated to supply the dc winding with five coils at a set of desired current values. The ideal current source has an infinite internal impedance, while the ideal voltage source has no impedance. H-bridge and buck converter are more realistic sources, with an internal impedance value between zero and infinity [1].
Fig. 5 illustrates an H-bridge converter composed of four IGBTs and a front-end rectifier. The PI controller coefficients are selected to ensure standard overshoot, settling time, and ripple in a steady state. A simple buck converter (step-down converter) is illustrated in Fig. 6. It operates in two modes: a) charging and b) discharging. During the charging mode, the IGBT turns on, and the dc winding current ramps up. During the discharging mode, the IGBT turns off, and the dc winding current ramps down [1].
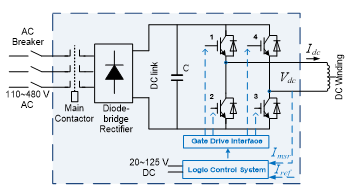
Figure 5: H-bridge converter
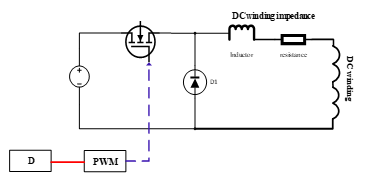
Figure. 6. Buck converter
5. Case Study
To explore the three characteristic operating states of the CVSR with unsaturated, partially saturated, and fully saturated core, simulations have been conducted for three different dc bias currents: 0 A, 15 A, and 45 A. The simulations results include waveforms for the terminal voltages and currents for each dc source type, at each characteristic bias value. Based on these waveforms, the effective impedances are computed.
Fig. 7 shows the equivalent circuit on the controlled ac power system side with source, load, and CVSR’s inductance in series.
The ac equivalent inductance is obtained from the current through the ac winding and the terminal voltage (Fig. 7). Based on the G-C model definition, the terminal voltage across the LCVSR (ac variable equivalent inductance of the CVSR) is equal to the gyrator induced voltage on the primary side. It is obtained from the basic Ohm’s Law (2):
![]()
where: is the terminal voltage, and is the load current.
For simplicity, it has been supposed that the power system is balanced. Consequently, all of the simulation results shown here are for one phase.
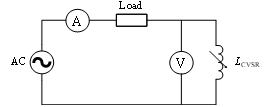
Figure 7: Ac electric circuit
5.1. CVSR without hysteresis
Fig. 8 illustrates the B-H characteristic for the inner legs of the CVSR at 0 A [14].
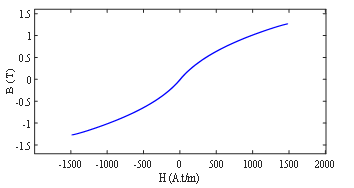
Figure 8: B-H characteristic of the inner legs without hysteresis
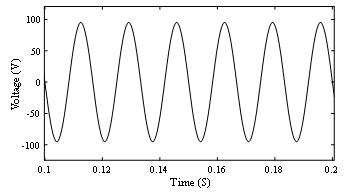
Figure 9: Terminal voltage (Idc = 0 A)
5.1.1. 0A dc bias
The terminal voltage and current through the ac winding (load current) in one phase, from the G-C model at 0 A, are shown in Figs. 9 and 10, respectively. At no bias, the voltage and current waveforms are identical for all source types. In all operational circumstances and for every control source, the current passing through the AC winding is approximately equivalent to the nominal load current value of 20.9 A. This is because, in comparison to the device’s equivalent inductance, the load impedance holds more significance. Thus, the analysis will now shift its focus solely on the terminal voltage.
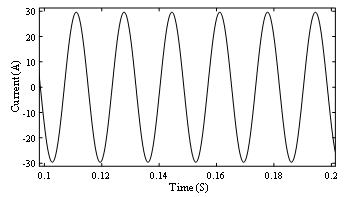
Figure 10: Load current (Idc = 0 A)
The induced voltage across the dc winding in this case is shown in Fig. 11.
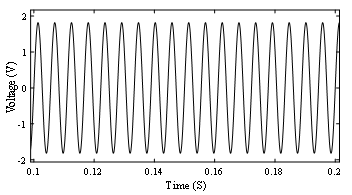
Figure 11: voltage across dc winding (Idc = 0 A)
5.1.2. 15A dc bias
Figs. 12 (a)-(d) depict the terminal voltage on one phase of the CVSR for different dc controlled circuits, when the dc bias is raised to 15 A, the inner legs go into partial saturation, while the others are unsaturated. The flat regions in the voltage waveforms are caused by the saturation. The thick parts in the last two figures are the ripple effect of the PWM frequency (2.5 kHz). The controls move back and forth through the nonlinear B-H characteristic during the transition between the unsaturated and saturated region. This effect does not occur with an ideal current source. It can be seen that the induced voltage with the H-bridge converter is smoother with smaller fluctuations than that with the buck converter due to the closed- loop control. The figures show steady-state conditions, which depend on the settling time of the DCCs, hence the different time periods.
Figs. 13 (a)-(b) show the induced voltages across the dc winding for an ideal current source and an H-bridge converter. The voltage for a buck converter is roughly identical to the latter in terms of shape. The induced voltage is distorted at times when parts of the core enter saturation and it has triple the fundamental frequency of the system. Therefore, the ripple effect on the voltage waveforms is even more exaggerated with realistic DCCs. This effect aside, they tend to have the same shape and peak values.
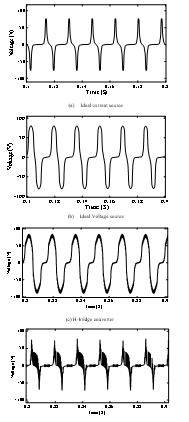
Figure 12: Terminal voltages for different dc bias sources (Idc = 15 A)
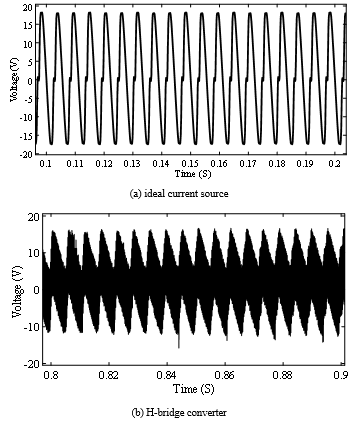
Figure 13: Induced voltage across dc winding for different dc sources (Idc = 15 A)
The power exchange with the dc winding is calculated using a “rolling window” approach. Starting at the beginning of the simulation, a window with m consecutive samples in time is chosen. The window then moves with each next sample. The power is calculated for each rolling window subset. The window size m depends on the fundamental period T and the sampling frequency of the data (step size). A longer window size produces smoother results.
The power transferred to the dc winding for an ideal current source is shown in Figure 14. After the initial transient, there is no real power exchange, apart from the small ripple. However, there is a noticeable apparent power transfer present.
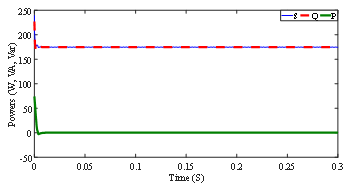
Figure 14: Power transfer to dc winding (Idc = 15 A)
5.1.3. 45A dc bias
At a high dc offset of 45 A, the CVSR core goes into complete saturation. Hence, the fluxes through the legs decrease. Also, the terminal voltage and the voltage across the dc winding are very low. Fig. 15 shows the terminal voltage on one phase for the ideal dc current source.
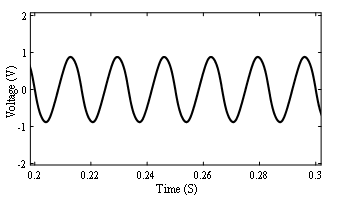
Figure 15: Terminal voltage (Idc = 45 A)
Figs. 16(a)-(c) on the next page show the voltage across the dc winding for an ideal current source, an H-bridge converter, and a buck converter, respectively.
The power transferred to the dc winding for an H-bridge converter is shown in Fig. 17. After the transient, there is no real power and a smaller than before apparent power exchange.
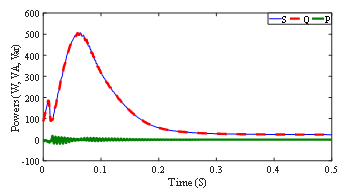
Figure 17: Power transfer to dc winding (Idc = 45 A)
5.2. CVSR with hysteresis
The B-H characteristic for the inner legs at 0A is presented in Fig. 18. The hysteresis is small, but visible. The assumed material for the core is soft ferromagnetic and has small hysteretic characteristic. This is consistent with the practice how power electromagnetic devices are built to reduce the core losses. Still, it is of interest to see how this effect will influence the performance of the CVSR.
Again, like in the case without considering hysteresis, three different dc bias currents are considered: 0A, 15A, and 45A. The same analyses as before are performed and the results are compared with the previous case.
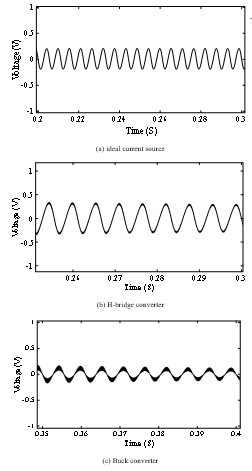
Figure 16: voltage across dc winding for different dc sources (Idc = 45 A)
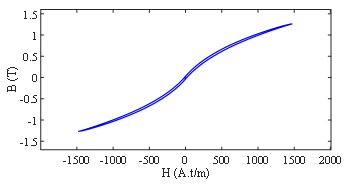
Figure 18: B-H characteristic of the inner legs with hysteresis
5.2.1. 0A dc bias
Fig. 19 shows the terminal voltage on one phase of the CVSR for an ideal current source. Because of the hysteresis, the voltage is not purely sinusoidal. The effect is not obvious and, for comparison, a pure sinusoid is plotted with a dashed red line. The same also for the voltage across the dc winding in Fig. 20.
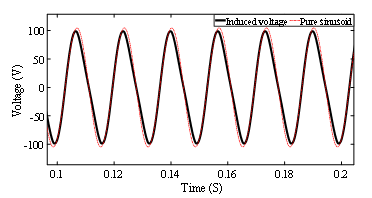
Figure 19: Terminal voltage (Idc =0 A)
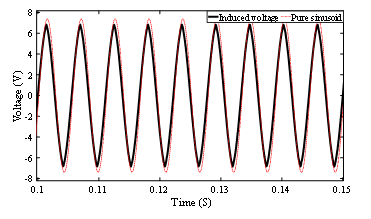
Figure 20: voltage across dc winding (Idc = 0A)
5.2.2. 15A dc bias
In Figs. 21 (a)-(b), the terminal voltage across one phase for an ideal current source and an H-bridge converter are shown, respectively, at dc bias equal to 15 A. At this bias current, the inner legs go into partial saturation, while the others are unsaturated. The hysteresis effect is encircled in red.
Figs. 22 (a)-(b) show the voltage across the dc winding for the same dc source types. Again, the effect from the hysteresis on the voltage waveform is encircled in red. It can also be seen that, although the hysteresis is quite small, the peaks of the induced voltages are significantly higher than those in the previous case for the same scenario and vary. This shows the value of the improved modeling in analysis of a device like CVSR.
The power transferred to the dc circuit for an ideal current source, shown in Fig. 23, is also significantly higher than in the previous case due to the higher induced voltages from including the hysteresis effect.
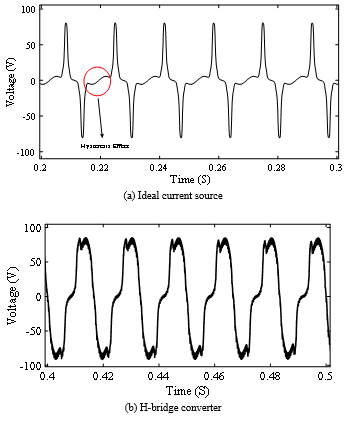
Figure 21: Terminal voltage for different dc electric control circuits (Idc = 15 A)
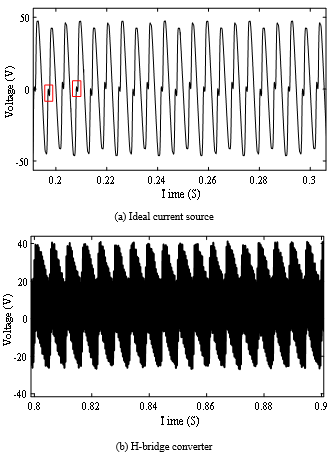
Figure 22: Induced voltage across dc winding for different dc sources (Idc = 15 A)
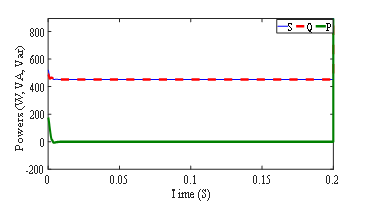
Figure 23: Power transferred to dc winding (Idc= 15A)
5.2.3. 45A dc bias
At a high dc offset of 45 A, the CVSR core again goes into complete saturation. The fluxes through the legs decrease due to core fully saturation. Hence, the terminal voltage and the voltage across the dc winding are very low. Figs. 24 (a)-(b) show the terminal voltage on one phase of the CVSR for an ideal current source and an H-bridge converter, respectively.
Figs. 25 (a)-(b) show the induced voltage across the dc winding for the same dc source types. In Fig. 25, the distorted peaks encircled in red, due to the hysteresis effect, are still visible.
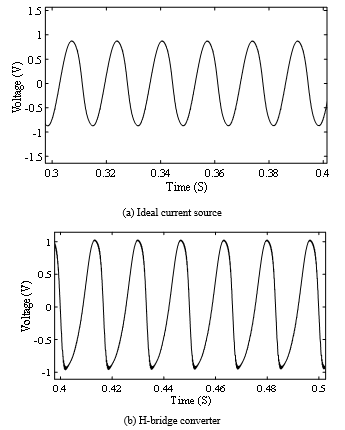
Figure 24: Terminal voltage (Idc = 45 A)
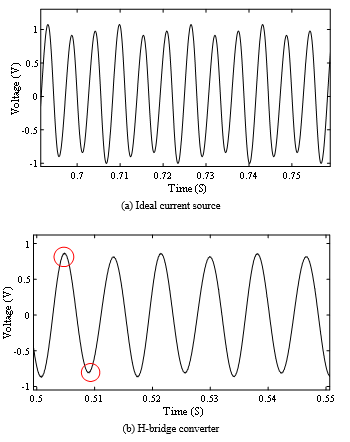
Figure 25: Induced voltage across dc winding for different dc sources (Idc = 45 A)
The power transferred to the dc winding for a Buck converter in this case is shown in Fig. 26.
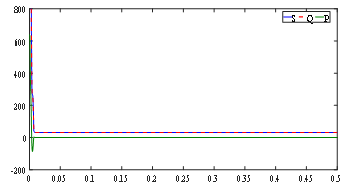
Figure 26: power transferred to dc winding (Idc = 45 A)
Tables I and II summarize the terminal voltage values and the resulting effective CVSR impedance values derived from the results of the analysis. The differences in the impedance reveal that both the dc source type and the hysteresis effect significantly impact the effective AC reactance of the CVSR.
6. Conclusion
The paper presents an improved realistic model of a three-phase CVSR, based on the gyrator-capacitor modeling approach. To improve the accuracy for an electromagnetic device that operates in the whole range of its B-H characteristic like the CVSR, hysteresis and core saturation nonlinearities are considered. Capacitors model permeances (magnetic conductances), and nonlinear capacitors can model core saturation. Additionally, a resistor connected in series with the core capacitor represent core hysteresis. Simulations of the improved G-C model of three-phase CVSR under different conditions and at different values of the bias dc current have been performed. Different dc control source types have also been considered. Results from the comprehensive analysis show significant impacts on the performance of the CVSR from a more realistic model.
Table 1: AC impedance and terminal voltage for different DC sources and currents – no hysteresis
| Bias current
Bias source |
0A (No saturation) | 15A (Partial saturation) | 45A (Full saturation) | |||
| Impedance | Voltage | Impedance | Voltage | Impedance | Voltage | |
| Ideal current | 3.185 Ω | 66.64 V | 1.31Ω | 27.3 V | 0.060 Ω | 0.88 V |
| Ideal voltage | 3.196 Ω | 66.81 V | 1.82 Ω | 38.1 V | 0.119 Ω | 1.85 V |
| Buck converter | 3.192 Ω | 66.73 V | 1.56 Ω | 32.4 V | 0.080 Ω | 1.21 V |
| H-bridge | 3.192 Ω | 66.74 V | 1.69 Ω | 35.4 V | 0.077 Ω | 1.15 V |
Table 2: AC Impedance and Terminal Voltage for Different DC Sources and Currents – With Hysteresis
| Bias current
Bias source |
0A (No saturation) | 15A(Partial saturation) | 45A (Full saturation) | |||
| Impedance | Voltage | Impedance | Voltage | Impedance | Voltage | |
| Ideal current | 3.57 Ω | 74.64 V | 1.97 Ω | 41.3 V | 0.070 Ω | 1.07 V |
| Ideal voltage | 3.73 Ω | 77.82 V | 2.51 Ω | 52.3 V | 0.145 Ω | 2.07 V |
| Buck converter | 3.71 Ω | 77.73 V | 2.24 Ω | 46.4 V | 0.092 Ω | 1.33 V |
| H-bridge | 3.71 Ω | 77.74 V | 2.23 Ω | 46.8 V | 0.088 Ω | 1.24 V |
- M. Hayerikhiyavi and A. Dimitrovski, “Impact of Different Types of DC Bias Sources on the Effective Impedance of a CVSR,” in 2022 IEEE Kansas Power and Energy Conference (KPEC), 1-6, 2022, doi: 10.1109/KPEC54747.2022.9814785.
- A. Dimitrovski, Z. Li, B. Ozpineci, “Applications of saturable-core reactors(SCR) in power systems,” in 2014 IEEE PES T&D Conference and Exposition, 1–5, 2014, doi:10.1109/TDC.2014.6863404.
- A. Dimitrovski, Z. Li, B. Ozpineci, “Magnetic Amplifier-Based Power-FlowController,” IEEE Transactions on Power Delivery, 30(4), 1708–1714, 2015, doi:10.1109/TPWRD.2015.2400137.
- M. Hayerikhiyavi and A. Dimitrovski, “Gyrator-Capacitor Modeling of A Continuously Variable Series Reactor in Different Operating Modes,” in 2021 IEEE Kansas Power and Energy Conference (KPEC), 1-5, 2021, doi: 10.1109/KPEC51835.2021.9446236.
- M. Hayerikhiyavi and A. Dimitrovski, “Comprehensive Analysis of Continuously Variable Series Reactor Using G-C Framework,” in 2021 IEEE Power & Energy Society General Meeting (PESGM), 1-5, 2021, doi: 10.1109/PESGM46819.2021.9637971.
- M. Young, A. Dimitrovski, Z. Li and Y. Liu, “Gyrator-Capacitor Approach to Modeling a Continuously Variable Series Reactor,” in IEEE Transactions on Power Delivery, 31(3), 1223-1232, 2016, doi: 10.1109/TPWRD.2015.2510642.
- Valadkhan S, Morris K, Khajepour A. “Review and Comparison of Hysteresis Models for Magnetostrictive Materials”. Journal of Intelligent Material Systems and Structures. 2009;20(2):131-142.
- M. F. Jaafar and M. A. Jabri, “Study and modeling of ferromagnetic hysteresis,” in 2013 International Conference on Electrical Engineering and Software Applications, 1-6, 2013, doi: 10.1109/ICEESA.2013.6578426.
- M. Hayerikhiyavi and A. Dimitrovski, “Improved Gyrator-Capacitor Modeling of Magnetic Circuits with Inclusion of Magnetic Hysteresis,” in 2022 IEEE/PES Transmission and Distribution Conference and Exposition (T&D), 1-5, 2022, doi: 10.1109/TD43745.2022.9816976.
- S. D. Sudhoff, B. T. Kuhn, K. A. Corzine, B. T. Branecky, “Magnetic Equivalent Circuit Modeling of Induction Motors,” IEEE Transactions on Energy Conversion, 22(2), 259–270, 2007, doi:10.1109/TEC.2006.875471.
- G. M. Shane, S. D. Sudhoff, “Refinements in Anhysteretic Characterization andPermeability Modeling,” IEEE Transactions on Magnetics, 46(11), 3834–3843,2010, doi:10.1109/TMAG.2010.2064781.
- D. C. Hamill, “Gyrator-capacitor modeling: a better way of understanding magnetic components,” Proceedings of 1994 IEEE Applied Power Electronics Conference and Exposition – ASPEC’94, Orlando, FL, USA, 1994, pp. 326-332 vol.1, doi: 10.1109/APEC.1994.316381.
- S. Pokharel and A. Dimitrovski, “Modeling of An Enhanced Three-phase Continuously Variable Reactor,” in 2020 IEEE Power & Energy Society General Meeting (PESGM), 1-5, 2020, doi: 10.1109/PESGM41954.2020.9282074.
- M. Hayerikhiyavi and A. Dimitrovski, “Voltage Balancing Using Continuously Variable Series Reactor,” in 2023 IEEE Texas Power and Energy Conference (TPEC), 1-5, 2023, doi: 10.1109/TPEC56611.2023.10078529.