
Forecasting Bitcoin Prices: An LSTM Deep-Learning Approach Using On-Chain Data
Volume 8, Issue 3, Page No 186-192, 2023
Author’s Name: Yu-Jin An1, Ha-Young Oh2,a), Hyun-Jong Kim3
View Affiliations
1Department of Fintech, Sungkyunkwan University, Seoul, 03063, Korea
2College of Computing & Informatics, Sungkyunkwan University, Seoul, 03063, Korea
3Department of Artificial Intelligence Convergence, Sungkyunkwan University, Seoul, 03063, Korea
a)whom correspondence should be addressed. E-mail: hyoh79@gmail.com
Adv. Sci. Technol. Eng. Syst. J. 8(3), 186-192 (2023); ![]() DOI: 10.25046/aj080321
DOI: 10.25046/aj080321
Keywords: Bitcoin, On-chain, Blockchain, Cryptocurrency, Deep Learning, RNN, LSTM, Price

Export Citations
Over the past decade, Bitcoin’s unprecedented performance has underscored its po-sition as the premier asset class. Starting from an insignificant value and reaching an astounding high of around 65,000 U.S dollars in 2021 – all without a central con-trolling authority – Bitcoin’s trajectory is undoubtedly a historical feat. Its intangible nature, initially a subject of skepticism, has turned into an attractive quality, leading many investors to allocate a significant portion of their portfolios to Bitcoin. The traditional banking and investment sectors have also turned their attention to Bitcoin’s exponential growth. Concurrently, research on macro-economic variables and investor sentiment explaining Bitcoin’s price fluctuations has seen considerable development. However, there is a notable absence of studies leveraging On-Chain Data, information derived from transaction data in Bitcoin’s blockchain network. This paper fills this gap by using LSTM (Long Short-Term Memory), a technique widely utilized for time-series data prediction, in conjunction with On-Chain Data, to predict Bitcoin prices.
Received: 09 November 2022, Accepted: 30 May 2023, Published Online: 25 June 2023
1. Introduction
In recent years, Bitcoin has been in the spotlight not only of investors, but also in fields such as politics and media. Ever since its advent in 2008, Bitcoin has appreciated exponentially in U.S dollar terms, reaching a price of $20,000 in January of 2017. The dramatic increase in the price of Bitcoin formed an atmosphere among the public that Bitcoin may be a good means to store value. Governments around the world, on the other hand, expressed deep concerns about Bitcoin’s volatile nature. Despite the concerns of financial regulators and governments, in 2021 Bitcoin once again pumped over $64,900, though it did cool-off after Elon Musk’s negative tweets on Bitcoin.
The Bitcoin rally that was seen during 2020 and 2021 drew more attention to Bitcoin than ever before. Huge financial investment firms and multinational corporations such as Tesla started to accept Bitcoin as means of payment. According to the article[1], Moreover, rumors behind Apple accepting Bitcoin as a means of payment based on its Apple Pay seems likely to become a reality. Such interest from multinational corporations is making even those doubtful about Bitc oin enter or re-enter the crypto space.
Many estimate that Bitcoin has potential to break its all-time high in the near future and argue that its fundamentals seem to be strengthening as time passes [2]. However, as seen in the recent 50% drop, the Bitcoin market is still very volatile and can be risky to many, especially retail investors. Firms such as Tesla and Micro Strategy, unlike retail investors, have the financial stability to seek longer term returns and can manage the risks accompanied with downside volatility. The fundamental differences between the so-called Bitcoin “whales” and retail investors lead retail investors to be more elastic to downside price movements and loss from investing in Bitcoin. Considering how the cyrpto-currency market is unregulated compared to traditional assets such as real estate and equity, the fear of loss can be much bigger for retail investors than big firms [3].
There have been numerous research projects that attempted to predict the movement of this unstable market using the methods that were used to predict the price of traditional assets such as stocks. However, these studies seem to neglect the fact that there are data on Bitcoin itself that contain more information about the potential movement of Bitcoin’s price [4]. Thus, this research attempts to use data that are obtained directly from Bitcoin’s blockchain, called on-chain data. This attempt may be conducive to providing guidelines to retail investors on which data an investor should focus when investing in Bitcoin. We review related work in Section 2, discuss the background of our data and theory in Section 3, and present our data preprocessing and test analysis in Section 4. Finally, we conclude in Section 5.
2. Related Works & Literature
As Bitcoin solidifies its position as a mainstream asset class, various studies regarding Bitcoin’s price have been conducted. Early research on Bitcoin concentrated on looking for the factors that determine Bitcoin’s price. These factors include the macroeconomic variables gold price, inflation, employment rates, and stock index. Other factors that were shown to influence Bitcoin’s price include twitter and news sentiment.
Corporate interest to own Bitcoin to hedge against inflation gave Bitcoin the famous alias ‘digital gold’. The firms that entered the Bitcoin market sparked interest in trading algorithms like it did in the equity market[5]. The use of trading algorithms in the crypto currency market also resulted in many researchers and traders making use of machine learning and deep learning algorithms to predict the price movements of Bitcoin to improve the returns of the trading algorithms in use. The studies can be categorized based on the variables that were used and the goals of each research [6].
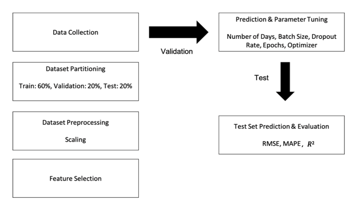
Figure 1: The flow of the experimentation process
The studies listed in Table 1 mainly used data such as trading volume that were obtained from crypto currency exchanges, macro-economic variables, and sentiment analysis of social networking services such as Twitter. There are studies that conduct their research using blockchain data such as hash rate and mining difficulty. However, such data are what is written explicitly on the blocks and are not what are obtained using thorough analysis of the transactions recorded in the blocks. Thus, to make better use of the data from Bitcoin’s chains, this research aims to make use of LSTM (Long Short-Term Memory) based on on-chain data obtained through thorough analysis of transaction data recorded in Bitcoin’s blockchains. We predicted the price of Bitcoin based on various data such as price forecasts from FOMC announcements[7], [8]. In particular, a recently published study [9] utilized on-chain data and used LSTM, which is similar to our work. However, the data, time period, and features we used are different. We utilized market data to consider the “Kimchi Premium,” which is unique to the Korean coin market and is different from other coin exchange data.
Our research will proceed as illustrated in Fig. 1. First, an explanation of the on-chain data that will go through feature engineering will be followed by an explanation of the LSTM. Next, the process of how the features were scaled and selected will be explored. Finally, the preprocessed data will be used to predict Bitcoin’s future price and will be evaluated based on certain performance measures.
Table 1: summary of related works on bitcoin prediction
| Name of Thesis | Research Topics & Goals | Characteristics | |
| 1 | Deep Learning Approach to Determine the Impact of Socio-Economic Factors on Bitcoin Price Prediction | Predicting Bitcoin price based on gold price and tweet sentiment |
– Use of high-frequency Data (5-minutes) – Compared prediction performance of bitcoin price with variables from the traditional market and investor sentiment |
| 2 | Do FOMC and macroeconomic announcements affect Bitcoin prices? | Look into the impact FOMC announcement have on Bitcoin price |
– Use of announcement about traditional economic factors such as employment rate, PPI, and CPI – Implemented traditional statistical methods such as regression t-statistics and p-value to figure out the impact the announcements have |
| 3 | Empirical Analysis on Bitcoin Price Change by Consumer, Industry and Macro-Economy Variables | Look into impact of diverse factors that might potentially have effects on Bitcoin price |
– Implemented diverse hypotheses not only about economic variables, but also search traffic on certain keywords such as ‘war’ or ‘ransomware’ that might have relation to bitcoin’s security. – Implemented traditional statistical methods |
| 4 | The Determinant of Bitcoin Prices in Korea | Investigate the determining factors that contribute to Bitcoin price in Korea |
– Used diverse factors that affect Korea domestically such as inflation, industrial supply, unemployment, KOSPI index, and Naver trend – Use of traditional statistical methods |
| 5 | The Prediction model of cryptocurrency price using news sentiment analysis and deep learning | Predicting Bitcoin price using news sentiment |
– Use of news instead of social networking services such as twitter to measure sentiment – Used deep learning methods such as RNN and compared with ARIMA |
| 6 | Price clustering and sentiment in Bitcoin | Showing the impact of investor sentiment on Bitcoin price clustering |
– Utilized various traditional trading data such as price, volume, and number of trades and find relation to sentiment online – Use of traditional statistical methods |
| 7 | Bitcoin price forecasting with neuro-fuzzy techniques | Predicting Bitcoin price using a hybrid Adaptive Neuro-Fuzzy Inference System (ANFIS) |
– Compared the performance between diverse deep-learning models such as artificial neural network and fuzzy logic – Devised a hybrid architecture of already existing ANFIS to predict Bitcoin price |
| 8 | Predicting the Price of Bitcoin Using Machine Learning | Predicting the direction of Bitcoin daily closing price |
– Compared performance of deep learning sequential models such as RNN and LSTM in Bitcoin prediction with the ARIMA method – Used only price data |
| 9 |
Bitcoin price prediction using machine learning: An approach to sample dimension engineering
|
Predicting the direction of Bitcoin daily and 5-minute interval price |
– Used On-chain data such as block size, hash rate, and mining difficulty – Compared performance between statistical, machine learning, and deep learning methods |
| 10 | Predicting the direction, maximum, minimum, and closing prices of daily Bitcoin exchange rate using machine learning techniques | Predicting various prices using machine learning techniques | – Utilized diverse data from Bitcoin chain and traditional financial markets |
| 11 | A Streaming Data Collection and Analysis for Cryptocurrency Price Prediction using LSTM | Full data analysis steps from data collection to model evaluation using Long Short-Term Memory (LSTM) for predicting cryptocurrency prices |
– Data Collection via Web Crawling at coinmarketcap.com – BTC, ETH, and LCT price prediction through LSTM based on collected data |
3. Data and Background
The most important aspect of this research is the use of on-chain data, a type of data that were not utilized in earnest in previous studies on predicting the price of Bitcoin. Therefore, section A of Part 3 will be an explanation of on-chain data for a better understanding of the overall research. The data are subdivided into six categories.
3.1. On-Chain Data Explanation
1) EXCHANGE FLOWS DATA
Exchange flow data play a major role in explaining potential movements in the Bitcoin price. Unless Bitcoin is traded over the counter, most of its trading takes place in the Bitcoin exchange[10]. In this category, total reserves, reserve net flow, address count, and transaction count data will first be considered as potential factors that have influence in the predictability of the model. In any asset class, it is considered that the more assets there are in the market, the less valuable. ‘Total reserve’ and ‘total reserve net flow’ are data that show the amount of Bitcoin in the Bitcoin exchanges and the amount of Bitcoin that came into the exchange and went out. It can be inferred from the famous adage from economics, ‘the more the supply, the lower the price’, more stocks of Bitcoin in exchanges and more inflow into exchanges can lead to a lower price. The ‘address count’ and ‘transaction count’ data show the number of addresses participating and the number of transactions made in the exchange.
2) FLOW INDICATOR
Flow indicators help assume the risks of holding Bitcoin and give insights on the value of holding Bitcoin. ‘Exchange whale ratio’ and ‘stablecoins ratio’ are two indicators that fall into this category. ‘Exchange whale ratio’ is calculated by dividing the sum of the top 10 inflows by the sum of the total inflows into exchanges. Several Bitcoin traders think that whales, who own more than a thousand bitcoins, have enough control over the market and can decide the movement of Bitcoin’s price. The ‘stablecoins ratio’ is calculated by dividing the total bitcoin reserve in exchanges by the total stablecoins reserve. Stablecoins such as USD Tether is what participants in the market use to buy cryptocurrencies. Thus, the reserve of stablecoins in exchanges can signify the amount of demand pressure in the market.
3) MARKET INDICATOR
Indicators such as ‘estimated leverage ratio’ and ‘MVRV (Market Value to Realized Value)’ fall into this category [11]. Market indicators concentrate on showing how much the market’s investors are heated or cooled off. To be specific, ‘estimated leverage ratio’, which is calculated by dividing the open interests of exchanges by the exchanges’ Bitcoin reserves, represents the average amount of leverage of the market participants. MVRV, calculated by dividing the market value by the realized value, illustrates the relationship between short-term and long-term investors.
4) MINER FLOW
Miner flow data focus on showing the flow of Bitcoin from the miners’ wallets. Miners are critical players in the Bitcoin ecosystem in that they are the ones who secure the network and confirm transactions and get paid with Bitcoin in return. ‘Miner’s total reserve’ and ‘miner’s net flow’ are the total amount of Bitcoins in the miner’s wallets and the net change in the miners’ reserves in a given time horizon, respectively [12].
5) MARKET DATA
Market data are comprised of the open, close, low, and high U.S dollar value of Bitcoin in each time period
6) NETWORK DATA
Network data consist of information recorded in each block of the Bitcoin chain, such as transaction fees, mining difficulty, and hashrate [13] , [14]. Network data were previously used along with other macro-economic metrics and social networking sentiment data to predict the price of Bitcoin. ‘Transaction fee’ shows the amount of fees that incurred from the transactions in a block. Mining difficulty shows how difficult it was to mine the specific block. Lastly, hashrate shows how quickly the miners solve hash problems to mine Bitcoin.
3.2. LSTM Background
1) RNN (RECURRENT NEURAL NETWORK)
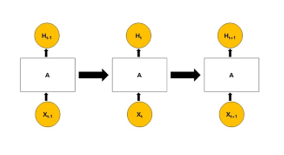
Figure 2: Structure of an RNN
An RNN [15], unlike an ANN (Artificial Neural Network), forms a loop so that information persists throughout the network. As illustrated in [Fig. 2], if there is a neural network A, x and output o, the RNN consistently inputs the element in xt to the successor output ot. Therefore, RNNs are adequate to process data in the form of chains or lists. Due to this trait, RNNs are frequently used in speech recognition and language modeling.
2) LSTM (LONG SHORT TERM MEMORY)
An LSTM [16] can be considered as a sub-category of RNNs. Although RNNs make use of the output ot-1, as the output gets processed and the gap gets wider, RNNs can’t connect current information and the information input in the distant past.
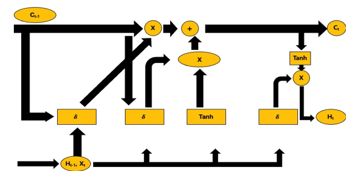
Figure 3: LSTM structure
An RNN, unlike an ANN (Artificial Neural Network), forms a loop so that information persists throughout the network. As illustrated in [Fig. 2], if there is a neural network A, Xt and output o, the RNN consistently inputs the element in Xt to the successor output ot. Therefore, RNNs are adequate to process data in the form of chains or lists. Due to this trait, RNNs are frequently used in speech recognition and language modeling.
To deal with this problem, LSTMs have a rather complex structure and involve diverse linear interactions compared to their simple counterpart [17]. Fig. 3. shows the Ht of LSTMs. The upper arrow is where the cell state Ct-1 is inputted. The upper arrow seems more straightforward than the arrows below. This shows that Ct-1 faces minor interactions. Cell states are also passed through gates, structures that control whether to remove or add information to the cell state. Gates, which consist of a sigmoid layer and a pointwise multiplication operation, output values between 0 and 1. The higher the value, the more of its components are let through. An LSTM network has three such gates. To be specific, the first layer, known as the ‘forget gate layer’, receives , which is the output of the previous LSTM and xt, the t-th input and returns values between 0 and 1, which shows how much of Ct-1 should pass through. Next, another sigmoid layer, which is also known as the input gate layer, determines the values that will be updated. The tanh layer then makes new values C̃ t, which are candidates that can be added to the state. The sigmoid layer and the tanh layer are combined to create an update to the state. After going through the layers, the output that went through the first sigmoid layer ft is multiplied by the old cell state Ct-1. Moreover, the output of the second output layer and the tanh layer are multiplied as well. The two outputs from the multiplications are then added. Finally, to decide the output, the final sigmoid layer and tanh decide which part of the cell state will be the outcome of the process.
The fact that LSTMs consistently make use of the necessary information is the key to making predictions. Time-series data, such as the data used in this research, can make good use of the LSTM characteristic in that they do not abandon data with a large enough time gap. Moreover, since they drop the information that doesn’t seem vital to the prediction process, LSTMs suit well with Bitcoin prediction, which can contain noise in the data [18].
4. Experimentation & Evaluation
4.1. On-Chain Data Explanation
1) DATA PREPROCESSING & ENGINEERING
The necessary on-chain data and price data were extracted from CryptoQuant (www.cryptoquant.com) via an api access. CryptoQuant provides not only ‘Reserve’ and ‘Exchange’ data, but also provides data on the Bitcoin network and miners. However, it is important to note that the time frame of each datum can be different. Low-frequency (day) data were provided for most features, but high-frequency data such as hourly data were not provided for many features. Therefore, the experiment was based on low-frequency data to avoid having different time frames in the features. The data were first split into training, validation, and test sets. The training set consists of data from April 19th, 2019, to July 5th, 2020, which is a total of 444 days. The validation set and the test set are the data from July 6th, 2020, to November 30th, 2020, and December 1st, 2020 to April 27th, 2021, respectively, which sums up to 144 days each.
The most important part of the experiment was the scaling method. If the whole dataset is scaled at once, the 2-year length of data would be incapable of capturing the short-term trends which are apparent in the data. Thus, the scaling of the training data and the test data were done separately. The specific methodology to implement the scaling is illustrated in [Algorithm 1].
| Algorithm 1: Algorithm for the scaling method | |||
|
Requirements: Scaled Training Dataset, Test Dataset, Look Back Days split features(X) and target(y) for both training and test datasets make two new lists for features and target # Making Training Dataset Suitable for LSTM
for i in range(from=lookback days, to=dataset length): append features[i-lookback:i] to features list append target[i] to target dataset
# test set scaling make new empty an empty list for features and two new lists for target
for i in range(from=len(training data), to=len(whole data length)): standard scaling for features[i-look back:i] append to new features list standard scaling for target[i-lookback:i] append to new target list(for inverse-scaling) append target[i] to new target list2 |
|||
4.2. Hyperparameter Tuning & Validation
Table 2 shows the features that were selected after scaling the training set. The 10 features were selected using sklearn.model_selection’s Select K Best setting the score function to mutual information. The prediction was done using Python’s Keras library. The data was scaled so that all values were between 0 and 1.
Table 2: 10 selected features
| Feature | Definition | Feature Type |
| Exchange Reserve | Total Number of Bitcoins in Exchanges | Exchange Flows |
| Exchange Transactions Count Outflow | Total Number of Transactions flowing out of Bitcoin Exchanges | Exchange Flows |
| Addresses Count Inflow | Total Number of Addresses involved in Inflow Transactions | Exchange Flows |
| Fund Flow Ratio |
The total BTC amount flowing into or out of exchanges divided by the total BTC transferred on the whole Bitcoin network
|
Flow Indicator |
| Estimated Leverage Ratio | Open Interest of Exchange divided by Exchange’s Bitcoin Reserve | Market Indicator |
| Stablecoin Supply Ratio | Ratio of the stablecoin supply in the whole cryptocurrency market. | Market Indicator |
| Miner’s Reserve | Total Number of Bitcoins Miners hold | Miner Flows |
| Miner’s Reserve in USD | USD total of Bitcoins Miners hold | Miner Flows |
| Open Interest | BTC Perpetual Open Interest from derivative exchanges. | Market Data |
| Hashrate | The mean speed at which miners in the network solve hash problems. | Network Data |
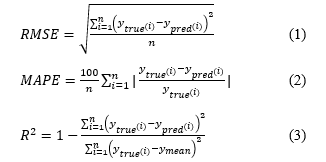
Moreover, hyper-parameter tuning was done to make the results as accurate as possible. The model’s performance is evaluated using RMSE, MAPE, and R-squared, all of which are used frequently to measure the performance of regression models.
To optimize the model’s performance, hyperparameter tuning was performed using a grid search method. Specif-ically, we used scikit-learn’s GridSearchCV function to sys-tematically search through different combinations of hy-perparameters, including lookback day, epoch, batch size, unit, dropout rate, and optimizer, in order to identify the combination that produced the best results. GridSearchCV performs a search over a pre-defined parameter space, and returns the best combination of parameters based on cross-validation scores. In our study, the best combination of hyperparameters was found to be a lookback day of 3, an epoch of 30, a batch size of 128, a unit of 1, a dropout rate of 0.4, and the optimizer set to Nadam, which pro-duced the highest scores for all three metrics.
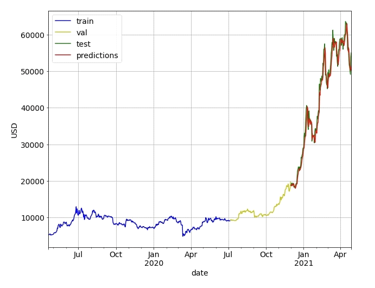
Figure 4: Prediction Result (Full Data Length)
4.3. Test Results & Evaluation
Table 4 shows the performance of the validation and test predictions. During the validation process, the RMSE, MAPE, and R2 results were 457, 2.267%, and 0.968, respectively. In the test set prediction, the RMSE, MAPE, and R2 results were 2344, 4.316%, and 0.971, respectively. There was some gap between the performance between the validation and the test prediction. A possible explanation for this would be the variation of the Bitcoin price during the validation set’s data and the test set’s data. Starting from December of 2020, Bitcoin’s price started its rally and almost tripled from 20,000 U.S dollars to 65,000 U.S dollars, while during July to November of the same year, Bitcoin price was in the price range between 10,000 U.S dollars to 20,000 U.S dollars. Moreover, the participation of institutions in the market might have influenced the data during the test set’s time-period.
Table 4: validation/test evaluation
| Evaluation Metrics | Validation | Test |
| RMSE | 436.894 | 2162.380 |
| MAPE | 2.074% | 3.993% |
| R2 | 0.971 | 0.976 |
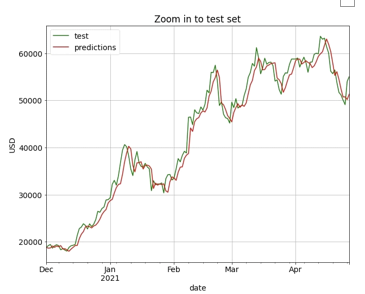
Figure 5: Comparison Between Prediction Results and Actual Data
5. Conclusion
This research was based on Bitcoin’s on-chain data provided by CryptoQuant. The results show that on-chain data might be of good use when predicting the movement of Bitcoin’s price rather than traditional factors such as macro-economic data. Although data such as hashrates were used in previous studies, better performance might be drawn from the movement of Bitcoin in the exchange’s reserve or the miners’ wallets, which were data that were not previously used to forecast Bitcoin’s price movement. Although, such data are not yet utilized as much, the use of deep-learning algorithms such as LSTM with on-chain data might provide a good guideline of where Bitcoin’s price will be in the near-future. However, this work should be extended in some way, e.g., by comparing the performance of different deep learning models and/or classical non-deep learning-based models.
This research made use of various on-chain data, but there still are some on-chain data that were not available because of budget restraints but might be useful for prediction. Especially, the movement of ‘whales’ who hold more than 1,000 bitcoins is suspected to have a tremendous impact in Bitcoin’s price and can be subject to further research. Furthermore, if on-chain data and macro-economic variables are used together for prediction, there is a possibility of improvement in the prediction performance.
In addition, prediction using high-frequency data can also be a valid research topic. Especially when day-trading is such a huge part of the Bitcoin market. Using high-frequency data for prediction can lead to higher profits for those who invest in Bitcoin.
Finally, using other cryptocurrencies and their on-chain data for price prediction needs further research as well. Other cryptocurrencies have important data of their own. Cryptocurrencies that use Proof of Stake as a validation method do not have data such as hashrate and difficulty. Thus, other data in their blockchains need to be extracted to make a solid prediction of their prices.
Acknowledgment
This work was supported by the National Research Foundation of Korea (NRF) grant funded by the Korean government (MSIT) (No. NRF-2022R1F1A1074696).
- T. Bradshaw, “Apple ad for ‘alternative payments’ job signals cryptocurrency interest”, The Financial Times, May 27, 2021.
- A. Inamdar; A. Bhagtani; S. Bhatt; P. M. Shetty, “Predicting Cryptocurrency Value using Sentiment Analysis”, International Conference on Intelligent Computing and Control Systems (ICCS), 2019, doi:10.1109/ICCS45141.2019.9065838
- J. Lee, K. Kim, and D. Park, “Empirical Analysis on Bitcoin Price Change by Consumer, Industry and Macro-Economy Variables”, Journal of Intelligence and Information Systems, 24, 2018, doi:10.13088/jiis.2018.24.2.195
- A. Aggarwal, I. Gupta, N. Garg and A. Goel, “Deep Learning Approach to Determine the Impact of Socio Economic Factors on Bitcoin Price Prediction”, Twelfth International Conference on Contemporary Computing (IC3), 2019, doi:10.1109/IC3.2019.8844928
- S. Ilie DRAGOE, C. OPREAN-STAN, “BITCOIN, THE MOTHER OF ALL BUBBLES OR THE FUTURE OF MONEY?”, International Conference KNOWLEDGE-BASED ORGANIZATION, 2020, doi:10.2478/kbo-2020-0046
- A. Baig, B. M. Blau and N. Sabah, “Price clustering and sentiment in bitcoin”, Finance Research Letters, 29, 2019, doi:10.1016/j.frl.2019.03.013
- S. Pyo, J. Lee, “Do FOMC and macroeconomic announcements affect Bitcoin prices?”, Finance Research Letters, vol. 37, 2020, doi:10.1016/j.frl.2019.101386
- K. Lee, S. Cho, G. Min and C. Yang, “The Determinant of Bitcoin Prices in Korea”, Korean Journal of Financial Studies, 47, 2019, doi:10.26845/KJFS.2019.08.48.4.393
- Kim, Gyeongho & Shin, Dong-Hyun & Choi, Jaegyeong & Lim, Sunghoon. “A Deep Learning-Based Cryptocurrency Price Prediction Model That Uses On-Chain Data.” IEEE Access. 10. 56232-56248, 2022, doi:10.1109/ACCESS.2022.3177888.
- G. S. Atsalakis, I. G. Atsalaki, F. Pasiouras, C. Zopounidis, “Bitcoin price forecasting with neuro-fuzzy techniques”, European Journal of Operational Research, 276, 2019, doi:10.1016/j.ejor.2019.01.040
- S. Oikonomopoulos, K. Tzafilkou, D. Karapiperis and V. Verykios, “Cryptocurrency Price Prediction using Social Media Sentiment Analysis,” International Conference on Information, Intelligence, Systems & Applications (IISA), Corfu, Greece, 2022, doi:10.1109/IISA56318.2022.9904351.
- S. McNally, J. Roche and S. Caton, “Predicting the Price of Bitcoin Using Machine Learning,” 2018 26th Euromicro International Conference on Parallel, Distributed and Network-based Processing (PDP), 2018, doi:10.1109/PDP2018.2018.00060
- D. C. Mallqui and R. A. Fernandes, “Predicting the direction, maximum, minimum and closing prices of daily Bitcoin exchange rate using machine learning techniques”, Applied Soft Computing, 75, 2019, doi:10.1016/j.asoc.2018.11.038
- Z. Chen, C. Li and W. Sun, “Bitcoin price prediction using machine learning: An approach to sample dimension engineering”, Journal of Computational and Applied Mathematics, 365, 2020, doi:10.1016/j.cam.2019.112395
- M. Schuster and K. K. Paliwal, “Bidirectional recurrent neural networks,” in IEEE Transactions on Signal Processing, 45, 1997, doi:10.1109/78.650093.
- Tehseen Zia and Usman Zahid. “Long short-term memory recurrent neural network architectures for Urdu acoustic modeling.” Int. J. Speech Technol, 22, 21–30, 2019, doi:10.1007/s10772-018-09573-7
- F. Valencia, A. Gómez-Espinosa, B. Valdés-Aguirre, “Price Movement Prediction of Cryptocurrencies Using Sentiment Analysis and Machine Learning”, 2019, doi:10.3390/e21060589
- A. Kim, Jongyeop & Wimmer, Hayden & Liu, Hong & Kim, Seongsoo, “A Streaming Data Collection and Analysis for Cryptocurrency Price Predic-tion using LSTM.”, in 2021 IEEE/ACIS 6th International Conference on Big Data, Cloud Computing, and Data Science (BCD), 45-52. 2021, doi:10.1109/BCD51206.2021.9581491.