
A Numerical Study on The Change in Safety Factor (FOS) According to Slope Angle Change for The Establishment of Photovoltaic Facilities Using SRM (Strength Reduction Method)
Volume 8, Issue 3, Page No 178-185, 2023
Author’s Name: Seungjea Lee1,a), Moonwoo Park2
View Affiliations
Fire Insurers Laboratories of Korea, Research & Development Strategy Team, Korea Fire Protection Association, Yeoju, 12661, Republic of Korea
a)whom correspondence should be addressed. E-mail: sjlee@kfpa.or.kr
Adv. Sci. Technol. Eng. Syst. J. 8(3), 178-185 (2023); ![]() DOI: 10.25046/aj080320
DOI: 10.25046/aj080320
Keywords: Strength reduction method, Solar power generation, FEM analysis, Factor of safety

Export Citations
As the significance of new and renewable energy is highlighted, land-based solar power generation has seen remarkable progress. This study utilizes the Strength Reduction Method in DIANA, a numerical analysis software, to assess the stability concerning various variables, such as slope angle, water level, water depth, and changes in material properties, with a focus on the factor of safety (FOS). This research aims to address the safety concerns of land-based solar power generation facilities installed on varying terrains. The standardized slope permit criteria for solar panels in mountainous areas were revised to a steeper 15 degrees, however, this shift necessitates further investigation as it is not grounded on ample research. Findings from this study revealed a decreasing trend in the factor of safety (FOS) with the increasing slope angle and an inverse proportionality between the factor of safety (FOS) and groundwater level. Moreover, we analyzed the factor of safety (FOS) concerning water level and soil strength. Future studies will incorporate additional factors for a more comprehensive safety factor (FOS) assessment.
Received: 24 April 2023, Accepted: 12 May 2023, Published Online: 12 June 2023
1. Introduction
Over the years, South Korea has experienced a significant increase in solar power capacity, rising from 1,362 MW in 2017 to 4,658 MW in 2020 [1]. However, the expansion came with challenges, most notably damage to panels installed without adhering to the recommended guidelines. In many cases, these installations were on varying soil types, each of which presents unique challenges and considerations when it comes to stability. To combat this, the Ministry of Environment and the Korea Forest Service tightened regulations, reducing the permissible slope angle for installations from 25 degrees to 15 degrees [2].
These changes, although crucial for safety, led to concerns within the industry regarding their potential impact on operations and a lack of sufficient precautions for accidents. Moreover, the Korea Environment Institute (KEI) proposed even stricter slope criteria, recommending an angle of 10 degrees or less [1], without differentiating between soil types. Given these diverging guidelines, the need to verify the appropriateness of the slope criteria for different soil types became apparent.
In response to this, the current study aims to evaluate the validity of these guidelines for different soil types. We plan to analyze the standardized slope permit criteria of 15 degrees, compare it with the serviceability analysis result (slope 10 degrees or less), and assess them against the “minimum safety factor” and “safety factor for collapse” for each soil type under study.
2. Factor of Safety (FOS) and Theoretical Background
2.1. Scope of Research
This study can be broadly divided into three parts, as follows: 1) analyzing slope stability based on the location of the groundwater table, 2) analyzing slope stability based on the groundwater level, and 3) analyzing slope stability based on the degree of soil hardness. Each of these parts will utilize the Factor of Safety (FOS), a critical indicator in slope stability analysis which measures the capacity of a system to resist failure. The exact range of the FOS considered will be determined based on a thorough survey of the relevant literature to ensure that our study reflects the most up-to-date and the most relevant data.
While some studies highlight the potential risks and challenges of installing solar panels on steep slopes, others present innovative solutions and strategies for overcoming these challenges. Together, these case studies underscore the importance of proper site evaluation, strategic planning, and rigorous safety measures.
These analyses will be conducted using the commercial finite element program TNO DIANA [3]. TNO DIANA was selected because it provides excellent material models for damage and collapse modelling implementation compared to other finite element packages. Additionally, it provides a robust platform for implementing the calculation of FOS, thereby enhancing the reliability and validity of our study.
Equation (1) for calculating the factor of safety (FOS) in slope stability analysis using numerical analysis is as follows [4], [5]:
![]()
* : Adhesiveness, : Density of Topsoil, : Acceleration of Gravity, : Density of Water, : Internal Friction Angle
The following tasks will be performed in this study:
- Conducting slope stability analysis simulations based on the location of the groundwater table.
- Performing slope stability analysis simulations for slope angles ranging from 10° to 30°.
- Dynamic analysis, which considers infiltration, requires a significant amount of time and accurate data [5]-[6].
* Due to the substantial time consumption in generating appropriate input data and simulations, along with physical time constraints, a static analysis will be conducted.
- Before conducting dynamic analysis, static analysis will be performed to understand the basic principles of slope collapse mechanisms.
- Subsequently, the basic theory will be applied to find ways to maintain the structural integrity of slopes by addressing collapse scenarios that may occur in actual terrain.
2.2. Method for Slope Stability Analysis
Slope stability analysis refers to the calculation of stability concerning slope failure based on shear stress and shear strength. There are three main methods for slope stability analysis, and in this study, we conducted slope stability analysis using the strength reduction method. The advantages and disadvantages of each slope stability analysis method are explained as follows.
2.2.1. Limit Equilibrium Method
The conventional method for slope stability calculation involves defining a sliding surface in advance and dividing the ground within the surface into segments based on the equilibrium of forces in each segment’s limit state to calculate the factor of safety. This method can be computed through classical mathematical equations, but for more accurate calculations, it requires dividing the segments into many parts, making it more suitable for numerical analysis using computers.
2.2.2. Stress Analysis Method
The stress analysis method is similar to the limit equilibrium method in that it calculates the factor of safety based on the ratio of stress and strength generated on the sliding surface. However, it differs from the limit equilibrium method in that it derives the stress state of the sliding surface using the results of finite element analysis, rather than by balancing the forces of each segment. Like the limit equilibrium method, it has the disadvantage of requiring the definition of a failure surface in advance.
2.2.3. Strength Reduction Method
The strength reduction method is developed based on the finite element method that divides the material properties of the ground into the factor of safety and analyzes them, considering cases where failure occurs. Even if the failure surface is not defined in advance, it is possible to calculate the factor of safety, and it is possible to calculate the factor of safety regardless of the arbitrarily generated failure surface. Furthermore, it can analyze even slopes with complex 3-dimensional shapes and can consider reinforcing materials, groundwater, dynamic behavior, etc., making it a recently highlighted analysis method.
However, the Strength Reduction Method tends to have excessively long analysis times compared to the Limit Equilibrium Method, and when applied to dynamic analysis, calculations must be performed for every time step, requiring analysis times in days. However, with recent advancements in computer technology, analysis times have become much shorter, and except for analyzing dynamic behavior, analysis times are not significantly restricted. The strength reduction method is a numerical analysis method that calculates the factor of safety by repeatedly reducing the strength while reaching the slope failure state based on the safety coefficient. By dividing the strength ratio by the factor of safety, as in equations (2) and (3) [7], the shear strength of the soil is gradually reduced, and when the analysis does not converge, it is assumed that the slope has failed with the minimum factor of safety based on the strength reduction at that point [8]-[9].
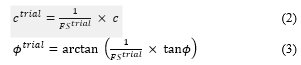
* : Test Safety Factor, , : Adhesive Strength Considering Actual Adhesion and Factor of Safety, , : Internal friction angle considering actual internal friction and factor of safety.
While the Limit Equilibrium Method is straightforward and provides meaningful results, it struggles with complex scenarios and requires the pre-definition of a failure surface. The Stress Analysis Method offers a more detailed analysis through the use of finite element analysis but shares the limitation of needing to pre-define a failure surface.
On the other hand, the Strength Reduction Method does not require a pre-defined failure surface and is more flexible for complex 3D shapes. It provides a comprehensive analysis considering various factors but requires longer computation times, although recent technological advancements have improved this.
In short, simpler slopes may benefit from the Limit Equilibrium or Stress Analysis methods, while more complex situations may warrant the use of the Strength Reduction Method, despite longer analysis times.
2.3. Analysis of pre-existing research on slope stability
Through a review of existing literature, we aim to understand the characteristics of various methods for slope stability analysis by examining domestic and international numerical analysis research cases on slope stability [10].
2.3.1. Particle Finite Element Method (PFEM)
The Particle Finite Element Method (PFEM) has the advantage of being able to handle large deformations as an extension of the traditional Finite Element Method (FEM) [9]. This method simulates the entire evolution of landslides from initiation to deposition, and before applying the PFEM model to real landslides, it examines the collapse mechanism of small landslides on homogeneous soil slopes [4], [11], [12].
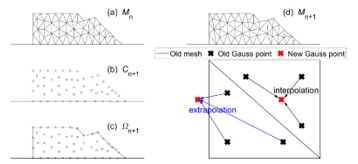
Figure 1: Steps for PFEM technology at time interval [tn, tn+1]
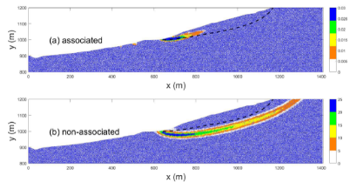
Figure 2: FEM model based on the use of Mohr-Coulomb plastic model
Dynamic analyses of landslides are associated with dynamic processes such as the dynamic behavior of materials and the re-distribution of sliding in the landslide. Several slip surfaces with a critical condition of RF=1.545 identify stages that allow for internal yielding and sliding.
2.3.2. Stress analysis method and strength reduction method.
When comparing the stress analysis method and the strength reduction method, the principle of analysis differs. While the strength reduction method reduces the strength integer until it reaches the failure state, the stress analysis method calculates the shear force and shear strength of the virtual failure plane based on the stress analysis result of the finite element method to calculate the factor of safety [4], [5], [13].
When comparing the advantages and disadvantages of the stress analysis method and the strength reduction method, the strength reduction method has a relatively simple theory and does not require additional programs for interpretation. However, because it requires repetitive numerical analysis, the calculation time for interpretation may be relatively long, and there are some things that could be improved in terms of convergence and accuracy in the state of destruction.
In stress analysis methods, the calculation time for interpretation is relatively short, and the analysis is for the current stress state rather than the state of destruction, so the convergence and accuracy are relatively good. However, an additional stability evaluation program is required.
2.4. Numerical analysis using FEM
In a numerical analysis using FEM for soil analysis, the Mohr-Coulomb and Drucker-Prager models are commonly used, and in particular, the Mohr-Coulomb model is widely used in slope stability analysis. The equation for the Mohr-Coulomb model is shown in equation (4).
![]()
: the internal frictional angle, : the cohesion
The Drucker-Prager yield model is commonly used for soil and rock material modelling.
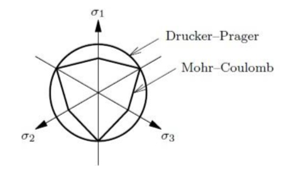
Figure 3: DruKer-Prager and Mohr-Coulomb plastic model & destructive surface by main stress
As can be seen in Figure 3, the Drucker-Prager yield model is a smooth approximation of the yield surface of the Mohr-Coulomb yield model, and the failure surface equation is given by the following equation (5).
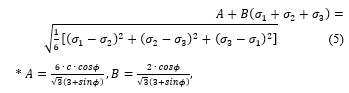
Slope stability analysis using the finite element method provides a numerical analysis method capable of calculating the minimum safety factor of a slope and meticulously analyzing the failure behavior of a slope for various shapes, loads, and boundary conditions. The strength reduction method, in particular, enables automatic simulation of the failure process without requiring prior assumptions about the slope’s failure activity [6].
The safety factor in slope stability analysis, termed the Factor Of Safety (FOS), is calculated through an iterative calculation routine, as depicted in Figure 4 below.
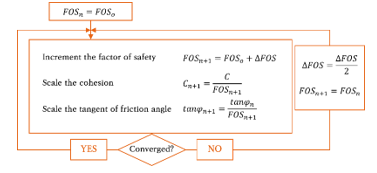
Figure 4: Flowchart of recurring calculations for SRM Method
The algorithm sequence is as follows:
- The primary physical properties of soil and ground, such as cohesion and internal friction angle, are reduced by the currently presumed FOS value.
- The diminished strength (indicated by the red solid line in Figure 5 below) is examined through the Mohr-Coulomb yield surface. If it results in failure, the safety factor is lowered to a value beneath the currently assumed value. If it converges, the process repeats, increasing the safety factor beyond the current safety factor value.
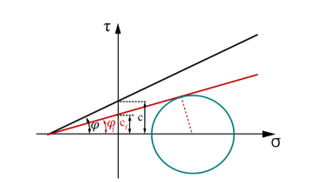
Figure 5: Mohr-Coulomb yield surface after strength reduction
3. Research Method
In order to explore and research the potential of the mesh-free method, the PFEM approach was employed in this study. The dynamic behavior, merging traditional finite element analysis with element-based techniques, was primarily concentrated on simulating shallow deformations of landslides [14]. The behavior of soil materials was delineated, and a variety of soil material simulation models were reviewed and evaluated [15]. All simulations were conducted using the DIANA program [12]. Moreover, the strength reduction method was employed for slope stability analysis in this study.
3.1. FEM Numerical Modelling
To generate data, the basic model is schematically illustrated as follows.
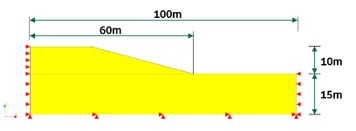
Figure 6: Schematic illustration of the basic model for performing numerical analysis
Based on the analysis of research case studies in existing literature, material properties were assumed to be uniform and the values were adopted from these studies (refer to Table 1). The default position of the water surface was presumed to be inside the slope. Slope stability analysis was conducted under the assumption that the groundwater level was situated 5 meters above ground level and was parallel to the ground level line.
Table 1: Material properties of soil applied to simulation
| Material Properties | Value |
| Young’s modulus | 1,000,000 N/m2 |
| Poisson’s ratio | 0.3 |
| Density | 1814.37 kg/m3 |
| Cohesion | 10,000 N/m2 |
| Friction angle | 20 rad (°) |
| Dilitancy angle | 20 rad (°) |
For the purposes of examining mesh sensitivity, a slope stability analysis was performed under plain strain conditions for 2D analysis, utilizing higher-order elements. These elements have been found to provide a more accurate calculation of the safety factor. In situations where a groundwater level exists, external water pressure should be applied to areas outside the ground surface where water is present. Given that the strength reduction method carries out an analysis of total stress, pore pressure was defined for the submerged area within the ground surface [16].
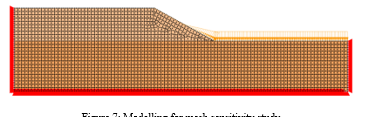
Figure 7: Modelling for mesh sensitivity study
The following is a discussion on the model’s mesh sizes and their implications for the results. The boundary conditions were fixed in both the X and Y directions at the bottom, while only X was constrained on the sides. The analysis was performed using the Strength Reduction Method.
In our mesh sensitivity study, we calculated nine different mesh sizes ranging from 5 m × 5 m to 0.1 m × 0.1 m. It was observed that decreasing the mesh size led to stable convergence of the safety factor values. However, this also resulted in an increase in the analysis time. These findings highlight the impact of mesh size on the accuracy and computational efficiency of our model. Smaller mesh sizes provide more precise results but require additional computational time. Table 2 illustrates the changes in safety factors corresponding to different mesh sizes.
Table 2: Comparison of FOS and time required according to mesh size change
| Mesh size (m) | FOS | Time (min) |
| 5 m × 5 m | 2.5317 | 1 |
| 4 m × 4 m | 2.0125 | 2 |
| 3 m × 3 m | 1.9500 | 2.5 |
| 2 m × 2 m | 1.9500 | 4 |
| 1.4 m × 1.4 m | 1.9500 | 4.5 |
| 1 m × 1 m | 1.9469 | 5 |
| 0.75 m × 0.75 m | 1.95 | 7.5 |
| 0.5 m × 0.5 m | 1.9625 | 10 |
| 0.25 m × 0.25 m | 1.9361 | 35 |
| 0.1 m × 0.1 m | 2.0526 | 255 |
Figure. 8 illustrates that stable values are achieved when using mesh sizes ranging from 2 m × 2 m to 1 m × 1 m. However, when the mesh size is further reduced, unstable values are once again obtained. The most stable result was obtained when utilizing a mesh size of ‘1.4 m × 1.4 m’.
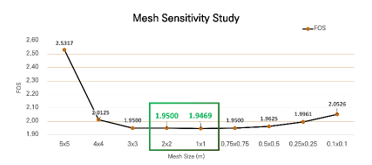
Figure 8: Changes in FOS according to mesh size
4. Analysis of FEM numerical analysis results.
The content presented in this chapter represents a preliminary study aimed at addressing uncertainties regarding the suitability of a 15-degree slope for implementing solar power generation in a production area [17]. The study incorporates variable research involving four factors: angle, water level, water depth, and alterations in material properties. Its purpose is to investigate the influence of these variables on the feasibility of solar power generation installation.
4.1. FEM Numerical Modelling
A total of ten models were analyzed, considering slopes with angles ranging from 10° to 30°. The safety factor was calculated for each slope to assess its stability. The analysis included slopes with and without groundwater to evaluate their respective influences on stability. The material properties employed in the FEM numerical modeling, as described in section 3.1, were consistently utilized for this analysis.
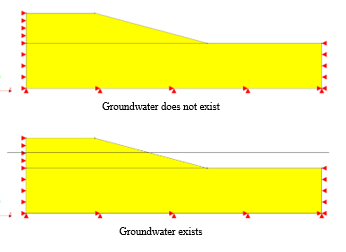
Figure 9: Model and internal deformation according to slope angle change.
To ensure appropriate numerical analysis, all variables except for changes in slope angle and the presence of groundwater used the same values. It was inferred from changes in safety factor that as the slope angle increased, the stability of the slope decreased.
As shown in Table 3, the safety factor was lower when groundwater was present, indicating that groundwater has a negative impact on slope stability. Conversely, when groundwater was absent, it was observed that the stability of the slope was improved.
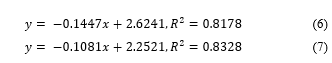
Therefore, the slope safety factor simulation data and linear regression analysis results for both conditions are shown in Figure 10, and the linear trend lines for the change in safety factor are obtained as Equation (6) for the condition without groundwater and Equation (7) for the condition with groundwater.
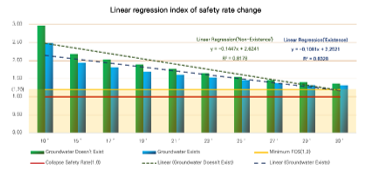
Figure 10: Linear regression index of safety rate change
Table 3: An indicator of the change in safety ratio according to the change in slope angle
Slope angleFOS
| Slope angle | Groundwater Not-Existing | Groundwater Exists | ||
| Change Rate | FOS | Change Rate | ||
| 10 ° | 2.97 | 136% | 2.49 | 128% |
| 15 °(Standard) | 2.19 | (Standard) | 1.95 | (Standard) |
| 17 ° | 2.03 | 93% | 1.81 | 93% |
| 19 ° | 1.89 | 87% | 1.70 | 87% |
| 21 ° | 1.77 | 81% | 1.61 | 83% |
| 23 ° | 1.65 | 75% | 1.54 | 79% |
| 25 ° | 1.55 | 71% | 1.46 | 75% |
| 27 ° | 1.46 | 67% | 1.38 | 71% |
| 29 ° | 1.40 | 64% | 1.33 | 68% |
| 30 ° | 1.37 | 63% | 1.32 | 68% |
4.2. Location of Water
The position of the groundwater was changed to be parallel to the ground surface and parallel to the slope surface, and the safety factor was calculated accordingly.
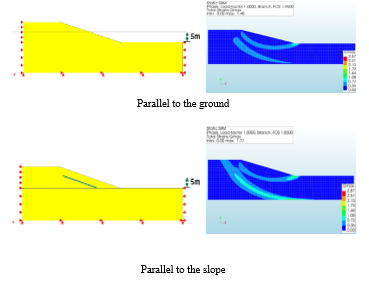
Figure 11: Model and internal deformation according to changes in surface position
The safety factor simulation data for each position of the groundwater level in both conditions can be observed in Figure 12, and Table 4 shows that when the groundwater level was parallel to the ground surface, the safety factor was 0.1 higher (1.95) than in the other condition.
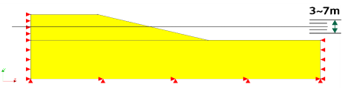
Figure 12: Schematic model for water level changes
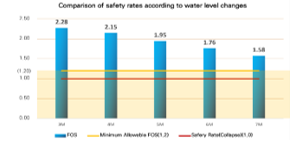
Figure 13: Comparison of safety rates according to water level changes
4.3. Level of Water
The height of the groundwater level was varied (3m, 4m, 5m, 6m, 7m), and a change in the safety factor was observed.
The slope angle was set to 15 degrees, and other material properties were the same as those used in the slope angle variable study. The simulation results showed that the safety decreased as the water level increased, as shown in Figure 14, indicating an inverse relationship between water level and safety.
As the water level increased, the internal deformation rate of the slope increased, which can be confirmed through Table 5.
Table 4: Changes in the safety ratio according to the change in the position of the water surface
| Location of Water (m) | FOS | Change Rate |
| Parallel to the ground | 1.9500 | (Standard) |
| Parallel to the slope | 1.8500 | 95% |
Table 5: Changes in safety and strain according to water level changes
| Level of Water (m) | FOS | Change Rate |
| 3 m | 2.2750 | 117% |
| 4 m | 2.1500 | 110% |
| 5 m | 1.9500 | (Standard) |
| 6 m | 1.7625 | 90% |
| 7 m | 1.5750 | 81% |
4.4. Changes in Material Properties
After setting the slope to 15 degrees, we checked the safety factor using the physical characteristics of the weakest ground in South Korea. These physical characteristics were based on the experimental results from previous literature [12], and we compared the safety factor by considering four types of soil strength (very weak, weak, moderate, and strong).
After incorporating the physical characteristics mentioned above, we simulated the safety factor and obtained results similar to Figure 15. Table 7 provides more detailed information on the variation of safety factors and internal deformation analysis data.
Table 6: Variation of parameters according to changes in soil type for numerical analysis
| Very fragile | Fragile | Common | Solid | Default Opt. | |
| Average | – | ||||
| Modulus of elasticity | 2.025 | 6.75 | 13.95 | 30.6 | 10.197 |
| Cohesion | 0.075 | 0.225 | 0.45 | 0.9 | 0.10197 |
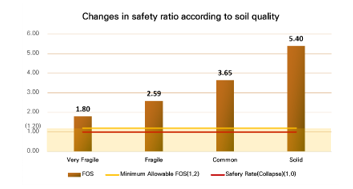
Figure 14: Changes in safety ratio according to soil quality.
Table 7: Safety and strain changes in soil type
| Soil Type | FOS | Change Rate |
| Very fragile | 1.7969 | 49% |
| Fragile | 2.5875 | 71% |
| Common | 3.6500 | (Standard) |
| Solid | 5.3969 | 148% |
5. Conclusion and Suggestion
The study conducted a variable analysis to examine the influence of different factors on mountain slope stability. The results indicated that a decrease in slope angle led to an increase in the safety factor. When the slope angle was changed from 15° to 10°, the safety factor changed by 136%, with a gradual decrease as the angle increased. Moreover, variations in groundwater level had an impact on the safety factor when the slope angle was fixed at 15°. The safety factor was slightly lower when the groundwater level was parallel to the slope compared to when it was parallel to the ground surface, suggesting an increase in infiltration. The study also observed that changes in the water level affected the safety factor. A decrease from 5 m to 3 m resulted in a 17% increase in the safety factor, while an increase to 7 m led to a 19% decrease. Additionally, altering the soil characteristics, specifically the elastic modulus and adhesion, showed notable effects on the safety factor. For instance, when compared to moderate soil, the safety factor decreased by approximately 50% for very weak soil and increased by about 50% for hard soil.
The findings confirm that the safety factor increases with a decrease in slope angle, when the groundwater level is parallel to the ground surface, when the water level is lower, and when the soil possesses higher physical characteristics such as elastic modulus and adhesion. The study suggests that strengthening the criteria for solar panel installation on slopes to account for heavy rainfall is reasonable, as heavy rainfall has been linked to solar panel damage. However, it emphasizes the need for considering various factors rather than solely relying on the slope angle criterion. Factors such as groundwater level, soil characteristics, and precipitation should be taken into account when formulating solar panel installation guidelines.
The study also examined the influence of groundwater orientation on slope safety. The Factor of Safety (FOS) was found to be 1.95 when the groundwater level was parallel to the ground and decreased to 1.85 when parallel to the slope. This represents a 95% change rate compared to the standard scenario, highlighting the significant impact of groundwater orientation on the safety of solar panel installations on slopes.
Although the study assessed safety factors based on slope angle, groundwater level, water level, and soil characteristics, it acknowledged limitations in comprehensively applying each factor and analyzing real-time infiltration rates. The study highlighted the need for further research to establish a more precise engineering basis for the current legal criterion of a slope angle of 15° or less when installing photovoltaic facilities. Future studies should analyze the relationships between various factors, including those explored in this study, and develop models that consider real-time infiltration rates.
Overall, this study aims to contribute to the development of the photovoltaic industry in Korea by providing a foundation for further research and the establishment of accurate legal criteria for slope angles.
Conflict of Interest
The authors declare no conflict of interest.
- K.-I. Chin, “Problem Analysis and Improvement Measures of Rural Area Development for PV Power Plant Project,” KIEAE Journal, 21(5), 83–90, 2021, doi:10.12813/kieae.2021.21.5.083.
- C. Kim, “Strengthen of the gradient permit standard was decided prior to the presentation of the service results of the National Research Institute, and 12 mountain solar power plants that suffered damage due to torrential rain were permitted before the gradient s,” Ministry of Trade, Industry and Energy., 3, 2020.
- J. Manie, “DIANA user’s manual,” TNO DIANA BV, 2009.
- L. Brezzi, E. Carraro, D. Pasa, G. Teza, S. Cola, A. Galgaro, “Post-collapse evolution of a rapid landslide from sequential analysis with FE and SPH-based models,” Geosciences (Switzerland), 11(9), 364, 2021, doi:10.3390/geosciences11090364.
- S.-J.A. Choon-Sik Park, “An Analytical Study on the Slope Safety Factor Considering Various Conditions,” JOURNAL OF THE KOREAN GEOTECHNICAL SOCIETY, 35(5), 31–41, 2019, doi:10.7843/kgs.2019.35.5.31.
- Y.-C. Hsu, Y.-L. Chang, C.-H. Chang, J.-C. Yang, Y.-K. Tung, “Physical-based rainfall-triggered shallow landslide forecasting,” Smart Water, 3(1), 3, 2018, doi:10.1186/s40713-018-0011-8.
- Q.-A. Gian, D.-C. Nguyen, D.-N. Tran, D.-T. Tran, “Monitoring of Landslides in Mountainous Regions based on FEM Modelling and Rain Gauge Measurements,” International Journal of Electrical and Computer Engineering (IJECE), 6(5), 2106, 2016, doi:10.11591/ijece.v6i5.10482.
- S. Ravindran, I. Gratchev, “Prediction of Shallow Rainfall-Induced Landslides Using Shear Strength of Unsaturated Soil,” Indian Geotechnical Journal, 51(4), 661–672, 2021, doi:10.1007/s40098-020-00468-6.
- J.S. Lee, C.G. Song, S.O. Lee, “Analysis of Characteristic of Debris Flow with Angle of Slope,” Journal of the Korean Society of Safety, 31(2), 49–56, 2016, doi:10.14346/JKOSOS.2016.31.2.49.
- J.-Y.K. Joon-Seok Kim, “Study on Characteristics of Numerical Analysis Method for StabilityAnalysis of Reinforced Slope,” Korean Geosynthetics Society, 8(No.3), 17 ~ 23, 2009.
- W.Z. Savage, R.L. Baum, M.M. Morissey, B.P. Ardnt, “Finite-element analysis of the Woodway landslide, Washington,” Geomorphology, 2180(3–4), 9, 2000.
- H.-S. Seo, A Study the Relationship Fofmula of Elastic Modulus and Axcial Stress of clay, Changwon National University, Changwon, 2010.
- J. Si-Yi, L. Hai-Liang, “Disaster Mechanism and Safety Evaluation of Sihong Landslide,” in IOP Conference Series: Earth and Environmental Science, IOP Publishing Ltd, 2021, doi:10.1088/1755-1315/768/1/012061.
- L. Wang, X. Zhang, S. Tinti, “Shallow landslides modeling using a particle finite element model with emphasis on landslide evolution,” Earth Surface Dynamics Discussions, 2019(May), 1–19, 2019, doi:10.5194/esurf-2019-17.
- W.-S. Bae, B.-J. Lee, K.-T. Jang, “Slope Stability Assessment for Colluvial Soil Slumps of the Danyang Region,” Journal of the Korean Society of Safety, 22(3), 74–80, 2007.
- K. Su, “Slope Stability Analysis of Levee,” in IOP Conference Series: Earth and Environmental Science, 2020, doi:10.1088/1755-1315/474/6/062023.
- J.-W.M. Tae-Hyun Kim, Sang-Beom Lee, Hyun-Ju Park, Tae-Hyun Kim, A Study on the Establishment of Environmental Review Guidelines for Solar Power Generation Projects, 2018.