Design and Comparative Analysis of Hybrid Energy Systems for Grid-Connected and Standalone Applications in Tunisia: Case Study of Audiovisual Chain

Adv. Sci. Technol. Eng. Syst. J. 8(3), 144–153 (2023);
 DOI: 10.25046/aj080316
In this research paper, a technical and economic-environmental study was developed to investigate the possibility of establishing various hybrid power systems with different operation modes. Grid-connected and standalone hybrid systems (solar-wind with storage batteries and diesel generators) have been realized in order to carry out a comparative analysis study of two configurations. These systems have been investigated through the Hybrid Multi-Energy Resource Optimization software (HOMER), which calculates pollutant gas emissions, simulates and optimizes energy consumption based on energy demand and resources. As part of the economic analysis, the internal rate of return, the net present value and the payback period were estimated. Both configurations have been developed to meet the power consumption of an audiovisual system. The results obtained show that the first system is the most cost-effective to establish, considering in particular the energy production potential and gas emissions. It can be stated that the proffered grid-connected hybrid system is the most suitable and cost-effective system as it offers several advantage. The total net present cost is $5.425million and the total energy cost is approximately $0.0686 per unit.
1. Introduction
Today the most serious problems of the world are the decrease of fossil fuel reserves, and their elevated price, it is therefore necessary to consider a solution to reduce the use of non-renewable resources and to use sustainable alternative energies like solar and wind energy. Renewable energies have progressively substituted nuclear energy and fossil fuels in four different sectors: power generation, heating plants, transports and stand-alone energy production [1]. This is the case of photovoltaic (PV) and wind energy, worldwide, this sector is growing rapidly [2,3], in particular because of the increasing competition of renewable energies, the rise of electricity demand in developing countries and the benefits of this type of energy in terms of pollution reduction. In this regard, it is important to note that gas, oil and coal are always highly popular fuels for power generation. The effects of these energy sources, as well as the increase in the world’s population and its energy consumption, have had a negative impact on the environment [4,5]. In addition, among the objectives of the Tunisian state is to limit the impact of environmental damage by exploiting the potential of available renewable resources, which will help manage the risk. Considering the previous context, in previous years a growing number of studies have been conducted on hybrid grid-connected and standalone generation systems, by mixing different energy resources such as wind, solar, hydro and generators [6–8]. For this reason, a design and a technical-economic and environmental study has been carried out in the development of various systems of solar-wind hybrid systems that incorporate additional generation sources such as diesel generators. To evaluate the proposed design [9–11], the energy consumption of the building of an audiovisual channel in Tunisia was used as a case study. The novelty of this work is the incorporation of the ecological component as well as the technical and economic aspects in order to achieve a consistent analysis [12], which facilitates decision for the development of energy production strategies based on hybrid systems.
As a developing country, Tunisia has energy supply problems to support its economic growth. 30% of energy should be renewable by 2030, according to the national energy strategy. The development of multi-source energy systems for commercial enterprises is crucial, including energy sources such as photovoltaic, wind [13–15]. Tunis is the capital city, geographically located in the north of Tunisia, the coordinates of its geographical site are 36°49.43’north10°09.27’east (Figure 1).
Therefore, this site is a good place to design a multi-source renewable energy system, especially for an audiovisual television channel with an available surface area of about 10000 m2. In this context, this paper presents a comparative study of two modes micro-renewable energy network [7], in order to choose the right solution to reduce the cost of energy consumption for an audiovisual chain and ensure continuous and regular electricity production.
The paper is based on real project in the Tunisian television, in order to implant a new smart-grid for the Tunisian television, which is a high consumer of energy every year.
Our main objective is to define the optimal sizing based on various configurations, and minimize cost parameters such as, total net present cost (TNPC), cost of energy (COE), and unmet electrical load and CO2 emissions [10] using HOMER software.
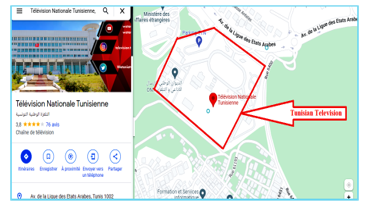
Figure 1: Geographic coordinate of studied area
2. Current Power Supply Architecture
Figure 2 shows that the television is supplied from a medium voltage network (10kV) through six transformers (5ˣ1250kVA and 1ˣ800kVA) connected in parallel; two of them are stand-by. Three diesel generators (3ˣ1390kVA) are used to provide emergency power for certain priority equipment. It is very important to ensure the continuity of broadcasting; in this context four (online) inverters (500kVA and 250 kVA) with a park of batteries (12V and 6V) are used [11].
In this study, two types of loads are defined [8]:
- Sensitive loads, also called critical loads (control rooms, broadcasting center, studios, stage lighting)
- Other/normal loads (air conditioner, offices, lighting, pumps)
3. Methods and Materials
In this research, two configurations of hybrid micro-grid on-grid and standalone were designed and compared in order to find the optimum for an audiovisual chain located in the north of Tunisia (36°49.43’N, 10°09.27’E). The objective of this micro-grid design is to reduce the cost of the company’s electricity consumption and to provide energy supply continuity.
3.1. Introduction to HOMER-pro software
The HOMER-Pro software was developed by NREL, USA. It facilitates the process of designing the most economical microgrid in a distributed energy system. It gives precise and independent results. It also investigates all possible configurations and determines the lowest cost solution by combining several system elements and a storage technology.
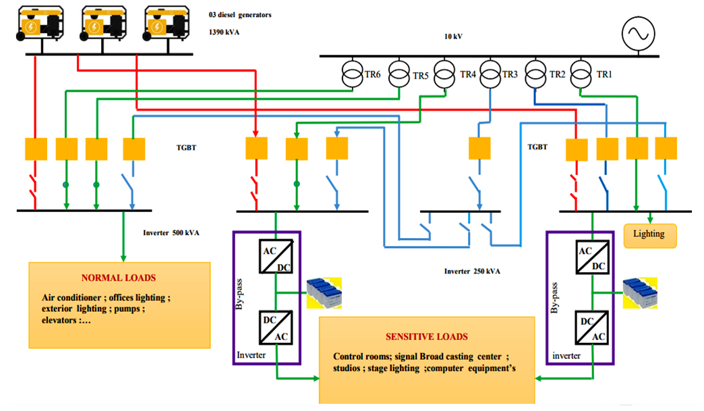
Figure 2: Micro-grid of the power supply and electrical distribution system
Different metrological data are needed to design the hybrid system, in the same way as to describe the possibilities. The workflow in this software is in 3 steps. The process starts with the project input data which includes the load profile, site specific resources and system components, in step 2 HOMER-Pro analyzes the simulation, optimization and sensitive parameters, in step 3 it shows the result which delivers detailed information about the system sizing, performance and financial parameters.
The following Figure 3 presents the diagram of the proposed hybrid energy systems design methodology.
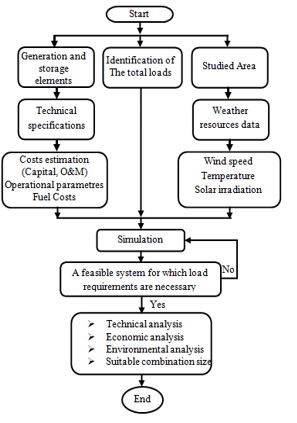
Figure 3: The diagram of the proposed hybrid energy systems design methodology.
In the simulation process, during simulation we define the various system combinations, the number of components needed, the sizes and the dispatch strategy. HOMER-Pro is able to model many system configurations by taking into account any combination of PV panels, hydrogen tanks, wind turbines, hydroelectricity, an electrolyzer, an AC-DC converter and a battery storage. The designed system can be grid-connected or off-grid and can supply different electrical loads. HOMER-Pro analyzes two important aspects: firstly, it evaluates the functionality of the system design and secondly, it determines the life cycle cost of the design, which is the total cost of installation and operation.
The optimization phase defines the most ideal combination, as well as the best configuration that meets the load requirements. In this process, HOMER-Pro simulates different varieties of system configurations, removing those that are not feasible. The feasible configurations are organized according to the lowest net present cost (NPC) and energy cost (COE). This software analyzes different variables to obtain the most feasible configuration for the desired load [16,17]. The decision variables that are analyzed include: generator size, PV module, AC to DC converter, electrolyzer, hydrogen storage tank, number of wind turbines, number of batteries and dispatch strategy.
The software adopts assumptions that affect the design of the system. These assumptions are called sensitivity variables. Sensitivity variables include solar radiation, diesel cost, wind speed, interest rate, grid price, etc. The software finds many combinations of systems which are feasible under some conditions. A sensitivity analysis illustrates the effect of changing inputs on the results [18]. The software is able to analyze multiple sensitive values at once to find the economically suitable result. The software user can include as much sensitivity as desired for the needs of the analysis.
3.2. Energy Potential
In this paragraph, we analyze the wind, solar and ambient temperature resources available in the project area. The ambient temperature and wind values are obtained from the National Institute of Meteorology of Tunisia. The solar radiation is obtained using the HOMER (Hybrid Optimization of Multiple Energy Resources) simulation tool, which is linked to the National Aeronautics and Space Administration (NASA) database.
First, Figure 4 shows the monthly average ambient temperature. The lowest value is indicated in January with 14.5°C and the highest in August with 31.5°C. It is essential to take into consideration the environmental temperature, since it affects the photovoltaic modules’ efficiency and performance, which is best achieved at an operating temperature of 25°C.
Figure 5 shows the average monthly solar radiation of the position of the Tunisian TV channel, where we observe that the minimum radiation is presented in december with 2.09 kWh/m²/day and the maximum radiation is presented in July with 7.31 kWh/m²/day.
Figure 6 presents the monthly average wind speed, where it can be seen that the minimum speed is presented in August with 4.950 m/s and the maximum speed is presented in February with 7.07 m/s.
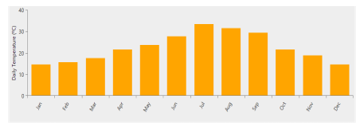
Figure 4: The monthly average of the ambient temperature
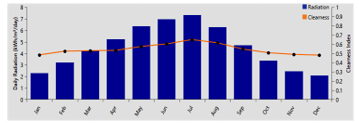
Figure 5: The monthly solar radiation
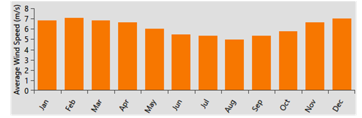
Figure 6: The monthly average wind speed
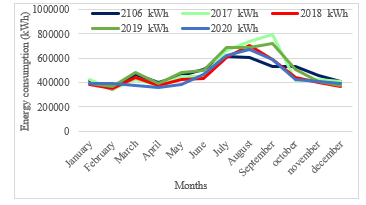
Figure 7: Monthly energy consumption in recent years
3.3. Load profile
Based on Figure 7 and Figure 8, in Tunisian television the average monthly consumption in the years (2016-2017-2018-2019-2020) is a function of production emissions during three distinct seasons: winter, summer and the month of Ramadan. Monthly consumption is almost the same during the months of
October to May (an average consumption of 400,000 kWh per month), then a slight increase (20%) in the month of Ramadan (June) and finally three months of high consumption (June-July-August), about 35% of total annual consumption (air conditioning). It was seen that the peak is about 1442 kW and with an average of 626 kW [7], [10].
The investigated area is located in the north of Tunisia; its geographical site co-ordinate is located at 36°49.43’north10°09.27’east). Consequently, this site is an appropriate place to design a grid connected multisource energy renewable system, especially for an audiovisual television chain.
The options of hybrid systems proposed in this work were designed for energy consumption in broadcasting building of the Tunisian television during 2020. The two hybrid systems were designed for a load of 15000kWh/d. The electrical load profile is shown in Figure 8.
To study the performance of the system over the course of a year, HOMER uses the daily load profile illustrated in Figure 9. The load profile is variable on various days and times due to seasonal and regional time changes for more efficient electricity consumption. The load variations during seasonal changes, and the minimum and maximum loads recorded are illustrated.
4. System description and simulation models
Using HOMER, two models of hybrid system have been established: grid-connected hybrid system and off-grid hybrid system.
Figure 10 illustrates the concept of a grid-connected hybrid system, which includes wind turbines, photovoltaic panels, loads, and inverter, with a diesel generator and a park of batteries that are used to maintain the system in its off-grid state. Figure 11 shows the same concept, but a standalone configuration.
The HOMER simulation software gives the possibility of entering the various electrical components that will have to be used for the device to be effective and which automatically carry out all the possible configurations, taking into account only those that satisfy the required load.
To maximize system performance in various situations, HOMER simulates the configurations listed below with the same loads in the same region based on various costs such as estimated installation cost, operation and maintenance cost, replacement cost, interest rates and energy cost, as well as the analysis of pollutant emissions.
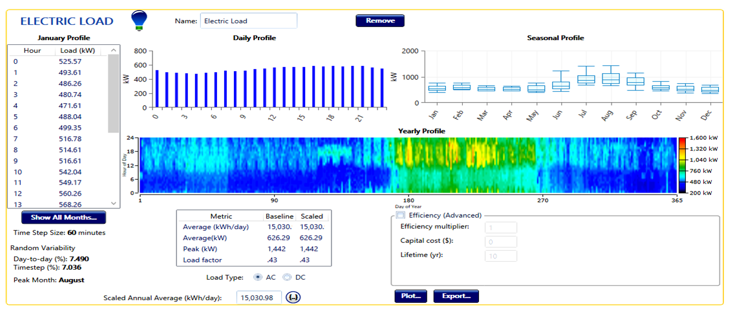
Figure 8: Load profile of audiovisual chain.
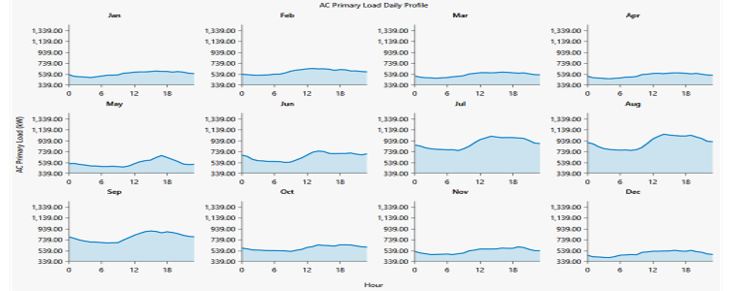
Figure 9: load profile of the studied area
The Figures 10 and 11 are the studied models in this paper which are developed to replace the current power supply configuration illustrated in Figure 2, with the integration of new renewable energy sources.
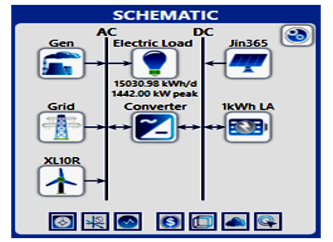
Figure 10: Grid-connected Hybrid System
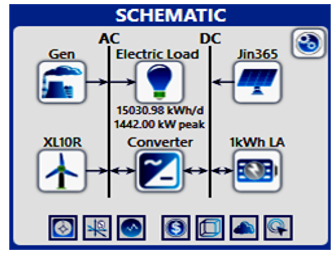
Figure 11: The Standalone Hybrid System.
So, our main task is to design and investigate a new smart-grid based on renewable energy for energy supply of the Tunisian television.
4.1. Wind Turbine
Wind turbine converts the kinetic energy of the wind into AC or DC electricity for particular power curve. The power curve is a graph between power output and wind speed.
Bergey wind power’s Excel 10-R model with hub height (30 m) is considered. It has a rated capacity of 10 kW and provides (AC) voltage as an output. The cost of one unit is considered ($15000) while replacement and maintenance costs are taken as ($13500) and ($150/year)
![]()
where:
V: the wind speed in m/s,
S: rotor swept area in m2,
ղ1: generator efficiency,
Cp: maximum power coefficient,
ρ: air density in kg/m3,
4.2. Solar PV panel
HOMER-Pro develops a PV module that produces DC electricity when the solar radiation incident upon it. It is best to choose a solar panel when the price of diesel fuel is high and wind speeds are low. The capital cost of a 1kW solar panel is approximately$600; the replacement and operating costs are $600 and $10, respectively. The service life of the PV system is 25 years.
![]()
where,
CPV: PV rating factor.
PPV : PV array rated capacity (kW).
IT: Solar radiation values that strikes on the surface of the PV Array (kW/m2).
IS: Standard radiation value, 1kW/m2.
4.3. Diesel Generator project
Diesel generator is used as alternative power sources when there is no access to the grid or interruption of electrical power. Diesel generator is also preferred as backup power, ensuring a robust energy supply. Generator cost is determined for 1kW output power. The capital cost is $ 300, the replacement cost is 270$, O&M cost is 0.03($/op. hour) and the lifetime is 15000 hours [4,5]. The fuel consumption per hour of a diesel-fueled diesel generator is calculated by Equation2
![]()
where,
F: the fuel consumption rate (L/hr.)
Fo: the fuel curve intercept coefficient (L/hr/kW),
F1: the fuel curve slope (L/hr/kW),
Ygen: the rated capacity of the generator (kW),
4.4. Battery Storage Bank
For a certain hour, the surplus power produced by the hybrid system can be used to charge the batteries, while the stored energy can be discharged at any time when there is a power deficit.
The battery considered is a generic 12v lead acid battery with 1kwh of energy storage. The estimated lifetime is (5 years) and the cost of one battery is ($250) with a replacement cost of ($250) while the maintenance cost is estimated at ($5/year).
![]()
where,
EL is the average daily load energy (kWh/day),
AD is daily autonomy of the battery,
DOD is battery depth of discharge,
ղinv and ղbatt respectively, represent the inverter and battery efficiency.
4.5. Converter
The energy feed between the AC bus and the DC bus within the microgrid is realized by a bidirectional power converter according to the production, consumption, and storage energy conditions of the micro grid. Converter cost is determined for 1kW output power. The capital cost is 200$, the replacement cost is 180$, O&M cost is 5$ and the life expectancy is 15 years [5–7]. The efficiency of the converter connected to two bus bars is taken as 95%.The inverter changes the DC current at the output of the photovoltaic system and battery to supply the electrical load, which by its nature is alternating current. The design is kept to supply the load 24 hours a day, 7 days a week without any disruption in the power supply due to the uncertain nature of solar and wind generation.
5. Economic analysis
Net Present Cost (NPC): The NPC is the cost of installing and operating of the system over its lifetime which is calculated with the following formula [18,19].
![]()
TAnn, cost: It is the sum of the annualized costs of each component of the power system, including capital, operating and maintenance costs. It also includes the replacement cost and the cost of fuel.
j: Interest rate in percentage
Rproject: lifetime in year
CRF: Capital recovery factor is a ratio which is used to calculate the present value of a series of equal annual cash flow.
![]()
where,
j: Interest rate in percentage
n: number of years
The cost of energy is calculated by the following formula
![]()
TAnn, cost: Total annualized cost
Eprimary: No of primary load
Edef: No of deferrable load
6. Optimization and Simulation Results
The supply of a load of 15,030.98kWh/d with a peak value of 1442kW was studied in 2 scenarios. In the first scenario, the power demand was provided by a grid-connected microgrid and in the second scenario by standalone microgrid. For both scenarios, PV, wind turbines, diesel generator and a battery park were used.
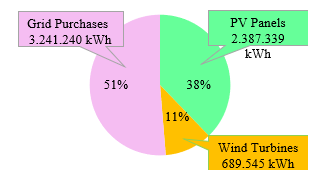
Figure 12: Energy Production summary
6.1. Grid- connected configuration
In this part, the simulation results of grid-connected installations are calculated for different configurations using HOMER. The main energy source is the photovoltaic. In case of lack of energy from PV panels and wind turbines, the electrical
Table 1: Categorized optimization results
| Architecture | Cost | |||||||||
| PV
(kW) |
Wind
turbine |
Diesel generator (kW) | Batteries
|
Grid
(kW) |
Inverter
(kW) |
NPC
($) |
COE
($) |
Operating Cost ($/yr) | Initial capital ($) | Renewable fraction
(%) |
| 1 ,667 | 30 | 300 | 999.999 | 1000 | 5.43M | 0.0686 | 285,183 | 1.74M | 47 | |
| 1,708 | 300 | 999.999 | 1000 | 5.47M | 0.0712 | 321,218 | 1.32M | 37.6 | ||
| 1 ,667 | 30 | 1600 | 300 | 999.999 | 1000 | 5.81M | 0.0734 | 277,318 | 2.22M | 47.0 |
| 1,708 | 1600 | 300 | 999.999 | 1000 | 5.85M | 0.0761 | 313,413 | 1.80M | 37.6 | |
| 30 | 300 | 999.999 | 1000 | 6.15M | 0.0867 | 418,215 | 740,000 | 12.6 | ||
| 300 | 999.999 | 1000 | 6.30M | 0.0888 | 464,519 | 290,000 | 0.00372 | |||
| 30 | 1600 | 300 | 999.999 | 1000 | 6.53M | 0.0920 | 410,410 | 1.2M | 12.6 | |
| 1600 | 300 | 999.999 | 1000 | 6.67M | 0.0941 | 456,714 | 770,000 | 0.0372 | ||
grid, the battery storage system and the diesel generator are used as auxiliary energy sources.
Monthly average electrical power generatedby each of the hybrid system elements is illustrated in figure12, it is clear that the most important quantity of energy is givenfrom the grid (51.3 %) whereasphotovoltaic generate only 37.8% of overal energy and wind turbine produce about 10.9%. The photovoltaic energy production is 2.387.339 kWh/yr and the wind turbines energy production is 689.545kWh/yr.
As shown in Table 1, in current simulation of the designed micro-grid, the optimized results demonstrates that the cost of energy have the minimum value COE of $0.0686/kWh.
Table 2 indicates that pollutant emissions like carbon dioxide, carbon monoxide, and sulfur dioxide are significantly decreased by using the grid-connected hybrid system.
Table 2: Quantity of emission produces by different pollutants
| Quantity | Value (kg/yr) |
| Carbon Dioxide | 2.055.538 |
| Carbon Monoxide | 0 |
| Unburned Hydrocarbons | 0 |
| Particulate Matter | 0 |
| Sulfur Dioxide | 8.912 |
| Nitrogen Oxides | 4.358 |
According to Table 3, 89.7% of the electricity produced by the renewable system is sent to the AC grid and 10.3% is sold to the grid at specified selling price.
Table 3: Energy consumption summary
| component | Consumption kWh/yr | Percentage |
| AC Primary Load | 5.486.307 | 89.7 |
| Grid Sales | 633.321 | 10.3 |
| Total | 6.119.628 | 100 |
According to Figure 13 in this micro grid, 48.7% of the total energy is generated from renewable sources. All of this generation is delivered right into the load. The proportion of renewable sources energy directly used by the load is 47%. Thus, 1.16% of the total energy, generation during a year are excess energy confirming to the results of simulation.
Figure 14 illustrates the results of the microgrid evaluation in terms of capital costs and operation and maintenance costs. The PV array system represents the largest capital cost, therefore the grid represents the highest operation and maintenance cost Based on this estimation, the hybrid project will have approximately a $5.425 million cost over its operating lifetime In Figure 15, we observe the cumulative cash flow of this system over the life of the project, as shown in the curve over 25 years, there are significant changes between the initial system and. the proposed system, there is a large decrease in term of cash flow of the final system.
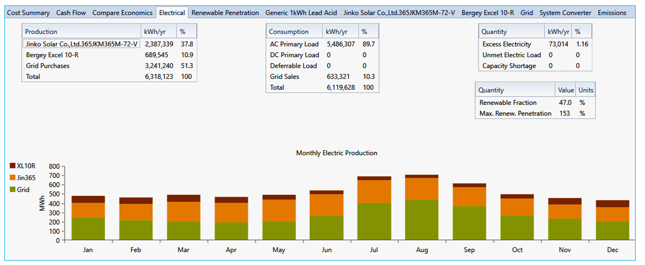
Figure 13: Production and consumption of electricity
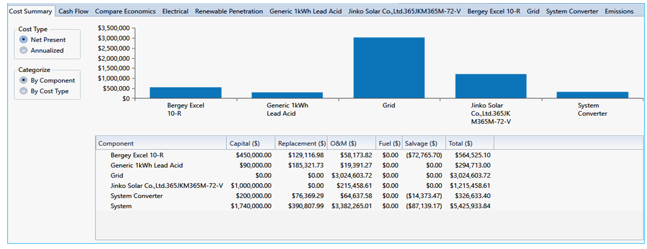
Figure 14: Cost status of the system
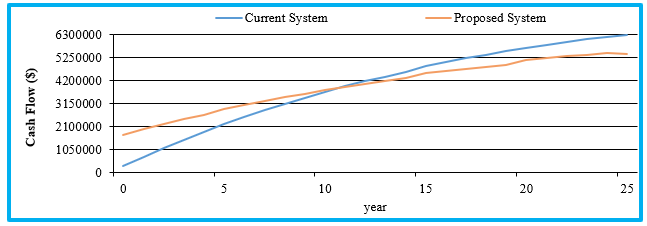
Figure 15: Cumulative cash flow over project lifetime
6.2. Off-Grid configuration
In this section, the simulation results of the different stand-alone combinations are calculated for the various configurations using HOMER. The two main energy sources are photovoltaic and wind turbine. In case of lack of energy from the photovoltaic panels and wind turbines, the diesel generator is used as a complementary energy source, as well as the battery storage system which is used in case of lack of power to ensure the continuity of the TV chain.
Monthly average electrical power generatedby each of the hybrid system elements is illustrated in figure16, it is clear that the most important quantity of energy is givenfrom the diesel generator (49.2 %) whereasphotovoltaic generate only 30.5% of overal energy and wind turbine produce about 20.3%. The photovoltaic energy production is 2.283.006 kWh/yr, the wind turbines energy production is 1.522.149kWh/yr and an energy production of 3.688.661 kWh/yr from the diesel generator.
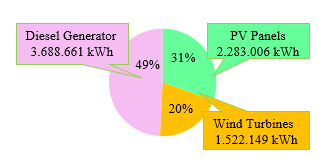
Figure16: Energy Production summary
As shown in Table 4, in current simulation of the designed micro-grid, the optimized results demonstrates that 1505kW of photovoltaic panels and 58 wind turbines of 10kWare used the cost of energy COE is $0.258/kWh.
Table 4: Categorized optimization results
| Architecture | Cost | ||||||||
| PV
(kW) |
Wind
turbine |
Diesel generator (kW) | Batteries
|
Inverter
(kW) |
NPC
($) |
COE
($) |
Operating Cost ($/yr) | Initial capital ($) | Renewable fraction
(%) |
| 1,505 | 58 | 1,600 | 1,200 | 500 | 18.3M | 0.258 | 1.21M | 2.68M | 32.8 |
| 270 | 40 | 1.600 | 160 | 18.4M | 0.260 | 1.33M | 1.27M | 15.9 | |
| 40 | 1.600 | 18.5M | 0.261 | 1.35M | 1.08M | 12.2 | |||
| 40 | 1.600 | 4 | 1.30 | 18.5M | 0.261 | 1.35M | 1.08M | 12.2 | |
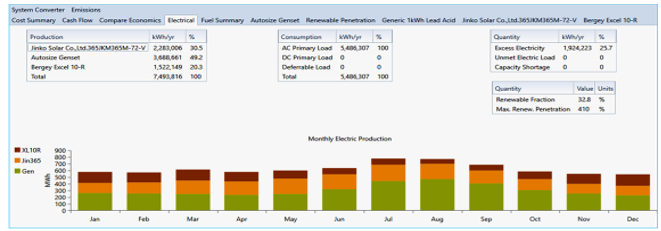
Figure 17: Production and consumption of electricity
In this microgrid, 50.8% of the total energy is produced from renewable sources. All of this generation is delivered directly to the load. According to Figure 17, the proportion of energy from renewable sources directly used by the load is 32.8%. Thus, 100% of the electricity generated by the renewable system is sent to the AC grid and 25.7% of the total energy production during a year is surplus energy confirming the simulation results.
Table 5 illustrates that pollutant emissions such as carbon dioxide, carbon monoxide, unburned hydrocarbons, nitrogen oxides and sulfur dioxide are significantly increased by the use of the stand-alone hybrid system.
Table 5: Quantity of emission produces by different pollutants
| Quantity | Value (kg/yr) |
| Carbon Dioxide | 2.779.450 |
| Carbon Monoxide | 17.646 |
| Unburned Hydrocarbons | 770 |
| Particulate Matter | 107 |
| Sulfur Dioxide | 6.855 |
| Nitrogen Oxides | 16.577 |
Figure 18 demonstrates the cost status of the off grid hybrid system during its project lifetime. Table 4 shows the results of the evaluation of the isolated micro grid in terms of investment costs and operation and maintenance costs. The renewable energy system (photovoltaic and wind) represents the high investment cost, therefore the diesel generator represents the highest operation and maintenance cost. Based on this estimate, the hybrid project will have a lifetime cost of approximately $18.30 million.
In Figure 19 we can see the cumulative cash flow of this system over the project live time, as seen on the curve during 25 years there is no significant change between the based system and the proposed system.
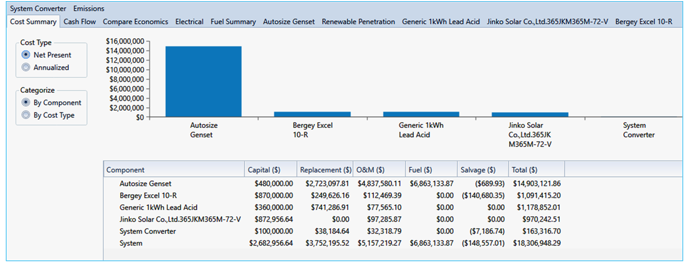
Figure 18: Cost status of the system
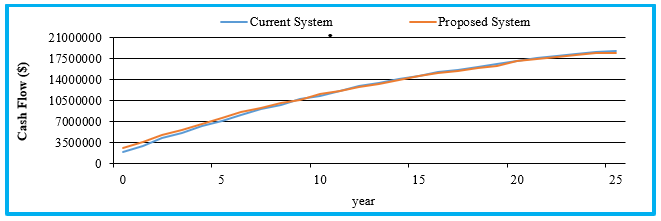
Figure 19: Cumulative cash flow over project lifetime
7. Conclusion
This working study is a comparative study between off-grid and a grid-connected hybrid electrical system with different modes of operations for an audiovisual chain. The results obtained with the HOMER-pro software show a detailed cost analysis structure, cash flow overview, and energy production yield of the proposed hybrid configuration.
An analysis of the situation was carried out in the Tunisian television chain. The study was conducted taking into account energy use, climatic conditions, current prices for all components and accessible areas within the study area. The optimization results show that the on-grid hybrid system is more efficient and cost-effective than the off-grid hybrid system with the same load.
According to the results of the simulation, it can be observed that of the on-grid hybrid system is the most sustainable hybrid system configuration with the lowest NPC and COE. The total net present cost is $5.425million and the total energy cost is approximately $0.0686 per unit. From the simulation results it is clear that the grid-connected configuration is optimal.
Acknowledgment
This work was supported by the Tunisian Ministry of High Education and Research under Grant LR 11ES15.
- G. Zhang, C. Xiao, N. Razmjooy, “Optimal operational strategy of hybrid PV/wind renewable energy system using homer: a case study,” International Journal of Ambient Energy, 43(1), 3953–3966, 2022, doi:10.1080/01430750.2020.1861087.
- İ. Çetinbaş, B. Tamyurek, M.D. Of, “Design, analysis and optimization of a hybrid microgrid system using HOMER software: Eskisehir osmangazi university example,” Int. Journal of Renewable Energy Development (IJRED), 8(1), 65–79, 2019, doi:10.14710/ijred.8.1.65-79.
- M. Usman, M. Khan, A. Rana, S.A. And, “Techno-economic analysis of hybrid solar-diesel-grid connected power generation system,” Journal of Electrical Systems and Information Technology, 2017, doi:http://dx.doi.org/10.1016/j.jesit.2017.06.002.
- D. Nachtigall, “Improving Economic Efficiency and Climate Mitigation Outcomes through International Co-ordination on Carbon Pricing-Environment Working Paper No. 147,” 2019.
- L. Oliveros-Cano, J. Salgado-Meza, C. Robles-Algarín, “Technical-economic-environmental analysis for the implementation of hybrid energy systems,” International Journal of Energy Economics and Policy, 10(1), 57–64, 2020, doi:10.32479/ijeep.8473.
- F. Rinaldi, F. Moghaddampoor, B. Najafi, R. Marchesi, “Economic feasibility analysis and optimization of hybrid renewable energy systems for rural electrification in Peru,” Clean Technologies and Environmental Policy, 23(3), 731–748, 2021, doi:10.1007/S10098-020-01906-Y.
- A.C. Duman, Ö. Güler, “Techno-economic analysis of off-grid PV/wind/fuel cell hybrid system combinations with a comparison of regularly and seasonally occupied households,” Sustainable Cities and Society, 42, 107–126, 2018, doi:10.1016/j.scs.2018.06.029.
- S. Mohamed, C. Habib, H. Othman, B. Jamel, “Comparative Analysis of Hybrid Systems for on-grid and off-grid Applications in Tunisia: case study of Audiovisual chain,” in 5th International Conference on Advanced Systems and Emergent Technologies, IC_ASET, 450–455, 2022, doi:10.1109/IC_ASET53395.2022.9765947.
- S. Goyal, S. Mishra, A.B. And, “A comparative approach between different optimize result in hybrid energy system using HOMER,” International Journal of Electrical and Computer Engineering (IJECE), 9(1), 141–147, 2019, doi:10.11591/ijece.v9i1.
- K. Ritu, A. Wadhwani, A.R., “Techno-Economic Comparison of on Grid and off Grid Hybrid WT/Solar Photo Voltaic Connected Power Generating Unit Using HOMER,” in International Conference on Advanced Computation and Telecommunication (ICACAT), 2018, doi:10.1109/ICACAT.2018.8933685.
- S. Mohamed, C. Habib, H. Othman, B. Jamel, “Electrical Distribution Architecture and Load Curves Analysis of Audiovisual System,” in 2021 IEEE 2nd International Conference on Signal, Control and Communication (SCC). IEEE, 25–30, 2023, doi:https://dx.doi.org/10.1109/SCC53769.2021.9768369.
- H.S.A.-E. Mageed, “Cost analysis and optimal sizing of PV-Diesel hybrid energy systems,” in American Journal of Renewable and Sustainable Energy, 47–55, 2018.
- I. Tizgui, F. El Guezar, H. Bouzahir, A.N. Vargas, “Estimation and analysis of wind electricity production cost in Morocco,” in zbw.eu, 58–66, 2018.
- A. Said, A. Busaidi, H.A. Kazem, A.H. Al-Badi, M. Farooq Khan, “A review of optimum sizing of hybrid PV–Wind renewable energy systems in oman,” International Journal of Students Research in Technology & Management, 2(3), 93–102, 2015, doi:10.1016/j.rser.2015.08.039.
- A.S. Almashakbeh, A.A. Arfoa, E.S. Hrayshat, “Techno-economic evaluation of an off-grid hybrid PV-wind-diesel-battery system with various scenarios of system’s renewable energy fraction,” Energy Sources, Part A: Recovery, Utilization and Environmental Effects, 2019, doi:10.1080/15567036.2019.1673515.
- R.T.A. Al-Rubaye, A.T.A. Al-Rubaye, M.M. Al-Khuzaie, “Optimal Design of Hybrid Renewable Energy System off grid in Al-Diwaniyah, Iraq,” IOP Conference Series: Materials Science and Engineering, 454(1), 2018, doi:10.1088/1757-899X/454/1/012103.
- M. Kamran, M. Mudassar, M. Rayyan Fazal, R. Asghar, S. Rukh Ahmed, M. Irfan Abid, M. Usman Asghar, M. Zunair Zameer, C. Author, “Designing and optimization of stand-alone hybrid renewable energy system for rural areas of Punjab, Pakistan,” Researchgate.Net, 8(4), 2018.
- A. Al-Sharafi, A. Sahin, T. Ayar, S. Bekir, “Techno-economic analysis and optimization of solar and wind energy systems for power generation and hydrogen production in Saudi Arabia,” Renewable and Sustainable Energy Reviews, 69, 33–49, 2017, doi:https://doi.org/10.1016/j.rser.2016.11.157.
- H. Taghavifar, Z.S. Zomorodian, “Techno-economic viability of on grid micro-hybrid PV/wind/Gen system for an educational building in Iran,” Renewable and Sustainable Energy Reviews, 143, 110877, 2021.