Accuracy Improvement-Based Wireless Sensor Estimation Technique with Machine Learning Algorithms for Volume Estimation on the Sealed Box

Adv. Sci. Technol. Eng. Syst. J. 8(3), 108–117 (2023);
 DOI: 10.25046/aj080313
Currently, the quality and quantity of product must be inspected before transporting. Currently the popular unsealing box product inspecting is performed by weighing the box where the errors occur according to the tolerance of the weighting machine and tolerance weight of the product. On the other hand, the quantity of product can be inspected automatically using the image processing and recognition where the sealed box needs to be unpacked which is difficult to be implemented in practice. Then, the error in product transportation causes a loss profit of for the vendor and losing the reliability from customers. In this paper, we proposed a new volume estimation technique to estimate the product quantity in the sealed box using RSSI with machine learning for improving the monitoring accuracy. The proposed system includes one transmitter on the top and five receivers at bottom of the package. Based on practical environment, we align the product’s pattern inside the boxed package into two cases including horizontal/vertical aligned pattern and random pattern. In the experiment, we compare the volume estimation accuracy of five machine learning techniques including linear regression, logistic regression, Naïve Bayes, KNN, and NN. From the results, the NN method provide the highest volume estimation accuracy among others and consumes the shortest estimation time. NN presents accuracy as 99.4% and consumes 6.51 milliseconds of estimation time. Moreover, for protecting the products from the delivery process, shockproof material must be put to cover the product in the box. Three shockproof types are considered in our experiment such as bubble wrap, paper, and airbag and our proposed system is considered all kinds of shockproof situations. The suggested method can estimate the volume of products without necessitating their opening or destruction. The suggested approach is also resistant to the impacts of packaging cushioning material.
1. Introduction
To the COVID-19 situation, the number of online purchases worldwide are grown up to 5.2 trillion US dollars and will reach 8.2 trillion US dollars in 2026. Figure 1 shows the rising trend of online marketing sales [1-3]. In Thailand, online shopping orders have increased by an average of 45% per year and they will rise with the rate steadily [4-5]. According to the new commodity trading behavior, customers order the products via online platform and the traders stag the products before sending to the customers. Once the number of orders is high, the error easily happens. Therefore, the bounce rate increased from approximately 8% in 2007 to 22% in 2017 and is anticipated to continue rising [6-8]. One of the reasons to return products is the incorrect number of product or a mismatch with the user order. Therefore, the monitoring quantity of the product inside the package before sending it to the customer is an important part of quality control and inspection to prevent mistakes and the associated expenses. There is a requirement for varying quantities of merchandise since the behavioral characteristics of each transaction are distinct. Even though the contents of the parcel are the same, the number of objects in each parcel box will vary.
The entrepreneurs must verify their own cargo before delivering it to the carrier by implementing a quantity verification inspection procedure at the end. However, human error may occur if this strategy is used. In addition to losing energy, manufacturing delays may also result. Therefore, technology has been developed to assist with this verification.
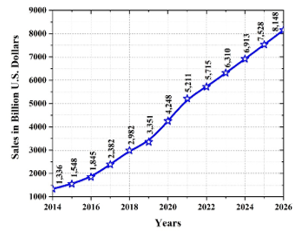
Figure 1: The ongoing expansion of internet shopping in 2014 – 2026.
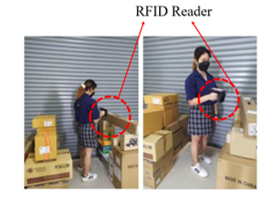
Figure 2: RFID reader and RFID tag.
The number of products can be verified via many solutions such as directly counting by humans, image processing and recognition, RFID technology or calculate from the volume estimation methods. RFID scheme is one of the common methods used in worldwide. The RFID tag is attached to the products and used to count the number of products within the package. This approach is regarded as used with certain items; however, it cannot be used for some products such as water, seeds or many overlapping products because the RFID tag gets obscured, leading to measurement inaccuracies. In addition, this method is expensive due to the high cost of the RFID reader and the requirement to purchase RFID tags as the number of products. Figure 2 demonstrates an example of an RFID system [9-10]. Another technique is a weight meter. For the industry scale, the high-resolution weight meter is used for a quantity verification inspection procedure at the end that provides a high level of precision, but it is a premium cost that the high-resolution weight meter shows in Figure 3. For local commercial scales, the general weight meter is commonly used because this meter has low complexity and cost. However, this method has important restrictions the size of the items cannot exceed the scale’s capacity, and it requires calibration and maintenance from the specialist inspector. Moreover, some products may have the same weights, but different volumes. Then, the only weight meter method may not be appropriate to check the number of products. On the other hand, if the volume of products can be calculated, the number of products can be exactly determined. Therefore, volume estimation should consider for estimating the number of products.
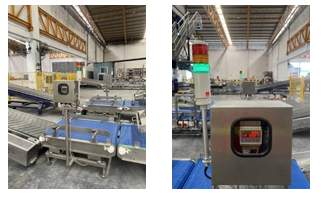
Figure 3: The inspector weighting machine.
Image-based volume estimation [11-12] is widely used in many researches. This method utilizes image processing techniques with image recognition to estimate the volume of an product. It requires to capture photographs from a variety of perspectives as well as adjust the lighting and clarity of the images. This method necessitates a visual inspection of the object to compute the volume, i.e., the package box must be opened. Consequently, image-based volume estimation method is unsuitable for determining the number of products already packed into a package.
Nowadays, the wireless sensors that operate on WI-FI technologies are unquestionably the most popular and frequently utilized today. It is a technology that is easily accessible and widespread. There are several uses of wireless sensor, such as applications for identifying the position of people or objects in indoor and outdoor environments [13-16], estimation of a person’s posture inside a room [17-18], etc. There are several popular techniques for estimating the positions of objects, including the received signal strength indicator (RSSI), the time-of-arrival (TOA), the time difference of arrival (TDOA), and the angle of arrival (AOA) [19-24]. Each method has the unique advantages and disadvantages, including varying degrees of complexity, the precision accuracy, or the energy consumption. Due to its simplicity and low complexity, the RSSI method is the most utilized. The transmitter and receiver are the primary devices used to measure RSSI. The RSSI value delivered from the transmitter to the receiver will vary based on the environment, considering either the distance between the transmitter and receiver or the thickness of objects that obstruct the signal between the transmitter and receiver. These variations in RSSI readings can be utilized to estimate the position of a person or item [25-27]. From the RSSI measurement concept, we apply the RSSI value to estimate the volume of product in the sealed package for verified the quantities of merchandise.
In [28], we proposed the volume estimation method in the sealed package by applying the RSSI measurement. The proposed system installs 1 transmitter and 4 receivers to measure the RSSI value for improving the volume estimation accuracy by utilizing 4 machine learning algorithms including linear regression, logistic regression, Naïve Bayes, and K-nearest neighbors (KNN). From the experimental results, we found that the KNN method presented the highest volume estimation accuracy at 94%. However, regarding the arrangement of objects in the parcel box, only the horizontal arrangement was evaluated in this work. In the practical transit of packages, objects can be arranged in a variety of patterns. In addition, shockproof materials are normally put on the products for protecting it from damage in the delivery process. There are several types of cushioning materials; therefore, the performance and precision of the proposed volume estimation technique must consider the effect of the type of cushioning materials on the RSSI value.
In this paper, an RSSI measurement of wireless sensor and machine learning analysis-based system for estimating the product quantity under three types of sealed packages is presented. According to the RSSI characteristic, the signal is transmitted from the transmitter and the received signal is received by the receiver. Once the received signal strength is attenuated by the object which obstructs the transmission path, then we can utilize the received signal strength for estimating the amount of object in the sealed box without unpacking the box. We also evaluated the quantity of equipment, the number of products, and consider all of pattern of packed inside the package box in all instances. Four protection environments are considered including no cushioning material and the three commonly used cushioning materials: bubble wrap, paper, and airbags. For improving the accuracy, we apply five machine learning (ML) approaches, including linear regression, logistic regression, Naïve Bayes, KNN, and neural network (NN) for estimation of the volume of items in the material box. Based on the results of the experiment, the ML approach could be used to estimate the real volume of products with efficiency and precision. The provided system estimated the product with an accuracy of 99.40% using the NN method. However, the disadvantage is the long training time. On the other hand, the logistic regression is not appropriate to be implemented in volume estimation since it presents the lowest accuracy and consumes long estimation time. Regarding the optimal number of devices, it was determined that one transmitter and five receivers supported the greatest probability of placement. In calculating the number of items, the proposed system will be able to support the packaging of products in the absence of cushioning materials and with all three types of cushioning objects.
2. The Related Knowledge
In this section, we describe the RSSI calculation concept and five well-known ML methods. The considered ML methods are very popular on many applications and appropriate for the characteristic of RSSI data.
2.1. The Received Signal Strength Indicator (RSSI)
RSSI collecting techniques are utilized for a variety of different environments, including indoor or outdoor positioning systems, and determining distances based on RSSI measurements. In addition [29-32], the RSSI value has a low level of complexity and a short time to store the data, allowing low-cost and widely available storage devices to be utilized. Identifying the position of a person or object is an example of an application that uses the RSSI value to compute distance using the RSSI’s distance measurement equation. The equation for computing the distance measurement from the RSSI level is shown in (1).
![]()
where is the signal’s strength (W) and is the RSSI value (dBm). Typically, the RSSI will fluctuate as the distance between the transmitter and receiver changes or when barriers are present.
2.2. Machine learning technology
Machine learning is an intelligent system capable of analyzing data to propose or predict outputs to assist in decision-making. As the system accumulates more data, machine learning can help it make better decisions. This research utilizes linear regression, multinomial logistic regression, Naïve Bayes, KNN, and NN. Following is a detailed discussion of each technique.
2.2.1. Linear regression
Regression analysis is the application of machine learning where the prediction line of the learning model is generated by fitting the linear equation with the data. To estimate the output value, the new data is fed to the learning model which predict the output value from the generated prediction line. This technique is straightforward and efficient for studying linear data. It present a high degree of precision, then the linear regression equation is shown in (2).
![]()
where is the desired output, is the slope of the linear line of data, is the input feature, and is the constant.
The mean square error (MSE) approach is applied as the cost function of the training process. From equation, the sum of the mean errors is shown in (3).
![]()
where is the input feature, is the point of the, and is the desired result.
2.2.2. Multinomial logistic regression
Logistic regression is a technique for predicting the binary output which is normally used in binary classification. In this study, we utilize data with the discrete outputs by implementing the multinomial logistic regression which can be considered as multi-class classification. This regression technique’s core concept is to establish a decision boundary between the dataset to classify the type of data. If the data is evenly distributed, it will be difficult to classify it, and the error easily happens. When new data are obtained, the model decides based on previously created data lines. The multi-class logistic regression equation is illustrated in (4).
![]()
where is the probability that the input scenario occurs, is the independent variable of data, is the clarify variable, and is the constant.
The logistic regression equation is therefore modified by applying the cost function from equation (3). Logistic regression’s cost function equation is presented as (5).
![]()
where is the preceding base for logistic regression, and is the considered data, and is the average result of the data considered.
2.2.3. Naïve Bayes
The Naïve Bayes method classifies the class of input data according to probability-based distribution of the data. In terms of the Naïve Bayes predictions, the conditional probability is determined based in the likelihood function to categorize the data class. The probability that the input data becomes a member of the considered class can be calculated as
![]()
where is the probability of output class of the new data, is the probability in each class of the dataset, is the probability of the dataset correlating to new data and is the probability of new data correlating to the dataset.
The solution in the Naïve Bayes method is typically presented as discrete data. According to the considered continuous data, the probability density function (pdf) distribution equation must be used, and it can be expressed as the following equation (7).
![]()
where is the mean value of the input data, and is the standard deviation of the input data.
2.2.4. K-Nearest Neighbor (KNN)
K-nearest neighbor compares the new data to the current data in the dataset to determine the similarity based on their distance. By predicting the result, KNN determines the class of new data from K nearest members of the data in the dataset. KNN measures the distance between the new data and the member in the dataset through the Euclidean distance ( ) which is expressed in (5). In this approach, the processing time depends on the data volume of the dataset.
![]()
where is the distance between the new data and the existing dataset, is the point of the data in dataset, is the point of the test data or new data.
2.2.5. Neural Network (NN)
A neural network is an artificial intelligence technique that trains a machine to process information in a manner base on the human brain. Deep learning is a method of machine learning that utilizes interconnected nodes or neurons, resembling the layered structure of the human brain. This produces an adaptive platform that allows computers to learn from their mistakes and continuously improve. Basically, NN consists of three layers: the input layer, the processing layer, and the output layer. The input layer mainly consists of one layer and delivers data to the hidden levels. The processing layer is a hidden layer that contains the number of neurons. Depending on a particular optimal, the number of neurons on hidden layers can be increased to improve precision. The output layer is the last layer responsible for weighting each neuron or set of outputs using the values from the hidden layer to achieve the most accurate results. The NN structure is seen in Figure 4.
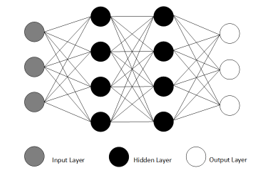
Figure 4: The structure of the neural network
The output of the previous step is fed to the system as the NN training process iterates over the data in the dataset to improve decision-making assume is the output of the present hierarchy. In a process known as back propagation, the output of layer is transmitted back to layer Stochastic gradient descent is used in this procedure to minimize the error which is illustrated in (9).
![]()
where is the error value, is the average result for node , and is the error of the excitation effect from nodes.
The equation for adjusting the decision weight is shown in (10).
![]()
where is an improvement in the hidden layer, and is the difference between the error value and the result.
When the sigmoid function is invoked, the equations for orienting the model configuration in the hidden layer appear in (11).
![]()
where is the result of considering all nodes in the hidden layer.
3. Methodology of the proposed system
In terms of measuring and storing RSSI values, the experiments were done in a noise-free chamber room, as seen in Figure 5. We use MCU ESP32 as a transmitter and the receivers. We install the transmitter on top of the station and the receivers are installed at the bottom of the station, and a test box is placed at the middle of the station. Then, the RSSI values are collected and transmitted to be further processed according to the procedure.
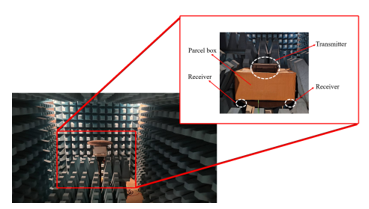
Figure 5: The proposed setup
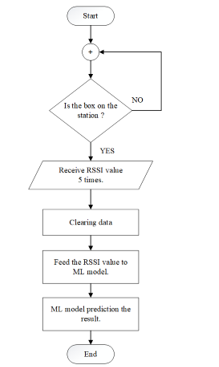
Figure 6: Flowchart of the proposed system
In this research, the RSSI value was collected in accordance with the flowchart depicted in Figure 6, beginning with the determination of whether or not a package was present on the measurement station. When there is a package at the station, the RSSI value will be collected five times from each receiver. Then, the system will transmit it to the clearing data in order to to eliminate interference. The value will then be transmitted to a machine learning (ML) model for processing in order to forecast the result. The accuracy of estimation can be determined by
![]()
where is the accuracy rate, is the result of prediction, and is the actual value, is amount of sample.
3.1. Experimental setup
In this section, we describe the experimental environment of the proposed system. In the experiment, the size of product is 8 cm. x 8cm. x 3 cm with the weight of 100 g. The size of box is 25 cm. x 35 cm. x 25 cm. To estimate the quantity of product in the sealed box, we collect the RSSI values from receivers under different volumes of product in the box where the determined volume are 0%, 20%, 40%, 60%, 80% and 100%. Then, we collect 2000 records of RSSI for each testing volume. Moreover, for weight measuring, we also collect 2000 records for each testing volume.
Firstly, we consider 5 cases of receiver’s number that are 1 to 5 of receivers for finding the optimum RSSI value that cover all the object patterns. Secondly, we present the object patterns in which we arrange our object in two cases: pattern alignment and random pattern. Thirdly, we consider four our experimental environments including one non-protection product and three protection products. Additionally, we show the performance comparison of the proposed system under 5 ML methods including linear regression, logistic regression, Naïve Bayes, K-nearest neighbors, and neural network.
3.1.1. Receiver installation and the proportional number of receivers.
In the experiment, we consider the proportional number of receivers. We consider 5 cases by increasing the number of receivers from 1 to 5 receivers. For example, we placed a 4-receivers in each corner of the box, as depicted in Figure 7(a), and a 5-receiver by mounting an additional receiver in the middle of the box, as depicted in Figure 7(b), to examine the accuracy when the number of receivers varies.
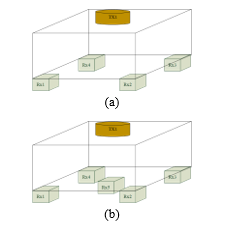
Figure 7: The example of 4 and 5 receivers in our experimental.
As illustrated in Figure 7, five receivers were recorded to establish the optimal number of sensors. For all considered ML methods, it was discovered that the efficiency of each method was better than other cases because a fifth receiver was added to the center of the bottom of the box. Then, we create a system with 1 transmitter and 5 receivers to accommodate all possible scenarios. The performance comparison of volume estimation accuracy when varying the number of receivers depicted in Figure 8.
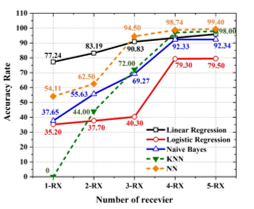
Figure 8: The performance comparison of volume estimation accuracy when varying the number of receivers.
3.1.2. The object alignment
In this section, the patterns of the object alignment is described which can be divided into two distinct categories, namely aligned pattern and random pattern. The item is arranged by increasing its volume from 0 to 100 percent in 10 percent increments. For instance, if the item occupies 10% of the box, we align the object in six situations, such as left, right, font, back, bottom, and random pattern, and then measure the RSSI between the transmitter and five receivers.
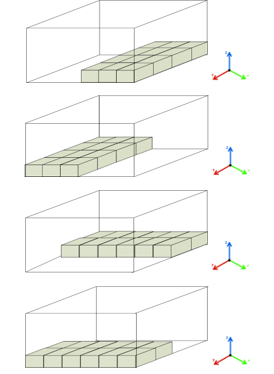
Figure 9: 10% of products’ pattern that initial arrangement of items begins in the horizontal plane of the XY plane.
To examine the object layout within the box, we separated the arrangement of objects within the box into three distinct configurations. As illustrated in Figure 9, firstly, we present 10% of products’ pattern that initial arrangement of items begins in the horizontal plane of the XY plane and subsequently increases along the Z axis to achieve 100 percent. The second pattern is to arrange the 10% of items on the YZ or XZ side planes and add up to 100 percent, as seen in Figure 10. In the final form, as seen in Figure 11, 10% of objects are randomly distributed in the box with no alignment between the objects. The organization of the items in accordance with this format is intended to facilitate their use in actual situations.
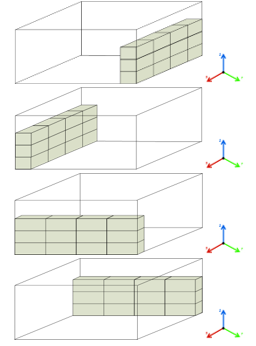
Figure 10: The second pattern is to arrange the 10% of items on the YZ or XZ side planes.
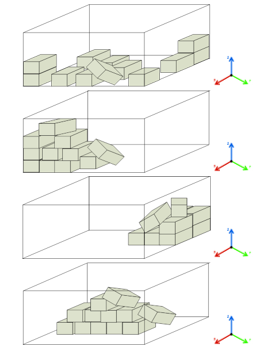
Figure 11: 10% of objects are randomly distributed in the box with no alignment between the objects
3.1.3. Data Cleansing
Before applying the ML techniques to estimate the volume of product, data cleansing is one important step to perform. When we obtain five RSSI values from 1 round of data accumulation, we evaluate the RSSI values, and we clean data by removing the RSSI value that differs from the measurement and replaced with the average from all other values before storing into the database. The clearing data algorithm is shown in Figure 12.
Table 1 shows the effectiveness comparison between the operating on data that was cleaned and not-cleaned. It was discovered that the volume estimation accuracy of the cleaned data is higher that the performance system of not-cleaned data. Moreover, from the results, we can conclude that cleansing data is an important procedure, especially for linear regression, KNN, and NN methods.
Table 1: Data outline clearing.
| Techniques | The volume estimation accuracy of non-cleansing data (%) | The volume estimation accuracy of cleansing data (%) |
| Linear regression | 85.70 | 95.93 |
| Logistic regression | 79.10 | 79.50 |
| Naïve Bayes | 82.46 | 92.40 |
| KNN | 94.80 | 98.00 |
| NN | 96.93 | 99.40 |
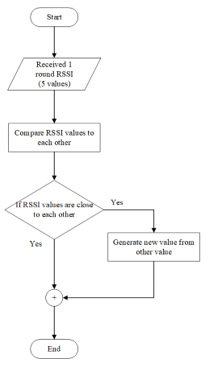
Figure 12: Flowchart of clearing data algorithm.
3.2. Comparison of methods efficiency
In our experiment, the volume estimation in the proposed system is considered under three object alignment including horizontally aligned, vertically aligned, and randomly patterns and we increase the number of items in the sealed package raising from 0% to 100% in 10% increments. The total records are 84,000 records that is separated to 70% for training dataset and 30% for testing dataset. The quality of the system was evaluated using the following five analytical methods: linear regression, logistic regression, Naïve Bayes, KNN, and NN.
The results of the experiments shown in Table 1 indicated that the efficiency of five receivers yielded the following results: the NN approach shows the highest accuracy, 99.40%, while KNN provides a value of 98.00%. The accuracy of linear regression and Naïve Bayes is 95.93% and 92.4%, respectively. The logistic regression also provides an accuracy of at least 79.50%. The investigation revealed that NN shows the highest accuracy because it learns the characteristic of RSSI information according to the object storing pattern and generates the weights through back propagation algorithm. It can be seen that characteristic of the RSSI values from each transmitter is not correlated to others then NN benefits from data from those transmitters. In the case of KNN, it shows a high accuracy since it estimates the output value by determining all data from the database. Consequently, the system achieves high precision.
In the case of linear regression, it generates a linear equation from an existing dataset and will use this equation to predict the output when the new data is coming into the system. In our experiment, this method gives a high precision of output estimation because the dataset of our system is a nearly linear pattern that proper to this method. Conversely, Naïve Bayes will do a probabilistic analysis of the new data. The new data will be verified that it has a probability to be similar to a group in the data in database and deciding to provide new information to that group based on that comparison, may improve the efficiency of data management. To categorize data types, the logistic regression method divides the data’s boundaries using a line. If the data are highly similar, it will be unable to distinguish between the different types. Therefore, this procedure is less accurate than alternative ways.
Additionally, we determine the volume estimation time of each methods. Table 2 shows the time spent on each technique. It was discovered that the KNN approach did not require any training time, i.e. the KNN model measures simply the distance between old and new data to make decisions. On the other hand, it takes a long volume estimation time and will be longer if the database is huge. The Naïve Bayes consumes 14.72 milliseconds of training time since it only determines the average and standard deviation (SD) values to be used as the learning model. The linear regression approach and logistic regression consumes 19.10 milliseconds and 828.00 milliseconds, respectively. Finally, the NN consumes the longest training time, 365,060.00 milliseconds, since its training algorithm is highly complex.
Table 2: Time usage of 5 machine learning techniques.
| Techniques | Time of training (ms) | Time of test (ms) |
| Linear regression | 19.10 | 7.68 |
| Logistic regression | 828.00 | 7.24 |
| Naïve Bayes | 14.72 | 8.42 |
| KNN | – | 25.97 |
| NN | 365,060.00 | 6.51 |
From the aforementioned testing findings, it can be concluded that the approach with the best accuracy was the NN method and consumes the shortest estimation time of 6.51 milliseconds. Since the model will experiment by weighting each variable on the new data set and generating predictions, it takes longer than other methods to predict. Next, the second most accurate method was KNN, which made predictions in 25.97 milliseconds. This approach used less time than the previous one since it calculated the distance between new and old data. However, if there is a huge quantity of historical data, this method will take a considerable amount of time to predict. The Naïve Bayes technique predicts in 8.42 milliseconds once it calculates the probability that the new data belong to the considered group. Linear regression and logistic regression predict in 7.68 and 7.24 milliseconds, respectively, using the new data mapping method to the linear line and data, respectively.
Based on the results of the experiments, it can be concluded that the NN methodology is the best method since it presents the most accurate and shortest volume estimation time, while logistic regression seems to be the worst. Therefore, the NN methodology can be considered as the most appropriate method to be implemented in the volume estimation application.
3.3. The effect of shockproof to RSSI
3.3.1. Type of shockproof
In addition, this research examines the effects created by shock-resistant materials utilized in transportation. As indicated in Table 3, the impacts of various shockproof materials such as bubble wrap, paper, and airbag are evaluated using RSSI values. In the case of bubble airbags filling the boxes to their maximum capacity, the RSSI values were observed to vary by 1–2 dBm relative to the empty boxes. The measured RSSI difference for the bubble wrap was between 5 and 7 dBm. In the latter instance, the difference was 7–10 dBm, as is the case with paper. The 100% of the capacity of the box has been padded with shock-absorbing material, according to all dimensions. Figure 13 depicts a shockproof material type.
Table 3: The differential of RSSI values with shockproof.
| Type of Shockproof | RSSI value: Free space (dBm) | RSSI value: 100% of shockproof (dBm) | The differential RSSI values (dBm) |
| airbag | -26 to -27 | -27 to -28 | ±1 |
| Bubble wrap | -26 to -27 | -31 to -33 | ± (5 – 7) |
| paper | -26 to -27 | -33 to -36 | ± (7 – 10) |
3.3.2. Accuracy rate with shockproof
Considering the real circumstances of transport that need the use of cushioning material to prevent potential damage to the object during transit, we pack the object with padding. Consequently, at this stage, measurements and processing were conducted to establish the impact that happens when the shockproof material fills the remaining space of the box. Airbag shockproof, bubble wrap and paper shockproof materials are popular to be used and we evaluate these materials in our experiment. The impact was precisely quantified and compared to a casing that lacked a shockproof coating. Table 4 demonstrates that the precision findings are like the previous results, i.e., in the case of the 5 receivers when the paper is used as a shockproof. The NN model has the greatest performance at 98.95%, followed by the KNN model at 97.25% and the linear regression model at 93.67%. The accuracy of Naïve Bayes and logistic regression was 90.22 and 79.03 percent, respectively. The precision of the other two materials, bubble wrap and airbag shockproof, is greater than that of paper. The airbag shockproof has the smallest effect on the RSSI quantification. The accuracy was determined to be (0-1) % different from that in the absence of cushioning material, and (1-2) % different from that in the presence of bubble wrap. In the last instance, the paper had an accuracy variation of (1-3) %. The conclusion is that RSSI measurement still produces accurate results when packing cushioning in shipping boxes.
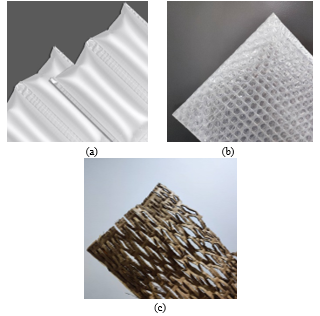
Figure 13: Types of shockproof.
In the previous section, the effectiveness of each cushioning material was evaluated. Different sorts of cushioning materials may be utilized in actual transportation environments. In this consideration, the next part of the experiment includes the situations of quantification without cushioning in comparison to all potential cases. There were 84,000 records of experimental data, which included non-shockproof, item with airbag shockproof, object with bubble warp, and paper shockproof. The test results are evaluated and shown in Table 4 by analyzing the RSSI data from all instances that were trained on different models. As a result, NN shows the highest performance for all shockproof environment while the logistic regression shows the worst. It can be mentioned that logistic regression and Naïve bayes are the learning algorithms for classification application therefore they show lower performance than others. Moreover, we compare the performance for all situation as depicted in figure 14. It was determined that the accuracy gained from the prediction of case 5 receivers using the NN approach was still the greatest at 99.07%, followed by KNN at 98% and linear regression at 95.10%. The results for Naïve Bayes and logistic regression were 92.20 percent and 79.28 percent.
Moreover, we compare the best and worst performance of the ML implemented techniques to the weight measuring technique which are shown in table 5. From the experimental results, weight measuring technique presents 91.31% of accuracy where the tolerance value of the weight machine is 5%. As compared to the highest and lowest accuracy of volume estimation by ML techniques, the NN presents higher accuracy than weight measuring where logistic regression presents lower accuracy. It can be noticed that once NN learns the characteristic of RSSI values according to the product quantity, it present higher accuracy. On the other hand, the framework of logistic regression is not appropriate to predict the continuous value of quantity estimation, therefore it presents lower accuracy.
Table 4: The accuracy of volume estimation considering non-shockproof and three shockproof environments.
| Techniques | Non-shockproof (%) | Airbag shockproof (%) | Bubble warp (%) | Paper shockproof (%) |
| Linear regression | 95.93 | 95.45 | 93.82 | 93.67 |
| Logistic regression | 79.50 | 79.42 | 79.29 | 79.03 |
| Naïve Bayes | 92.34 | 92.14 | 90.95 | 90.22 |
| KNN | 98.00 | 98.00 | 97.55 | 97.25 |
| NN | 99.40 | 99.23 | 98.85 | 98.95 |
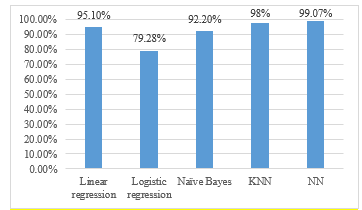
Figure 14: A performance comparison of overall performance
Table 5: Accuracy of unpack boxes volume estimation.
| Accuracy rate of weighting machine (%) | Accuracy rate of logistic regression (%) | Accuracy rate of NN (%) | Accuracy rate of weighting machine (%) | Accuracy rate of logistic regression (%) |
| 91.31 | 79.28 | 99.07 | 91.31 | 79.28 |
4. Conclusion and future work
In this study, an experiment to measure and estimate the quantity of products in non-open or destroy-sealed box containing different layouts of objects was presented. Using a receiver created from 5 nodes of MCU ESP32, a total of 84,000 records of RSSI are collected under noiseless environment and used to estimate the quantity of product using the ML techniques including linear regression, logistic regression, Naïve Bayes,
K-nearest neighbors, and neural network. The impact of the packaging’s cushioning material and various patterns of product in the sealed package are examined. Moreover, we compare the performance of volume estimation without the box unpacking technique which is done by weight measuring to the proposed method. From the experimental results, once the location of receivers are set appropriately where the coverage area of signal covers all area of the box, the measured RSSIs can be used to estimate the quantity of product in the sealed box. Among the determined ML techniques, NN shows the highest accuracy once it learns the characteristic of RSSIs under different product quantity to generate the weights of the algorithm. On the other hand, logistic regression shows the lowest accuracy since the learning characteristic is appropriate to the classification application where the output is discrete. By comparing to the weight measuring, it can be noticed that the proposed method is better than the weight measuring since the accuracy of the weight measuring depends on the device and the specific tolerance. Once the tolerance is high, the error also high. Moreover, the proposed method consumes short product quantity estimation time without unpacking or destructing the box.
In future work, improving the accuracy and adjusting the data processing algorithms to be more resistant to the arrangement of things within the package and to be utilized in a loud environment, as well as developing a system that is adaptable to changing parcel sizes, are the next steps.
Acknowledgment
This research was funded by King Mongkut’s University of Technology North Bangkok. Contract no. KMUTNB-PHD-63-03.
- T. Anusha, “Trends and Analysis of E-Commerce Market: A Global Perspective,” International Journal of Applied Marketing and Management, 6, 11-22, 2021.
- M. Aghaei, A. Mohammad, R. Sahebi, “Investigating the Change in Customers, Sustainable Consumption Behaviour after the Outbreak of COVID-19,” International Journal of Applied Marketing and Management, 6, 34-49, 2021.
- B. Anam, H. Akram, H.M. Basit, A.U. Khan, “E-commerce trends during COVID-19 Pandemic,” International Journal of Future Generation Communication and Networking, 13, 2020.
- P. Goyal, K. Goyal, A. Chauhan, “Emerging Trends of E-Commerce perspective in Developing Countries,” Journal of Positive School Psychology, 6(4), 7090 – 7096, 2022.
- R. Somdech, T. Sriyakul, K. Jermsittiparsert, “The Era of e-Commerce & Online Marketing: Risks Associated with Online Shopping,” International Journal of Innovation, Creativity and Change, 8, 201-221, 2019.
- K. Chueamuangphan, P. Kashyap, C. Visvanathan, “Packaging Waste from E-Commerce: Consumers Awareness and Concern,” in Ghosh S. (eds) Sustainable Waste Management: Policies and Case Studies Springer, 1, 27-41, doi:10.1007/978-981-13-7071-7.
- B. Stöcker, D. Baier, B.M. Brand, “New insights in online fashion retail returns from a customers’ perspective and their dynamics,” The Journal of Business Economics (JBE), 91, 1149–1187, 2021.
- T. Rintamäki, M.T. Spence, H. Saarijärvi, J. Joensuu, M. Yrjölä, “Customers’ perceptions of returning items purchased online: planned versus unplanned product returners,” International Journal of Physical Distribution & Logistics Management, 51(4), 403-422, doi:10.1108/IJPDLM-10-2019-0302.
- M. Truijens, X. Wang, H. de Graaf, J.J. Liu, “Evaluating the Performance of Absolute RSSI Positioning Algorithm-Based Microzoning and RFID in Construction Materials Tracking,” Mathematical Problems in Engineering, 2014(3), 2014.
- K. Bouzaffour, B. Lescop, P. Talbot, F. Gallée, S. Rioual, “Development of an Embedded UHF-RFID Corrosion Sensor for Monitoring Corrosion of Steel in Concrete,” IEEE Sensors Journal, 21(10), 12306-12312, 2021.
- Ifmalinda, R.E. Putri, I. Rasinta, “Estimation of Size Volume and Weight of Oranges Using Digital Images Processing,” in The 4th International Conference on Sustainability Agriculture and Biosystem, 100(2), 315-321, 2010, doi:10.1088/1755-1315/1059/1/012016.
- Y. Sun, Z.X. Liu, M. Li, Z.T. Zeng, Z.X. Zong, C.L. Ji, “An Object Recognition and Volume Calculation Method Based on Yolov3 and Depth Vision,” Journal of Physics Conference Series, 1684(1), 2020, doi:10.1088/1742-6596/1684/1/012009.
- A. Poulose, D.S. Han, “Performance Analysis of Fingerprint Matching Algorithms for Indoor Localization,” in 2020 International Conference on Artificial Intelligence in Information and Communication (ICAIIC), 661-665, 2020.
- M. Taha, R. Atallah, O. Dwiek, F. Bata, “Crowd Estimation Based on RSSI Measurements Using kNN Classification,” in 2020 3rd International Conference on Intelligent Autonomous Systems (ICoIAS), 67-70, 2020.
- K. Coussement, S. Lessmann, G. Verstraeten, “A comparative analysis of data preparation algorithms for customer churn prediction: A case study in the telecommunication industry,” Decision Support Systems, 95, 27-36, 2017.
- R. D. Ainul, S. Wibowo, Djuwari, M. Siswanto, “An Improved Indoor RSSI Based Positioning System Using Kalman Filter and MultiQuad Algorithm,” in 2021 International Electronics Symposium (IES), 558-564, 2021, doi:10.1109/IES53407.2021.9594009.
- P.D. Tinh, T.T.N. Mai, “Mobile Indoor Positioning System Utilizing WiFi RSSI and Motion Data,” in 2020 4th International Conference on Recent Advances in Signal Processing Telecommunications & Computing (SigTelCom), 98-102, 2021, doi:10.1109/SigTelCom49868.2020.9199021.
- J. Ren, Y. Wang, W. Bai, C. Niu, S. Meng, “An improved indoor positioning algorithm based on RSSI filtering,” in 2017 IEEE 17th International Conference on Communication Technology (ICCT), 1136-1139, 2017, doi:10.1109/ICCT.2017.8359812.
- W. Wang, Y. Zhang, L. Tian, “TOA-based NLOS error mitigation algorithm for 3D indoor localization,” China Communications, 17(1), 63-72, 2020.
- S. Jeong, T.K. Sung, K.E. Lee, J. Kang, “Joint TOA/AOA-based localization in wireless sensor networks,” in 2014 8th International Conference on Signal Processing and Communication Systems (ICSPCS), 1-5, 2014.
- B. Al-Qudsi, M. El-Shennawy, Y. Wu, N. Joram, F. Ellinger, “A hybrid TDoA/RSSI model for mitigating NLOS errors in FMCW based indoor positioning systems,” in 2015 11th Conference on Ph.D. Research in Microelectronics and Electronics (PRIME), 93-96, 2015, doi:10.1109/PRIME.2015.7251342.
- F. B. Günay, T. Çavdar, “Mobile fleet localization model via RSSI, TOA and TDOA in wireless sensor networks,” in 2014 22nd Signal Processing and Communications Applications Conference (SIU), 1431-1434, 2014, doi:10.1109/SIU.2014.6830508.
- M. I. Jais, P. Ehkan, R. B. Ahmad, I. Ismail, T. Sabapathy, M. Jusoh, “Review of angle of arrival (AOA) estimations through received signal strength indication (RSSI) for wireless sensors network (WSN),” in 2015 International Conference on Computer, Communications, and Control Technology (I4CT), 354-359, 2015, doi:10.1109/I4CT.2015.7219597.
- K.J. Baik, S. Lee, B.J. Jang, “Hybrid RSSI-AoA Positioning System with Single Time-Modulated Array Receiver for LoRa IoT,” in 2018 48th European Microwave Conference (EuMC), 1133-1136, 2018, doi:10.23919/EuMC.2018.8541736.
- N. Raj, “Indoor RSSI Prediction using Machine Learning for Wireless Networks,” in 2021 International Conference on COMmunication Systems & NETworkS (COMSNETS), 372-374, 2021, doi:10.1109/COMSNETS51098.2021.9352852.
- M. Schroth, T. Etkin, W. Stork, “A novel approach for human activity recognition using object interactions and machine learning,” in 2021 IEEE Sensors Applications Symposium (SAS), 1-6, 2021, doi:10.1109/SAS51076.2021.9530029.
- B. Zheng, T. Masuda, T. Shibata, “An Indoor Positioning with a Neural Network Model of TensorFlow for Machine Learning,” in 2021 International Symposium on Intelligent Signal Processing and Communication Systems (ISPACS), 1-2, 2021, doi:10.1109/ISPACS51563.2021.9651131.
- K. Wasayangkool, K. Srisomboon, W. Lee, “The Volume Estimation Technique using RSSI with Machine Learning in Manufacturing Process,” in 2022 37th International Technical Conference on Circuits/Systems Computers and Communications (ITC-CSCC), 1-4, 2022.
- A. Shojaifar, “Evaluation and Improvement of the RSSI-based Localization Algorithm: Received Signal Strength Indication (RSSI) Dissertation,” Computing and Intelligent Systems, 2, 10-12 2015.
- H. Ahmadi, R. Bouallegue, “Exploiting machine learning strategies and RSSI for localization in wireless sensor networks: A survey,” in 2017 13th International Wireless Communications and Mobile Computing Conference (IWCMC), 1150-1154, 2017, doi:10.1109/IWCMC.2017.7986447.
- P. Koovimol, S. Pattaramalai, “Experimental Machine Learning for RSSI fingerprint in Indoor WiFi Localization,” in 2021 18th International Conference on Electrical Engineering/Electronics, Computer, Telecommunications and Information Technology (ECTI-CON), 1018-1021, 2021, doi:10.1109/ECTI-CON51831.2021.9454865.
- D.O. Camacho, L.M. Proaño, “Increasing Accuracy in Positioning by RSSI: an Analysis with Machine Learning Algorithms,” in 2019 International Conference on Information Systems and Computer Science (INCISCOS), 31-35, 2019, doi:10.1109/INCISCOS49368.2019.00014.