Human-Centered Design, Development, and Evaluation of an Interface for a Microgrid Controller

Adv. Sci. Technol. Eng. Syst. J. 8(3), 80–88 (2023);
 DOI: 10.25046/aj080310
Many millions of people have adverse effects on their lives, both socially and economically, when a power outage occurs. Along with other electrical events, the lack of Situational Awareness (SA) is one of the root causes of power system outages. In order to promote adequate situational awareness, both power system and microgrid interfaces should communicate the necessary information in a helpful format at the right time. It is particularly difficult to present this information to microgrid operators in an accessible and timely manner. A human-centered design approach is used to develop two human-machine interfaces for the Potsdam, NY microgrid project. A detailed description of the process is provided in this extended paper.
1. Introduction
A reliable, quality power supply is vital to our standard of living on a day-to-day basis. Electric power supply interruptions have great negative impact on our social and economic life. Significant research has focused on identifying the root causes of power outages and have reported Situational Awareness (SA) as one of the key causes. In this regard a study has been done to design and develop interface for Potsdam Microgrid. An overview of the main study results is presented in [1]. In this paper, the step-by-step process of conducting the experiment is described in detail.
2. SA and its challenges
One of the most widely used SA models can be found in [2]. Where the author defined SA as “the perception of the elements in the environment within a volume of time and space, the comprehension of their meaning and the projection of their “comprehension” of the current situation, and finally, level three is the “projection” of the future state. Further details of the three-level SA model are found in [3].
Power system operations require real-time assessments, monitoring, and activity control. Most importantly, power system operations require the coordination of electricity production at thousands of generators, long transmission line networks, and tens of thousands of electrical buses. All of this is required to ultimately deliver electricity to millions of users by means of the distribution network [4]. The complexity of the power system infrastructure is continuously rising, and utility companies have been increasingly facing challenges to make decisions in a timely and accurate manner. [5] and [6] identified SA challenges for power transmission and distribution which seriously downgrade operators’ SA.
|
||||
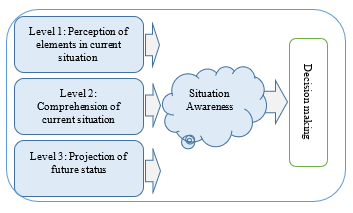
Figure 1: Model of Situation awareness adapted from [3]
Attentional tunneling involves situations when even all the needed information is presented, it is not fully attended by the person monitoring the system. The attention narrows as the scanning behavior is dropped.
Data overload is related to the volume and rapid change of data that creates an information intake pace that is hard to assimilate. Typically, the operator has to scan through thousands of pages of SCADA data tables. When coupled with weather reports, alarms, contingency analysis data, and state estimator calculations, operators tend to become flooded with data, creating severe losses in SA [7].
Requisite memory trap. It is related to the capacity limitations to retain information in the working memory. Control room operators have to monitor more than twenty different pieces of information continuously [8].
Workload, anxiety, fatigue, and other stressors. System operators need to seek data, sort through what is available, and integrate information for decision-making in time-pressured environments. This requires high mental workloads, fatigue, and other stressors, leading to an increased number of opportunities for errors.
Misplaced salience occurs when software systems fail to highlight the most critical information. Operators have to visually fight the allure of several flashing lights and a wide variety of colors to identify the relevant information needed.
Errant mental models. Mental models tell how to combine information taken from different places. Poor comprehension and projection of the situation result when using incomplete or wrong mental models to interpret information.
Complexity creep. The more system features and governing rules, the more difficult it is to understand how the system works, slowing down the ability to extract and interpret information.
Out-of-the-loop syndrome. Highly automated systems can leave operators with low awareness of the state of the system. A germane example is the August 2003 blackout [9], where operators did not realize that the diagnostic tools were off-line and not updating in real time.
There is a need for a good SA design solution to provide support for human limitations and avoid known problems with human information processing. This study developed and tested interface to promote/support operators SA.
3. Interface and Simulator Design
Situation Awareness (SA) is the key to user-centered design [10]. Endsley defined SA as “the perception of the elements in the environment within a volume of time and space, the comprehension of their meaning and the projection of their status in the near future” [3] pg. 13. The user interface design process is adapted from [11], shown in Figure 2.
3.1. Requirements analysis
In the first phase of interface design, it is necessary to transform the goals of the project/users into specific system requirements. Typically, the requirements are collected using cognitive task analysis (CTA) [12]. [11] presented a form of CTA called a goal-directed task analysis (GDTA) to identify the goals, decisions, and SA requirements of operators. GDTA is used/necessary to understand the interface design specifications with a detail description of not only the specific data operator needs but also indicates the way the operator integrates the data to develop an understanding of the current situation and make a decision [13]. To collect the microgrid specific requirements a set of questions are prepared. In this study, a number of practicing power system operators were interviewed in preparation for developing these questions. The developed questions are:
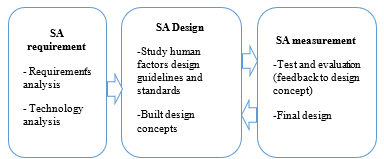
Figure 2: Interface design process [11]
- What are your main goals during normal operations?
- What are the functions of the human operator under normal operations? (Daily activity) or what tasks do you need to do to achieve your goals?
- What do you need to know to achieve your goals? Or what would you ideally like to know? How do you get that information? How do you use that information?
- What information elements are necessary for properly monitoring the system? How many displays (or any other information sources) do you need to constantly monitor?
- Do you think these displays (or information sources) are enough for maintaining a safe operation? Or is there anything else that needs to be monitored to improve reliability? What do you do if you do not have the information needed to completely assess the situation (e.g., how do you seek that information and how often does it happen?)
- Do you think people can make mistakes because the system does not provide all the information needed or the information displays are too complex? If so, what types of mistakes or consequences are likely to occur? Are there any improvements you would like to make?
- How confident are you that the information you are receiving is reliable and valid? How does that affect your decisions?
- How do you define normal condition operations? (e.g., what are the threshold values/limits?
- How do you identify (or become aware of) a problem/contingency? Does the system alert you in some way? Is there an alarm system (audio, visual, or both)?
- Do you think these problem identification techniques/methods are good enough? Or do you need better system notifications? Are there any improvement recommendations?
- If there are multiple types of alarms, is there a prioritization mechanism for addressing problems?
- How do you determine what actions need to be done to solve the problem? (e.g., do you have to do manual computations? Are there any particular skillset needed or specialized knowledge that helps the decision-making?)
- What types of problems typically occur? What actions do you perform to solve each type of problem?
- How much time do you have to (or is expected for you too) solve the problem?
- Do you think that solving the problem through this method or series of actions are good enough? Or is there anything you need for facilitating your job (e.g., do you have all the information/tools you need to make decisions quicker)? Could you please elaborate on that?
- What is the workforce needed for smooth operations under normal conditions? (area of operation)
- Have you ever felt the need for getting information outside of your working area?
- How would be the ideal way of getting that piece of external information? Via phone? Or Do you think all information should be available for you through electronic communication (e.g., computer software displays)?
- What is the skill level necessary for the operator (BS, MS or high school grad)?
- What is the required training for the operator?
- Do you use any manual operations or documented operation guidelines?
- Which decisions are automated and, which ones cannot be automated or require final operator input?
- Do you have anything to support awareness of future projections? (i.e.: that indicates near future worst-case contingencies, trending information)
An interview is not sufficient to create a GDTA table properly. Therefore, this study also relied on literature to identify the goals of power system operators. [14] interviewed Specialist Reliability Analysis and Operation (SRAO), and the Reliability Coordinator/System Operator (RCSO) positions from two U.S. power companies to develop GDTA. Figure 3 shows the overall goal of the operator: to keep all elements and voltages within limits in real-time and for first contingency [14].
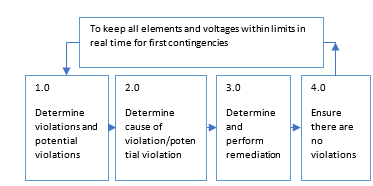
Figure 3: The overall goal of power system operators [14].
Contingencies are an unexpected failure of any system component, for example, transmission line, generator, circuit breaker or other electrical elements. By planning for first contingency means, the operator can attempt to prevent the uncontrolled cascading loss of system elements that results in widespread load interruption. Four primary goals were identified as well under the overall goal. A primary goal is determining if any violations have occurred. A second primary goal includes the cause of a violation or potential violation. The next two primary goals are to remediation of any violation or possible violation.
3.2. Design alternatives
SA is necessary for effective decision making that will lead system operators to take appropriate corrective actions. Initially, four preliminary interface display conceptss were developed that were based on the principles and best practices identified from the literature review.
Alternative #1 is shown in Figure 4. Some of the key features are:
- Switches and breakers are shown in a conventional way
- Bus names and pu values are shown to the side of each bus icon
- Loads are shown in MW and MVAR units
- Dynamically sized pie charts show line loading percentages in per cent of the thermal limit.
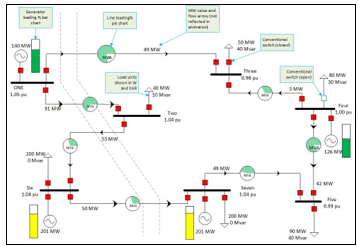
Figure 4: Alternative#1 display overview
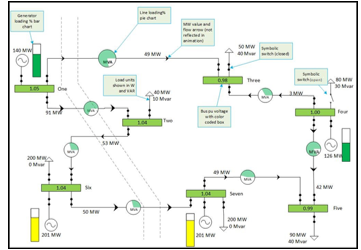
Figure 5: Alternative#2 display overview
Alternative #2 is shown in Figure 5. Key features are:
- Switches and breakers are shown with SPST switch symbols to discern open or close status easily
- Buses are presented in colored boxes (This color could be reversed based on the operator’s choice)
- Bus per unit values are written inside the box
- Loads are shown in MW and MVAR units
Alternative#3 is shown in Figure 6. Some of the key features are:
- An overview box displays key information
- Pie charts show generator loading in percent of rating. The pie chart switches color depending on the situation (normal, alarm, etc.)
- Per Unit bus voltage are shown with a trend line
- Line names are displayed, and the operator has the option to display loading in percent, MVA, or amps.
- The set of overloaded lines are displayed in a single box, as are the set of heavily loaded lines.
- Loads are shown with MW or MVAR trend line
- Last update time is also logged
Alternative #4 is shown in Figure 7. Some of the key features are:
- The overview box has key information, such as overloads, trip and recent alarms
- Selecting an alarm will highlight the fault location/s on the coordinated views
- Generator that are out of service for maintenance are grayed out
- Spinning reserve will be shown in pink color
- Loads are shown with MW or MVAR trend line
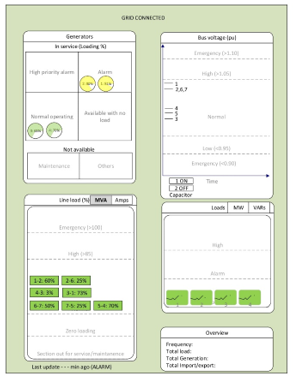
Figure 6: Alternative#3 display overview
3.3. Feedback from the experts
These four concepts were presented to power grid operators and supervisors from our industry partners, using simulated screens/animations. A brief feedback survey was done with power system operators. We received four survey responses from these participants. The purpose of this survey was to select one concept
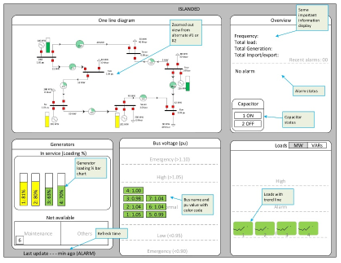
Figure 7: Alternative#4 display overview
and upgrade that interface to integrate it with load flow simulation software to make a fully real time simulation of the microgrid. Survey questions for these four alternatives are as follows:
- How satisfied are you with the interface design?
- Do you think the overview display screen would be appropriate for small screens, e.g. tablet or mobile devices?
- What other important information do you think is necessary to display but is missing in the overview display?
- What other information would be nice to have in the overview display?
- Any suggestions for improvement
- Preference for the design alternatives
- Overall suggestions
- How do you want to view bus voltage values?
Responses: Overall average score of satisfaction for the alternative#1, 2, 3, and 4 are 4, 3.5, 2.25, and 4.25 respectively. As a result of this process, parts of Alternatives #1 and #4 were selected for further study, and revised based on operator feedback. For Alternative #2, it was found that professionals do not want to change from conventional displays for circuit breakers and buses i.e., red for closed, and green for open breakers.
These revised concepts were then developed using LabVIEW software for the HMI and Matlab code for the system state and power flow analysis to develop a real time simulator that was then evaluated using SA measures.
3.4. Real Time Simulator
Among the alternatives presented in an earlier section, Alternatives #1 and #4 were selected to move forward for testing. Two HMI’s were created for the proposed seven-bus Potsdam, NY.
In both cases, line loading pie charts were replaced with bar charts. The reason behind this is, pie charts are not easy to interpret by the human cognition process. “Pie charts force us to compare either 2-D areas or the angles formed by each pie. Our visual perception handles neither of these comparisons easily or accurately.” [15]. Also, operators control each circuit breaker from the one-line diagram. Selection of a given circuit breaker opens a pop-up window to confirm the action. As the status of the microgrid is critical, the one-line also has a block at its center that confirms the status (grid connected or isolated).
Interface A (Figure 8) consists of five blocks of information. These are arranged to provide an intuitive understanding of the status of the microgrid. The first block presents a conventional one-line diagram.
The second block on the right side of the interface presents overview information of the total microgrid. This section provides total microgrid frequency, generation, import/export, and load. In addition, this section presents alarms. One important intended feature of this alarm list is a coordinated view, meaning the selection of one alarm should show/highlight the affected elements in the other blocks of the interface. In the next block (bottom middle) of the interface, the microgrid load is presented in a load curve. The load curve is provided to help in users SA level 3 (projection of the system condition). The load block shows the load curve trend, and includes operator-initiated load shedding capability on the individual busses. Finally, the generator status block presents both generator status and loading as well a capacitor status.
Interface B figure 8, has the same color conventions and diagram symbols as Interface A. Interface B has a single block design, with the one-line diagram enlarged in this block. Load and voltage data are displayed on the one line. Alarms are shown directly on the one line. In Figure 9, the Bus 1 generator is overloaded. As a result, the generator bar graph is red. When it becomes overloaded, the bar graph will pulse, and an audible alarm will sound until it is acknowledged. Operator actions for generator, capacitor and load shedding are initiated directly from the one-line in this interface, rather than from a subpanel. In addition, detailed views of the generator (Figure 10) and bus status (Figure 11) are available for selection by the operator to show additional detail that is in the subblocks of Interface A.
In both HMI’s, an overload of violation causes an alarm to sound. For generator and line overloads, the bar graph turns red and blinks. Also, the red “Alarm On” turns on. For bus voltage violations, the bus name turns red and blinks to indicate the alarm state. When the alarm comes on, the operator mutes the alarm by pressing the “Mute Alarm” button. When the alarm is muted, this button turns orange and displays “Unmute Alarm”. When the system is in an alarm state, the operator mutes the alarm, and then resolves the contingency by adjusting generator outputs, switching lines or capacitors in or out, or implementing load shedding from the HMI interface. Contingencies studied include separating from the bulk power grid, line trips and generator trips.
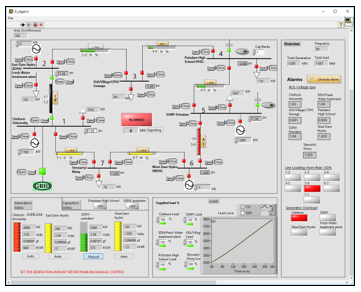
Figure 8: Potsdam microgrid interface-A using LabVIEW software.
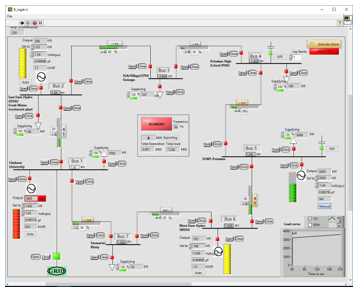
Figure 9: Potsdam microgrid interface-B using LabVIEW software.
These two HMI options were implemented in the LabView software. The Potsdam Microgrid was represented in Matlab with using a Newton-Raphson load flow. TCP/IP communications were used to connect the load flow and HMI interfaces. The load flow had an update rate of 1 second, and it was able to operate in real time. Each second, the load flow algorithm received updated breaker status and generation and load inputs from the HMI. It then ran the load flow, and sent bus voltages and line and generator power flows back to the HMI for display and alarm generation. The user was able to open and close circuit breakers and adjust generator and load settings directly in the HMI.
The next section presents the situational awareness assessment methods evaluation techniques used in this study, and the SA results that provide comparative analysis of the two interfaces.
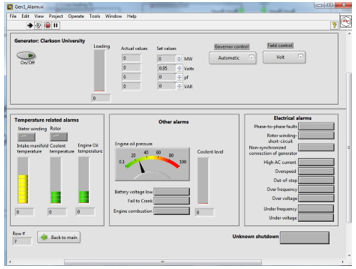
Figure 10: Detail view of the generator window.
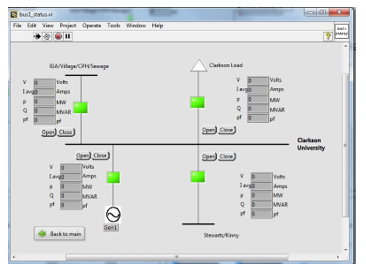
Figure 11: Detail Bus view window.
4. SA assessment/Human factors testing
Assessment or evaluation is an important part of any SA design process. Evaluation is important to avoid any unforeseen issues that can negatively impact an operator’s SA. SA is an internalized mental concept, and adequately assessing SA can be difficult. [16] suggest two evaluation methods: direct and indirect measures of SA (presented in Figure 12). They proposed some techniques for those measures as well. In this study, SAGAT (Situation Awareness Global Assessment Technique) is used as a direct measure and the performance measure method is used as an indirect measure for the microgrid interfaces.
[17] have used 28 students to participate in their study to assess their simulated interfaces. For the microgrid interface assessment, 28 undergrad and/or graduate students participated in the study. Students were selected from those who have completed or were enrolled in the courses Power Transmission and Distribution, Power System Engineering, High-Voltage Techniques and Measurements, or Energy Conversion. Student subjects are compensated $20/hr for their participation in the study.

Figure 12: Approaches to SA measurement. Adapted from [16]
4.1. The indirect performance measure of SA
Indirect performance measures consist of techniques that assess SA based on the operators’ overall performance. This approach assumes a direct relationship between SA and performance. However, good SA is necessary but not sufficient for good performance. A person might have good SA, but lack the skill, training and/or knowledge that is required for good performance. This section describes the human factors testing methodology used to compare the operators/students’ performance between the two interfaces developed using LabVIEW.
In this study, a training manual and video were developed. Participants were given hands-on training with a sequence of 5 trial cases. Half of the participants were trained with interface-A, another half trained with interface-B. Finally, they were tested with 5 trials in each interface (5 x 2 = 10 trials for each participant). Action times were recorded for evaluation as a measure of their performance with the interfaces. Each student received the same contingency (line trip) sequence. In each trial, thirty seconds into the simulation a line trip/outage occurs. This trip causes an overload on one or more of the transmission lines or generators and/or voltage violations. Any of this cause an audible alarm to sound. This event requires three tasks of the user:
- acknowledge the violation
- solve each violation through operator action
- confirm that the system does not have any violation
For the Potsdam microgrid, this study analyzes three measures:
- time taken to acknowledge violation,
- time taken to solve the violation and
- time taken to confirm that there is no violation now/system is a normal state.
Operators/subjects can solve the violations by increasing/decreasing generation kW output, switching capacitors, and/or load shedding. Faster response times for each measure indicate better operator performance.
With each test participant, the time taken to mute the alarm and the time to solve the contingency were recorded. While evaluating responses, the study excludes all the measurements that took 60 seconds or more to solve the contingency. In addition, the test recorded the time to acknowledge no violation scenarios (time is taken to click the unmute button after the system came back to normal state). The study excludes those test points that do not have unmute time (could be for the technical issue) or where participants took more than 20 sec to unmute. Considering all the facts 121 observations for Interface A and 127 observations for Interface B were analyzed.
Table 1: Average times in seconds taken for each interface.
| Interface-A (seconds) | Interface-B (seconds) | |
| Mute time (time between any alarm ON to click MUTE button) | 1.73 | 1.54 |
| Solution time (time between any alarm ON to solve the contingency (all alarm OFF)) | 19.51 | 21.51 |
| Acknowledge time (time between all alarm OFF to click the UNMUTE button) | 3.63 | 3.28 |
From the Table 1 results it is evident that Interface B took less time in both mute time and acknowledgement time. However, Interface A took slightly less time in solving the contingency. Interface A has a dedicated subpanel for alarms to the right side of the screen in Figure 8, with the display having individual indicators for bus voltage and line and generator overload violations. An enlarged version is shown in Figure 13. The Alarm light and the Mute-unmute pushbutton are in this subpanel. Interface B has the Alarm indicator and mute/unmute button in the upper right corner of the one-line diagram that is show in Figure 9. The overloaded device or bus voltage violation are noted by flashing bar graphs or lights on the one line at the location of the violation. An enlarged view of this part of the one-line is also shown in Figure 13. This difference between the alarm display and mute/unmute button location are considered to be the most likely cause of the differences in test results between the HMI’s.
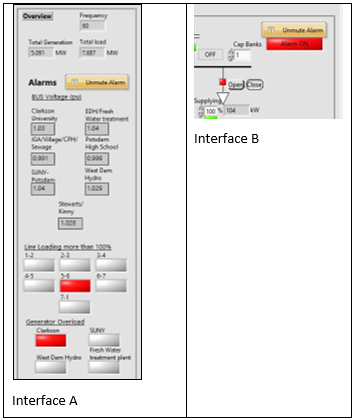
Figure 13: Interface B has an explicit alarm ON/OFF display section.
4.2. The direct measure of SA
SAGAT is a direct measure of SA. This is the human in the loop testing system. The simulation was frozen at several points in time. During this period, a series of questions are asked to the operators to determine his or her knowledge of the situation at the specific moment. Some advantages of the SAGAT technique are:
- it assesses global SA,
- avoids a retrospective recall,
- minimizes biasing,
- performs in a realistic environment.
On the contrary, some disadvantages of the SAGAT technique are that it requires stoppages in the scenarios. This may have a negative impact on the real-time scenarios. As this study is using simulated scenarios, the stoppages are not a factor.
Data were collected using a modified version of the SAGAT technique adopted from [18]. Participants got about five minutes of training to get used to the system/interface. Then simulated scenarios of line trip/outage followed by some voltage/line/generator overload occurred. In these cases, participants were not required to do any activity other than monitoring the system condition/s. A maximum of five halts was used to collect data. Each halt consists of ten queries, with a maximum time limit of two minutes permitted per halt. Each participant was surveyed using an online survey instrument (‘Google Forms’). Per standard SAGAT procedure, participants are barred from viewing operational information during the halt. Responses from the first halt were considered a training response. Each query was set based on the goals, decisions, and information requirements of the operators. Selected SAGAT questions and their level of SA’s are in (parenthesis):
- What is the approximate total load in MW? (L1)
- Is the Microgrid currently importing OR exporting energy? (L1)
- Are there any lines currently loaded between 80% – 100% (in Yellow condition)? (L2)
- At this moment which Buses are in voltage violation (pu lower than 0.95 OR higher than 1.05)? (L2)
- Which buses have capacitor banks? (L1)
- Currently how many lines are in an outage state? (L2)
- How many lines are overloaded at this time? (L2)
- Are there any generators currently loaded over 100% (in Red condition)? (L2)
- Currently how many generators are set to manual control? (L1)
- Within the next 10 min, what do you think is going to happen about the load? (L3)
The actual system conditions are recorded at the time of the simulated halt. The accuracy of the responses are compared with the actual scenarios at that time. The time delay from the beginning of the simulation to each halt in different scenarios are presented in Table 2, 3 and 4 present SAGAT results from the experiment. Total response count is less for halt#1 and halt#5 because each participant with each display faces four halts. The very first response was considered as a training response, regardless of the interface type. Thus, if anyone is presented with ‘interface A’ first then the participants were given 4 more halt (up to 350 – 355 seconds). However, then for the ‘interface B’ the participants were given four halts (up to 268-277 seconds). The following questions were developed and used in this study to conduct the SAGAT measure:
Question 1 (What is the approximate total load in MW) results indicate better performance of ‘interface A’ than ‘interface B’. Total load is displayed in ‘interface B’ right in the middle of the screen whereas in ‘Interface A’ in one corner. It is possible that the positioning of this information on the screen can have an influence on this result.
Question 2 (Is the Microgrid currently importing OR exporting energy) results shows almost the same performance in both interfaces. It is observed that both interfaces have a similar look and positioning of this information. Question 3 (Are there any lines currently loaded between 80% – 100% (in yellow condition)?) ‘Interface A’ has significant preference over ‘interface B’. ‘Interface A’ has a separate section for alarm display. In contrast, participants had to scan all over the ‘interface B’ to get the pieces of information (check Figure 8 and 9. Question 4 At this moment which Buses are in voltage violation (pu lower than 0.95 OR higher than 1.05)?). The results demonstrate that ‘interface B’ better performed than ‘interface A’. ‘Interface A’ has a separate alarm section to display voltage violation information. However, ‘interface B’ displays flashing red light in voltage violation scenarios. Question 5 (Which buses have capacitor banks?) ‘Interface A’ has a clear preference over ‘interface B’. Observations are made that a separate section of capacitors in ‘interface A’ made the privilege over ‘interface B’. Question 6 (Currently how many lines are in an outage state?) same explanation as described under Question 3. Question 7 (How many lines are overloaded at this time?) same explanation as described under Question 3. Question 8 (Are there any generators currently loaded over 100% (in red condition)?) same explanation as described under Question 3. Question 9 (Currently how many generators are set to manual control?) ‘Interface A’ has little better performance over ‘interface B’. Notes are made that ‘interface A’ has the information’s displayed together at a place. In contrast, in ‘interface B’ participants had to scan through the full display to get the pieces of information. Question 10 (Within the next 10 min, what do you think is going to happen about the load?). ‘Interface B’ has little better performance over ‘interface A’. Note to be made is that, in terms of responses count this is negligible.
Table 2: Timing of the halts during the experiment
| Halt Number | Time delay of a halt in the simulated scenario, (seconds) |
| 1 | 70-75 |
| 2 | 150-152 |
| 3 | 230-240 |
| 4 | 268-277 |
| 5 | 350-355 |
Table 4 depicts that both on level 1 and level 2, ‘interface A’ performed better than ‘interface B’. However, level 3 results show almost similar performance on both the interfaces. However, note that there is only one level 3 question (Q10) in this study, and further SA testing at level 3 is indicated.
Table 3. SAGAT Results by Question
| Interface A | Interface B | |||||
| Questions | Wrong res-ponse | Total res-ponse count | % Error | Wrong res-ponse | Total res-ponse count | % Error |
| 1 | 3 | 105 | 2.9 | 11 | 105 | 10.5 |
| 2 | 15 | 105 | 14.3 | 16 | 104 | 15.5 |
| 3 | 21 | 105 | 20.0 | 35 | 104 | 33.5 |
| 4 | 22 | 105 | 20.9 | 17 | 105 | 16.5 |
| 5 | 9 | 105 | 8.6 | 15 | 104 | 14.4 |
| 6 | 12 | 105 | 11.4 | 20 | 104 | 19.2 |
| 7 | 14 | 105 | 13.3 | 24 | 104 | 23.1 |
| 8 | 3 | 105 | 2.9 | 9 | 104 | 8.7 |
| 9 | 18 | 105 | 17.1 | 21 | 104 | 20.2 |
| 10 | 17 | 105 | 16.1 | 16 | 104 | 15.4 |
Table 4. SAGAT results showing SA level performance.
|
||||||||||||||||||||||||||||||||||||||||
5. Conclusion
Both power system and microgrid interfaces should communicate the necessary information in a helpful format at the appropriate time in order to promote adequate situational awareness. For the Potsdam, NY microgrid, four HMI concepts were developed, and two human-machine interfaces were simulated and tested using a human-centered design approach. This paper provides detailed information about the design, development, and evaluation process. Both direct and indirect measures are used to evaluate the designed interface. Study results underscore the importance of both direct and indirect measures while doing human factors testing. The indirect/performance measures showed better performance of Interface A in solving the contingency, while Interface B scored better in the muting and acknowledging time tests. The direct/SAGAT method provided further evidence participant performance was more accurate with Interface A than Interface B.
Acknowledgement:
This work was supported by the National Science Foundation, Project 1534035 “PFI:BIC Developing Advanced Resilient Technology to Improve Disaster Response Capability.”
- M. H. Mahfuz, T. Ortmeyer, and E. Hall, “Development of a Microgrid Controller Interface Using Human-Centered Design Approach,” in IEEE Power and Energy Society General Meeting, 2022. doi: 10.1109/PESGM48719.2022.9917191.
- P. M. Salmon et al., “What really is going on? Review of situation awareness models for individuals and teams,” Theor Issues Ergon Sci, vol. 9, pp. 297–323, 2008.
- M. R. Endsley and D. G. Jones, “What Is Situation Awareness?,” in Designing for Situation Awareness, CRC Press, 2011, 13–30. doi: doi:10.1201/b11371-4 10.1201/b11371-4.
- J. D. Weber and T. J. Overbye, “Voltage contours for power system visualization,” IEEE Transactions on Power Systems, 15, 404–409, 2000, doi: 10.1109/59.852151.
- M. R. Endsley and E. S. Connors, “Situation awareness: State of the art,” in 2008 IEEE Power and Energy Society General Meeting – Conversion and Delivery of Electrical Energy in the 21st Century, IEEE, Jul. 2008, 1–4. doi: 10.1109/PES.2008.4596937.
- E. S. Connors, “Situation awareness for the power transmission and distribution industry,” in EPRI’s XIII annual power switching safety and reliability conference and seminar, 2009.
- C. Tu, X. He, Z. Shuai, and F. Jiang, “Big data issues in smart grid – A review,” Renewable and Sustainable Energy Reviews, 79, 1099–1107, 2017, doi: https://doi.org/10.1016/j.rser.2017.05.134.
- C. Schneiders, J. Vanzetta, and J. F. Verstege, “Enhancement of situation awareness in wide area transmission systems for electricity and visualization of the global system state,” in 2012 3rd IEEE PES Innovative Smart Grid Technologies Europe (ISGT Europe), 2012, 1–9. doi: 10.1109/ISGTEurope.2012.6465665.
- G. Andersson et al., “Causes of the 2003 major grid blackouts in North America and Europe, and recommended means to improve system dynamic performance,” IEEE Transactions on Power Systems, 20(4), 1922–1928, 2005, doi: 10.1109/TPWRS.2005.857942.
- M. R. Endsley and D. G. Jones, “User-Centered Design,” in Designing for Situation Awareness, CRC Press, 2011, 3–12. doi: doi:10.1201/b11371-3 10.1201/b11371-3.
- M. Endsley and D. Jones, “Design Process,” in Disigning for situation awareness, CRC Press, Taylor and Francis Group, 2011, pp. 43–60.
- S. Chipman, J. M. Schraagen, and V. Shalin, Introduction to cognitive task analysis. 2000.
- M. R. Endsley, “A Survey of Situation Awareness Requirements in Air-to-Air Combat Fighters,” Int J Aviat Psychol, 1993, doi: 10.1207/s15327108ijap0302_5.
- E. S. Connors, M. R. Endsley, and L. Jones, “Situation awareness in the power transmission and distribution industry,” in Proceedings of the Human Factors and Ergonomics Society Annual Meeting, SAGE Publications, 2007, 215–219.
- S. Few, Now You See It: Simple Visualization Techniques for Quantitative Analysis, 1st ed. USA: Analytics Press, 2009.
- M. R. Endsley and D. G. Jones, “Evaluating Design Concepts for SA,” in Designing for Situation Awareness, CRC Press, 2011, 259–284. doi: 10.1201/b11371-18.
- A. M. Rich, D. A. Wiegmann, and T. J. Overbye, “Visualization of power systems data: A human factors analysis,” PSERC, 2001.
- M. R. Endsley, “Measurement of Situation Awareness in Dynamic Systems,” Human Factors: The Journal of the Human Factors and Ergonomics Society, 37(1), 65–84, 1995, doi: 10.1518/001872095779049499.