Analysis of Linear and Non-Linear Short-Term Pulse Rate Variability to Evaluate Emotional Changes during the Trier Social Stress Test

Adv. Sci. Technol. Eng. Syst. J. 8(3), 69–79 (2023);
 DOI: 10.25046/aj080309
In conjunction with psychological stress, physiological indicators such as heart rate (HR) and heart rate variability (HRV) are frequently employed. This study uses a substitute for heart rate variability (HRV) known as short-term pulse rate variability (PRV) to evaluate emotional changes. We examined sixteen college students using a low-cost photoplethysmograph and obtained a short-term PRV reading from one of their index fingers. Each PRV’s parameters during resting condition were established using a particular Trier Social Stress Test (TSST) and divided into four phases (R1: baseline rest, R2: anticipatory stress, R3: stressful event, and R4: recovery period). The Positive Affect and Negative Affect Schedule (PANAS) questionnaire was used to assess the participants’ moods during the experiment. The psychological assessment based on PANAS shows that negative affect tends to increase along the TSST procedure, especially from the baseline rest (R1) to the stressful event (R3), even though it is not statistically significant (p > 0.05). The physiological assessment using PRV revealed that between R1 and R3, the short-term SDRR, pNN50, RMSSD, LF, HF, total power, SD1, and elliptical area of PRV tended to rise considerably (p < 0.01). The properties of PRV show that the heart rate fluctuation also represents psychological changes. We concluded that applying the TSST procedure to induce stress modulates the features of PRV, particularly the time and frequency domain variability properties. Observed patterns following stressful events (interview sessions) indicated an increase in PRV values, mainly the RMSSD, HF, SD1, and elliptical area (p < 0.001). Caution should be applied while perceiving physiological alterations as an immediate sign of mental threats. Nonetheless, these alterations are likely caused by the association between stress and negative emotions.
1. Introduction
Individuals may encounter a variety of stressful situations in daily lives, and if not managed correctly, these events can have adverse effects [1]. Negative emotions, such as anxiety, fear, and anger, are the primary reasons for certain psychological states and the negative reactions resulting from stress [2]. Negative emotions can also shorten attention spans and reduce concentration [3]. Mental stress is spreading rapidly in modern society, permeating practically all aspects of daily life [4]. Therefore, stress is re ceiving much attention in contemporary society, as most people in developed countries regularly endure physical or psychological symptoms caused by stress [5]. Additional symptoms include persistent illness, fatigue, and headaches [6].
Furthermore, stress is already recognized as a mutually beneficial connection between individuals and the surroundings, that strains or exceeds an individual’s ability to cope. Harmful, frightening, or unpleasant circumstances frequently causes stress, leading to anger, embarrassment, and anxiety, showing a connection between stress and emotion [7]. According to researchers, the link between stress and negative emotions is inexorably linked. For instance, some research suggests that depression is a stress reaction [8, 9]. Similarly, stress can foster the onset of disease by compromising the immune system as it worsens [10]. Consequently, it is essential to address the source of tension. Additionally, developing a system that can readily and accurately evaluate and detect mental stress and other negative emotions is crucial.
Modern methods have been developed for scientifically evaluating psychological changes. The most popular methods for evaluating psychological traits involve completing surveys, scheduling consultations with psychologists, or evaluating online encounters during the pandemic. However, these procedures are time-consuming, expensive, and not always practical for everyone. Inconsistency in filling out the response sheets and failing to understand the instructions render questionnaires worthless as objective assessments [11-13].
Psychophysiological studies have been conducted to objectively improve the psychological assessment to observe how psychological changes can affect the physiological aspects. Thus, experimental studies were conducted to evaluate physiological responses after inducing stress or other emotions and moods. Most studies use a mental arithmetic test or another task demanding participants to accomplish it while measuring their body’s response. The Trier Social Stress Test (TSST) was established and developed more than two decades ago, and researchers have discovered that it has become one of the most prevalent methods for inducing stress under controlled conditions [14].
Another way to assess mental wellness accurately is by utilizing biochemical and hormone details. Objectively evaluating salivary cortisol levels is one of the best ways to measure psychological conditions associated with human physiology. It is predicated on a specific feeling or thought, such as stress, which releases cortisol and adrenaline stress hormones by activating the sympathetic nervous system and the hypothalamic-pituitary-adrenal (HPA) axis [15]. Cortisol is unreliable for quickly estimating mental stress because of the handling period and the possibility of inaccuracy during repeated measurements [16, 17].
Previous electrophysiological studies suggest that electric biosignals, such as trapezius muscle activity, electroencephalogram (EEG), and electrocardiogram (ECG) data, as well as an assortment of these methods, can be used to detect mental tension and a range of emotions [18]. Biosignals are seen as a practical, unbiased way to evaluate psychological changes because there are few psychological tests, and salivary cortisol preparation is technically challenging. Another issue is the wearable feature of evaluating psychological characteristics while engaging in ordinary tasks.
Notably, most of the previously described research used HRV parameters from standard ECG equipment as the objective assessment to extract the heart’s bio-signal information to quantify emotions or mental stress [18]. Regardless, the pulse rate variability (PRV) using photoplethysmography as an instrument for examination still has several limitations, particularly given its low-cost development. The fact that PRV cannot entirely substitute HRV in some circumstances is one of the main arguments against using it in place of an ECG [19, 20]. A wearable device for daily use may not be appropriate for ECG’s HRV since it requires numerous electrodes to be hooked to the body, which may be discomfiting for certain people. The latest research that utilized PPG to encounter the uncomfortable issue also showed that remote PPG (rPPG) could detect mental health conditions with 96% accuracy using the heart rate parameter during cognitive stress tasks [21]. This report shows that our proposed study is not the first time PPG has been used as a physiological tool to detect stress, and the development cost is also considered low. Therefore, more research is needed in this area to discover if PRV can be utilized to evaluate emotions or other psychological states throughout different settings.
The majority of studies on the TSST procedure still rely on through traditional heart rate measurement devices to quantify the physiological properties. However, the study that measured the pulse transit time (PTT) using the fingertip photoplethysmograph (PPG) and the electrocardiogram (ECG) during TSST sessions uncovered extensive information concerning the cardiovascular system that enabled observation of physiological changes after stress induction [22]. The most recent PPG result have a comparable capacity to identify mental stress as well as emotions, producing results with an accuracy of over 80%. Instead of using the Trier Social Stress Test (TSST) to exploit the susceptibility to the stress response, the majority of studies employed Mental Arithmetic Tests (MAT) and Stroop Tests to induce negative emotions [23].
This study aims to determine if stress inducement can affect negative emotions, as well as which interview events have the greatest impact on an individual’s mental state. To better quantify and objectively evaluate this relationship between physiological characteristics and emotions as a sign of mental stress , a more thorough understanding is necessary. Therefore, we recommend employing the Trier Social Stress Test (TSST) to induce psychological stress, assess the subsequent affective changes, and extend the biosignal analysis to measure mental stress. This study may demonstrate the importance of identifying emotional traits in addition to mental stress, which could contribute to incorrect diagnoses of various stress symptoms. In contrast to our previous findings, which only analyzed specific PRV parameters (time domain and linear analysis), we expand the study by applying the common objectives of PRV’s linear and non-linear, as well as the frequency domain analysis. The motivation is to discover additional parameters that can identify and better understand psychological changes.
Our previous study reported that a portable photoplethysmograph sensor could measure emotional changes after stress induction [24]. A low-cost device can objectively present emotional or mental changes based on physiological changes. As a result of our analysis of the pulse rate variability (PRV) time series, data revealed that RMSSD was the most crucial metric for capturing negative feelings and moods following the generated stress process. RMSSD was substantially higher after the main task or during the stressful event (R3) compared to before the interview or baseline rest (R1) (p < 0.01) [24]. We believe that additional linear and non-linear analysis could further explain the understanding of electrophysiological properties during stress or adverse effects from a psychological aspect in terms of the autonomic nervous system, even though our previous report already found a critical finding demonstrating physiological changes during mental state discrepancy.
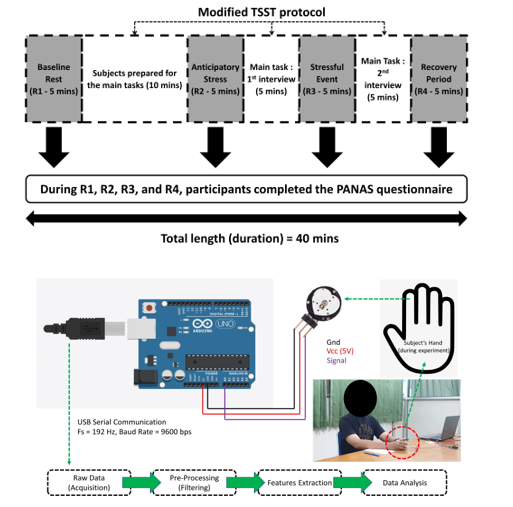
Figure 1 Trier Social Stress Test (TSST) experimental design and apparatus for evaluating psychological factors based on the Positive Affect Negative Affect Scale (PANAS) questionnaire and physiological properties [24]
2. Methods and Materials
2.1. Research Ethics
Prior to the conducting the investigations, the research topic and methodology were disclosed to the participants, and their informed consent was obtained. In pursuance of the principles of the Declaration of Helsinki, the Ethics Committee of the Faculty of Medicine at Universitas Islam Indonesia Yogyakarta approved this study (approval number 80/Ka.Kom.Et/70/KE/II/2019). The information of every subject’s was kept secure and confidential.
2.2. Participants and Procedures
This investigation included sixteen healthy male and female students between the ages of 19 and 21 who were participated in this study. The participants were undergraduate or graduate students majoring in social, medical, or engineering fields. Each participant signed an informed consent form. The participants declared in the informed consent document that they were in healthy condition, had not taken any regular medications before the studies, had slept well, had abstained from smoking, had normal weight based on Body Mass Index (BMI), and had no record of cardiovascular or other severe disorders in their families. Prior to involvement, the study was unknown to the participants, and the requirements of the entire procedure were confirmed by the research team during a short interview before signing the consent.
2.3. Experimental Design
The Trier Social Stress Test (TSST) Protocol created by Kirschbaum served as the foundation for the experimental design. We adjusted the protocol to consider regional preferences. The TSST standard protocol includes inducing psychological stress and monitoring the body’s reaction [25]. The meta-analysis suggested that TSST is a considerably valuable and relevant standardized protocol for examinations of stress hormone reactivity [26, 27]. The modification related to the language and scope focused on providing opportunities with specific needs and how to ensure the interviewer includes them in the list. The task subjects had to complete was applying for a special opportunity through interviews, and the interview conducted in the local language was required. The purpose of using the modified procedure is based on the significant limitation of TSST, which is considered to have a higher degree of habituation of the HPA axis response with repeated exposures [28, 29]. Thus, modification of TSST procedure is needed. The experiment was divided into seven distinct phases and took around 40 minutes.
Figure 1 depicts the entire experiment in detail. To evaluate the physiological condition, we retrieved the pulse rate signal during the rest condition to avoid any disruptions. We categorized the rest condition into four states: baseline rest (R1), anticipatory stress (R2), stressful event (R3), and recovery period (R4) [30, 31]. Baseline rest (R1) was an initial condition to record the participant’s current state before enrolling in the experiment. The anticipatory stress (R2) was a rest condition after each participant prepared for the interviews. The stressful event rest (R3) was a rest situation where the main task was held. Each participant met an interviewer and had a conversation. In the end, the recovery period (R4) was a rest state after completing all phases, and the debrief session was also held during that period. The stressful periods in segments R3 and R4 are crucial components of this procedure, where the duration of these stressful events is around ten minutes during the interviews to elicit psychological stress. Throughout the experiment, biosignals from the individuals were captured. To enhance the stress effect, we hired a professional interviewer who often did the main tasks as the interviewer.
2.4. Data Acquisition
From the commencement of the experiment during baseline rest (R1) to the conclusion of the primary task (R4), approximately 40 minutes of biosignals were collected. We utilized data from four different areas (R1, R2, R3, and R4), as shown in Figure 1. Figure 1 also demonstrates that a photoplethysmography (PPG) sensor was used to record biosignals and estimate short-term pulse rate variability (PRV) properties. During the investigation, the PPG sensor was attached to the index fingers of those who participated. We connected the sensor to an Arduino device, which captured the analog data (via the ADC interface), converted it to digital format, and then transmitted it to a computer at a sampling rate of 192 Hz and a transmission baud rate of 9600 bps. After obtaining the raw data, we extracted the features for subsequent analysis through pre-processing (filtering).
2.5. Data Processing and Feature Extraction
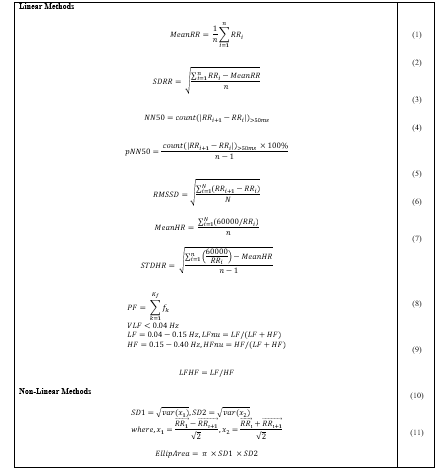
We ensure that there is no powerline interference by applying pre- and post-processing to the PRV signals of the participants. We utilized a digital band-pass filter to accommodate the 50–60 Hz frequency of the powerline. In addition, we used a low-pass filter with a cut-off frequency of 20 Hz to eliminate noise from the PPG’s pulse rate data. Each parameter can be found in Table 1. We extracted the short-term PRV parameters (5 minutes) consisting of the mean peak-to-peak (R-R) interval (MeanRR), heart-rate change deviations (SDRR/Standard Deviation of RR), NN50, pNN50, square root of the mean squared difference between adjacent R-R intervals (RMSSD), mean heart rate (MeanHR), and standard deviation of heart rate (STDHR). The analysis of these parameters is known as linear time-domain analysis. In addition, we demonstrated linear frequency-domain analysis, which included very low frequency (VLF), low frequency (LF), high frequency (HF), and total power (TotPower). We also derived the LF normalization units (LFnu), HF normalization units (HFnu), and the ratio of LF and HF (LFHF). Pulse rate variability analysis also serves the purpose of non-linear analysis. We utilized the Poincaré analysis by extracting the SD1 and SD2 parameters and then calculating the SD1 and SD2 ratio (SDrat) and elliptical area.
2.6. Psychological Assessments
We created the PANAS scale, which has positive and negative subscales, to evaluate the effects of psychological stress that has been intentionally caused [32]. We assessed respondents’ positive (interested, happy, tough, enthusiastic, proud, alert, inspired, diligent, considerate, active) and negative emotions (stressful, disappointed, guilty, fear, unfriendly, angry, embarrassed, nervous, anxious, worry) after the task using the TSST procedure during baseline rest (R1), anticipatory stress (R2), stressful events (R3), and recovery period (R4), which attempts to assess emotional changes in the negative direction or stress. The PANAS-based questionnaire asked sixteen participants to score their emotional state using twenty words covering positive and negative emotions during the TSST experiences. The twenty words were divided into ten descriptors expressing positive and negative sentiments and emotions in each subscale. The following are the five categories used to grade the questions based on the Likert scale: very irrelevant (1), irrelevant (2), neutral (3), relevant (4), and highly relevant (5). The most significant adverse effect suggests representing great psychological tension, and we calculated the questionnaire scores for positive and negative effects to quantify mental stress. The total score for each positive or negative feeling assessment can range from 10 to 50. Lower scoring means the corresponding emotion is less significant.
2.7. Data Analysis
We used the mean and standard error (SE) to present comprehensive data on the PANAS scale questionnaire’s score to analyze psychological effects and PRV’s parameters data to evaluate physiological traits. We employed the non-parametric Kruskal-Wallis test to identify the significant changes between states because the data would likely be less regularly distributed.
Table 1: The list of equations for the linear and non-linear analysis of pulse rate variability measurement
A p-value that was inferior to 0.05 was considered significant. We also employed the Bonferroni p-adjustment during the statistical
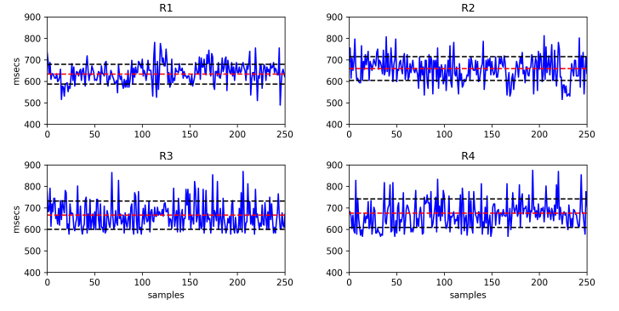
Figure 2: The raw data of peak-to-peak interval (RR) time series data from R1, R2, R3, and R4 on a subject (red dot line : average, black dot line : standard deviation)
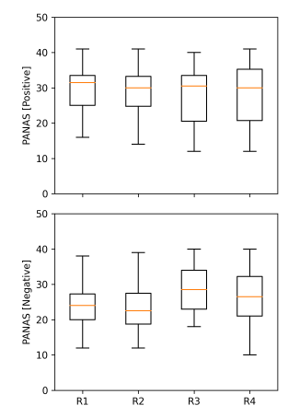
Figure 3: The psychological assessment using the Positive Affect Negative Affect Scale (PANAS) to evaluate the emotional changes PANAS [positive]: positive emotions; PANAS [negative]: negative emotions
test, including the multiple comparisons (posthoc) and correlation test. Python libraries were used to process entire data sets.
3. Results
3.1. Pulse Rate Variability Properties
Firstly, we examined the raw peak-to-peak interval time series to determine how the rest segments during baseline rest (R1), anticipatory stress (R2), stressful event (R3), and recovery period (R4) differed from one another before extracting and analyzing the features from the pulse-rate time series data. The PRV time series for each segment (R1, R2, R3, and R4) from a single subject are displayed in Figure 2. We can see in Figure 2 that there are no significant differences between segments in the peak-to-peak average of PRV values (MeanRR). The MeanRR increases from 633 msec in R1 to 660 msec in R2. During R3 and R4, the MeanRR continued to rise, reaching 666 and 676 msec, respectively. These findings show that the heart beats consistently more slowly after the primary task.
We also found that the gap between intervals expanded from baseline rest (R1) to recovery period (R4) as we observed the standard deviation from the RR array list. The standard deviation for R1 is 46 msec before the primary assignment (interview session), and R2’s is 56 msec. R3 and R4 were slightly stable at 66 msec after the preparation phase (R2). According to the data, the heart rate varies more during the stressful events (R3 and R4) than during the preparation portions of baseline rest and anticipatory stress sessions (R1 and R2).
3.2. Psychological Assessment during Stress Induction
Table 2 Summary of feature extraction (linear and non-linear methods) for physiological and psychological metrics
MeanRR: Mean of RR/NN (peak-to-peak) intervals, SDRR: Standard Deviation of RR/NN (peak-to-peak) Intervals, NN50: number of peak-to-peak intervals > 50 msec; pNN50: NN50 over total numbers of peak-to-peak; RMSSD: root mean square of successive differences, MeanHR: Mean of Heart Rate, STDHR: Standard Deviation of Heart Rate, LF: low-frequency, HF: high-frequency, LFHF: ratio of LF over HF; LFnu: low-frequency normalized unit; HFnu: high-frequency normalized unit; TotPow: total power, VLF: very-low-frequency, SD1: standard deviation perpendicular to the line of identity; SD2: standard deviation along the line of identity; SDrat: ratio of SD1 over SD2. EllipArea: elliptical area. |
||||||||||||||||||||||||||||||||||||||||||||||||||||||||||||||||||||||||||||||||||||||||||||||||||||||||||||||||||||||||||||||||||||||||||||||||||||||||||||||||||||||||||||||||||||||||||||||||||||||||||||||||||||||||||||||||
Figure 3 illustrates that the positive affect (PA) scores remained constant throughout all rest conditions, with an average score of around 28.59 within the range of 28 to 31 (R1, R2, R3, and R4). These findings indicate that participants were able to continuously regulate their emotions under various experimental conditions. However, individuals’ negative effect scores varied amongst the various rest scenarios after stress induction. Although the significance test p-value was higher than 0.05, the scores increased from 23 at the start of the trial to 29 at its completion. There was a difference in the negative effect score between the baseline rest (R1) and stressful event when the assessments were made after the interviews (R3) (p = 0.72) and recovery period after the interviews (R4) (p = 1). However, no observable differences were found between the stressful period and after interviews (R3, R4), as well as the initial baseline rest (R1) and anticipatory stress period (R2).
These results revealed that the PANAS assessment could reliably identify the increase in negative emotions adhering to stress exposure. The effects of this subjective assessment should be contrasted to physiological data.
3.3. Physiological Assessment during Stress Induction
We performed a short-term PRV analysis for each resting condition (R1, R2, R3, and R4) for 5 minutes. The linear method consists of the time and frequency domain analysis, while the non-linear analysis is based on Poincaré representing the geometrical analysis. We presented the linear and non-linear analysis features in Table 1 and provided the overall parameter summary in Table 2.
We compared the time domain characteristics that we retrieved, such as MeanRR, SDRR, RMSSD, NN50, pNN50, MeanHR, and STDHR, between the baseline rest (R1) and anticipatory stress (R2) to the main task as the stressful event (R3) and recovery period (R4), where the parameters frequently increased. When compared to R1 and R2, where the values were lower, the average of MeanRR during R3 and R4 is higher than 700 msec. As a result, following the interviews, the heart rate decreased to less than 85 beats per minute. The variations in pulse rate variability for SDRR, RMSSD, and STDHR also increased.
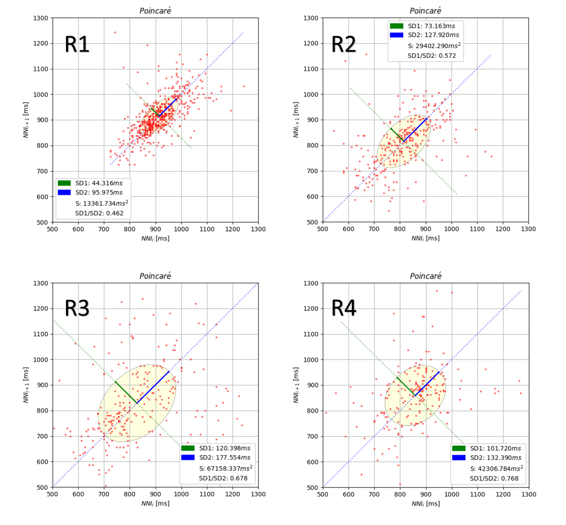
Figure 4 The Poincaré properties (SD1, SD2, and elliptical area) during R1, R2, R3, and R4
We discovered that R3 and R4 had more significant overall frequency components than R1 and R2. In contrast to the low-frequency component, the high-frequency component is more interesting. As a result of the interviews, the LF to HF ratio is lower, indicating that during the assignment, sympathetic activity predominated over parasympathetic activity.
Since the parameters, especially SDRR and RMSSD, had comparable characteristics, we discovered that the characteristics of SD1, SD2, and elliptical area are equivalent to the deviation of time series parameters. Figure 4 illustrates Poincaré properties on a topic during R1, R2, R3, and R4. As we can see, following the preparation stages, the distribution of the RR time series is dispersed. The SD1 parameter follows the R2 by more than 100 msec and is followed by a larger elliptical area by more than 30000 msec2.
To assess the significance of the link between the various resting states (R1, R2, R3, and R4), we evaluated all parameters using both the linear and non-linear methods. Figure 5 demonstrates that the differences between resting state segments are mostly found at the baseline rest (R1) and stressful event (R3), the baseline rest (R1) and recovery period (R4), and the anticipatory stress (R2) and stressful event (R3). From the baseline rest (R1) to the stressful event (R3), the features that distinguish R1-R3 significantly with p-values less than 0.01 are SDRR (p = 0.0016), pNN50 (p = 0.0021), RMSSD (p < 0.0001), LF (p = 0.0097), HF (p = 0.0002), total power (p = 0.0029), SD1 (p < 0.0001), SD2 (p = 0.0420), SD ratio (p = 0.0046), and elliptical area (p = 0.0005).
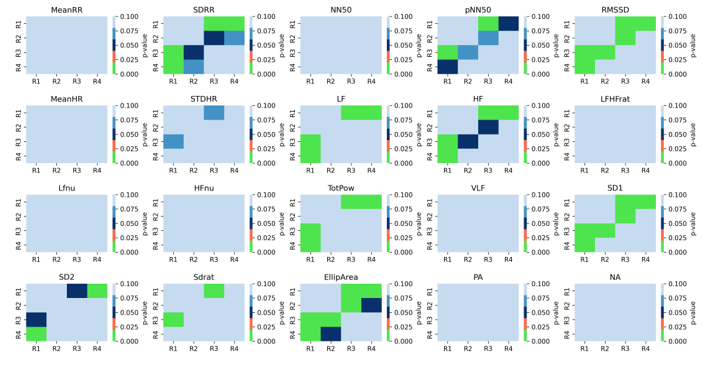
Figure 5 Multiple-comparison statistical test to evaluate the physiological and psychological evaluation under conditions R1, R2, R4, and R4. The color of the heatmap represents the p-value for each pair of comparisons
According to the baseline rest (R1) and recovery period (R4) segments, the features that discriminate the two segments (R1-R4) are SDRR (p = 0.0023), RMSSD (p = 0.0026), LF (p = 0.0097), HF (p = 0.0014), total power (p = 0.0015), SD1 (p = 0.0026), SD2 (p = 0.0077), and elliptical area (p = 0.0019).
Other of the PRV’s features that can be utilized to separate between the anticipatory stress segment (R2) and stressful event (R3) are RMSSD (p = 0.0061), SD1 (p = 0.00611), HF (p = 0.0471), and elliptical area (p = 0.0166). The elliptical area can also differentiate the anticipatory stress (R2) and recovery period (R4) with a p-value of 0.0471.
In general, with various PRV parameters that can distinguish two segments (R1-R3, R1-R4, R2-R3, and R2-R4), the most sensitive physiological parameters are RMSSD, HF, SD1, and elliptical area (p < 0.001). Finally, we found that the statistical results point out that the baseline rest (R1) and stressful event (R3) are considered to be able to elicit psychological changes, followed by the baseline rest (R1) and stressful periods (R4).
3.4. Correlation between the physiological and psychological measurement
We performed a correlation analysis to determine the relationship between the negative emotions measured by the PANAS scale and the overall linear and non-linear PRV properties. Since the negative effects of the PANAS questionnaire raise differences between segments, PRV features tend to follow the changes in subjective evaluation in the opposite direction. We established a correlation analysis using all segments and on each segment of R1, R2, R3, and R4. We combined the PRV features values from the overall segment and correlated them to the negative effects of PANAS. We found no correlation between the PRV features and negative scores. We also employed the correlation analysis on each segment and found that only the recovery period (R4) presents a good negative correlation on low- frequency component (LF) (correlation = -0.6; p = 0.0142) and total power (correlation = -0.5; p = 0.0412). We concluded that an increasing negative affect score represents a lower power of frequency components on physiological measurement during a specific segment (recovery period/R4).
4. Discussion
Our proposed study employs heart rate variability (HRV) to measure physiological changes induced by purposefully inducing mental stress. We used a low-cost portable photoplethysmograph (PPG) sensor to retrieve the pulse rate and extract the pulse rate variability (PRV) properties as the surrogate for HRV, which necessitates a heart rate sensor on the chest. To see how the physiological traits relate to the psychological changes, we fully exploited the features of PRV using linear and non-linear analysis. Instead of having participants perform commonly used particular tasks, we developed a modified Trier Social Stress Test (TSST) protocol to create a naturally stressful situation. To further our understanding, we compared the findings with those from earlier studies and confirmed several results.
Pulse rate variability (PRV) is considered a tool to surrogate heart rate variability (HRV) [33, 34]. HRV changes are already known as part of the autonomic nervous system modulation changes [35]. A psychological stimulus triggers an autonomic response in panic disorder, including flushing, tachycardia, palpitations, hypertension, and gastrointestinal symptoms. The autonomic response may occasionally disappear by repeatedly exposing ourselves to the stimuli in comforting conditions. Salivation, stomach motility, and acid secretion can all be induced by food-related thoughts. When stress activates the sympathetic nervous system, norepinephrine is mainly released at the synaptic junction with the enteric nervous system, which decreases GI motility [36]. Therefore, using PRV’s parameters is considered a meaningful way to represent stress and how physiological changes affect the autonomic nervous system.
The RMSSD, SD1, and elliptical area of the PRV were the parameters that were most sensitive to differentiate between before (baseline rest (R1) and anticipatory stress (R2)) and after inducing stress (stressful event (R3) and recovery period (R4)) (p < 0.01), followed by SDRR, pNN50, LF, HF, and total power (p < 0.05). We discovered that the negative emotions that occurred corresponded to these parameters. The peak-to-peak interval was primarily observed to decrease in stressful circumstances in prior studies [37]. Another study demonstrated that the heart rate of HRV rose in response to feelings of relaxation and fear, but no other measures showed any discernible variations [38]. In our opinion, stress or other negative circumstances are more closely related to changes in HRV than changes in heart rate. Therefore, a declining heart rate (lower peak-to-peak interval) might not indicate psychological adjustments. Otherwise, it could be a good idea to investigate the variance of the peak-to-peak interval in the future.
According to the feature extraction, the PRV variants SDRR, RMSSD, and SD1 better differentiate between psychological states before and after stressful events (R3). The high-frequency component (HF), which reflects sympathetic activity, best represents the SDRR, RMSSD, and SD1 [39]. Before the interview session, as the stressful events, the baseline rest (R1) and anticipatory stress (R2) demonstrate that mental tension and negative feelings were present and extended before the main stress events (R3) and recovery period (R4). Our data demonstrate that the changes of PRV had lower values before the stressful period during the main task (R1, R2) than after the interview (R3, R4). It implies that the primary task (assessing anxious sensations) is completed first, followed by mental tension and negative emotions verified through a questionnaire. As a result, the physiological aspect becomes more crucial to analyze as an objective measurement and takes precedence over the subjective assessment.
The PANAS scale can only measure psychological shifts in positive and negative directions while recognizing positive and negative feelings through a numerical score. Although emotion and stress can be associated, it is essential to consider whether the results of this study represent changes in emotion or stress itself because they showed the same negative sentiments as prior reports when stress was induced [3]. Additionally, the study we suggest offers fresh perspectives on assessing each component of happy and negative emotions to provide a helpful study of mental stress needed to create an objective physiological measuring system. The findings of this study imply that although stress and particular unpleasant emotions are connected and share similar physiological characteristics, alterations in physiological signals during stress induction cannot be utilized alone to quantify stress directly. However, stress symptoms, such as alterations in negative emotions, are the primary driver of physical changes and should be investigated to identify the emotions that lead to mental stress.
Based on our results of proposed study, we can confirm that that the stressors are affecting the changes in HRV properties, even though we are using PRV as a surrogate [21,40]. The variability of PRV’s properties represents the changes in both linear and non-linear parameters corresponding to psychological changes. However, we observed that the stressful event (R3) tends to increase the PRV’s parameters (RMSSD, pNN50, and elliptical area), whereas previous studies reported that the properties tend to decrease [18]. During the stress-induced procedure using the TSST protocol, the cardiovascular characteristics change before the stressful event (R1/R2), where they have lower feature properties. The features rise after the anticipatory stress (R3/R4), which means that our study does not contradict the previous findings because the lower HRV properties were found before the stressful events and started to increase during the recovery period after inducing the TSST procedure. To strengthen the findings, we need further studies to establish a more extended observation period where we utilize the daily stress recording and assessment.
5. Conclusion
During stress induction, the modified TSST protocol reliably induced negative emotions in subjects, as demonstrated by this study. The majority of short-term PRVs for SDRR, pNN50, RMSSD, LF, HF, total power, SD1, and elliptical area exhibited increased activity in correlation with negative emotion levels (p < 0.01). This study implies that negative emotions, believed to be a symptom of mental stress, increased immediately from the baseline condition following the first interview session (after inducing stress). In addition, significant differences were observed only between the onset of the resting state or baseline rest (R1) and after the interview as stressful events (R3). As adverse effects increase, the parameters demonstrate an increase in sympathetic activity based on their overall characteristics. In addition, the undesirable physiological properties observed were identical to the mental stress-related alterations reported in previous studies. Future research should examine the detection of mental tension from the viewpoint of adverse emotions.
Conflict of Interest
The authors declare no conflict of interest.
Acknowledgment
The Directorate of Research and Community Service, Universitas Islam Indonesia, Yogyakarta, as an Excellence Interdisciplinary Research Program with grant number 014-Dir-DPPM-70-PUPT-PIII-XII-2018, financially funded this work. We also want to express our highest gratitude to the participants who have willingly joined this study.
- J. Du, J. Huang, Y. An, and W. Xu, “The Relationship between stress and negative emotion: The Mediating role of rumination,” Clinical Research and Trials, 4(1), 2018, doi: 10.15761/crt.1000208.
- J. Lee and S.K. Yoo, “Recognition of Negative Emotion Using Long Short-Term Memory with Bio-Signal Feature Compression,” Sensors, 20(2), 573, 2020. doi: 10.3390/s20020573.
- C. Degroote, A. Schwaninger, N. Heimgartner, P. Hedinger, U. Ehlert, and P. H. Wirtz, “Acute stress improves concentration performance: Opposite effects of anxiety and cortisol, “Experimental Psychology, 67(2), 88-98, 2020. doi: 10.1027/1618-3169/a000481.
- H. Selye H, The stress of life. McGraw-Hill, New York, 1956.
- American Psychological Association, “Stress in America: The State of Our Nation,” Stress in America TM Survey, 2017.
- S. Singh, and A. Vats,” Impact of physiological and psychological stress on students, “Headache, 9(4), 111-113, 2020.
- R. S. Lazarus, Psychological Stress and the Coping Process. Mcgraw-Hill, 1966.
- J. K. Kiecolt-Glaser, L. McGuire, T. F. Robles, and R. Glaser, “Emotions, Morbidity, and Mortality: New Perspectives from Psychoneuroimmunology,” Annual Review of Psychology, 53(1), 83–107, 2002, doi: 10.1146/annurev.psych.53.100901.135217.
- E. M. Sternberg, “The Stress Response and the Regulation of Inflammatory Disease,” Annals of Internal Medicine, 117(10), 854, 1992, doi: 10.7326/0003-4819-117-10-854.
- A. Seiler, C. P. Fagundes, and L. M. Christian, “The impact of everyday stressors on the immune system and healthm,” In Stress Challenges and Immunity in Space, Springer, Cham, 71-92, 2020.
- S. Gamonal-Limcaoco, E. Montero-Mateos, M. T. Lozano-López, A. Maciá-Casas, J. Matías-Fernández, and C. Roncero, “Perceived stress in different countries at the beginning of the coronavirus pandemic,” The International Journal of Psychiatry in Medicine, 009121742110337, 2021, doi: 10.1177/00912174211033710.
- C. Joaquim, T. Luzia, H. A. Michael, P. M. O Fransisco, D. A. Silvia, A. Pedro, S. H. Aaron, S. Berta, “Negative affect and stress‐related brain metabolism in patients with metastatic breast cancer,” Cancer, 126(13), 3122-3131, 2020. doi: 10.1002/cncr.32902.
- O. Bălan, G. Moise, L. Petrescu, A. Moldoveanu, M. Leordeanu, and F. Moldoveanu, “Emotion Classification Based on Biophysical Signals and Machine Learning Techniques,” Symmetry, 12(1), 21, 2020. doi: 10.3390/sym12010021.
- D. E. Eagle, J. A. Rash, L. Tice, and R. J. Proeschold-Bell, “Evaluation of a remote, internet-delivered version of the Trier Social Stress Test,” International Journal of Psychophysiology, 2021, doi: https://doi.org/10.1016/j.ijpsycho.2021.03.009.
- C. Hartling, Y. Fan, A. Weigand, I. Trilla, M. Gärtner, M. Bajbouj, and S. Grimm, “Interaction of HPA axis genetics and early life stress shapes emotion recognition in healthy adults,” Psychoneuroendocrinology, 99, 28-37, 2019. doi: 10.1016/j.psyneuen.2018.08.030.
- L.M. Glenk, O. D. Kothgassner, A. Felnhofer, J. Gotovina, C. Pranger, A. N. Jensen, and E. Jensen-Jarolim, “Salivary cortisol responses to acute stress vary between allergic and healthy individuals: the role of plasma oxytocin, emotion regulation strategies, reported stress and anxiety,” Stress, 23(3), 275-283, 2020. doi: 10.1080/10253890.2019.1675629.
- M. Cohen, and R. Khalaila, “Saliva pH as a biomarker of exam stress and a predictor of exam performance,” Journal of psychosomatic research, 77(5), 420-425, 2014. doi: 10.1016/j.jpsychores.2014.07.003.
- G. Giannakakis, D. Grigoriadis, K. Giannakaki, O. Simantiraki, A. Roniotis and M. Tsiknakis, “Review on psychological stress detection using bio-signals,” IEEE Transactions on Affective Computing, 2019. doi: 10.1109/TAFFC.2019.2927337.
- E. Mejía-Mejía, K. Budidha, T.Y. Abay, J.M. May, and P.A. Kyriacou, “Heart rate variability (HRV) and pulse rate variability (PRV) for the assessment of autonomic responses,” Frontiers in physiology, 11, 779, 2020. doi: 10.3389/fphys.2020.00779.
- A. Sch fer, and J. Vagedes, “How accurate is pulse rate variability as an estimate of heart rate variability? A review on studies comparing photoplethysmographic technology with an electrocardiogram,” Int. J. Cardiol., 166, 15–29, 2013. doi: 10.1016/j.ijcard.2012.03.119.
- H. M. Morales-Fajardo et al., “Towards a Non-Contact Method for Identifying Stress Using Remote Photoplethysmography in Academic Environments,” Sensors, 22(10), 3780, 2022, doi: https://doi.org/10.3390/s22103780.
- S. Hey, A. Gharbi, B. Von Haaren, K. Walter, N. König, and S. Löffler, “Continuous noninvasive pulse transit time measurement for physiological stress monitoring” In Proc. 2009 International Conferencce on eHealth, Telemedicine, and Social Medicine, Cancun, Mexico, 2009, 113-116. doi: 10.1109/etelemed15088.2009.
- M. Zubair and C. Yoon, “Multilevel mental stress detection using ultra-short pulse rate variability series”, Biomedical Signal Processing and Control, 57, 2020. doi: 10.1016/j.bspc.2019.101736.
- A. Sahroni, N. Widiasmara, I. Miladiyah, and H. Setiawan, “Short-Term Pulse Rate Variability to Measure Changes in Emotion during Trier Social Stress Test,” 2022 9th International Conference on Information Technology, Computer, and Electrical Engineering (ICITACEE), 2022, doi: 10.1109/icitacee55701.2022.9923994.
- Kirschbaum C., Pirke KM, Hellhammer DH: The trier social stress test a tool for investigating psychobiological stress responses in a laboratory setting. Neuropsychobiol. 28, 76-81, 1993.
- M. A. Birkett, “The Trier Social Stress Test Protocol for Inducing Psychological Stress,” Journal of Visualized Experiments, 56, 2011, doi: https://doi.org/10.3791/3238.
- J. A. Seddon et al., “Meta-analysis of the effectiveness of the Trier Social Stress Test in eliciting physiological stress responses in children and adolescents,” Psychoneuroendocrinology, 116, 104582, 2020, doi: https://doi.org/10.1016/j.psyneuen.2020.104582.
- J. C. Pruessner, J. Gaab, D. H. Hellhammer, D. Lintz, N. Schommer, and C. Kirschbaum, “Increasing correlations between personality traits and cortisol stress responses obtained by data aggregation,” Psychoneuroendocrinology, 22(8), 615–625, 1997, doi: https://doi.org/10.1016/s0306-4530(97)00072-3.
- N. C. Schommer, D. H. Hellhammer, and C. Kirschbaum, “Dissociation Between Reactivity of the Hypothalamus-Pituitary-Adrenal Axis and the Sympathetic-Adrenal-Medullary System to Repeated Psychosocial Stress,” Psychosomatic Medicine, 65(3), 450–460, 2003, doi: https://doi.org/10.1097/01.psy.0000035721.12441.17.
- S. Schlatter, L. Schmidt, M. Lilot, A. Guillot, and U. Debarnot, “Implementing biofeedback as a proactive coping strategy: Psychological and physiological effects on anticipatory stress,” Behaviour Research and Therapy, 140, 103834, 2021, doi: https://doi.org/10.1016/j.brat.2021.103834.
- A. P. Allen, P. J. Kennedy, S. Dockray, J. F. Cryan, T. G. Dinan, and G. Clarke, “The Trier Social Stress Test: Principles and practice,” Neurobiology of Stress, 6, 113–126, 2017, doi: https://doi.org/10.1016/j.ynstr.2016.11.001.
- Brosschot, J. F., Thayer, J. F.: Heart rate response is longer after negative emotions than after positive emotions. International journal of psychophysiology. 50(3), 181-187, 2003.
- A. K. Verma, P. N. Aarotale, P. Dehkordi, J.-S. Lou, and K. Tavakolian, “Relationship between Ischemic Stroke and Pulse Rate Variability as a Surrogate of Heart Rate Variability,” Brain Sciences, 9(7), 162, 2019, doi: https://doi.org/10.3390/brainsci9070162.
- E. Gil, M. Orini, R. Bailón, J. M. Vergara, L. Mainardi, and P. Laguna, “Photoplethysmography pulse rate variability as a surrogate measurement of heart rate variability during non-stationary conditions,” Physiological Measurement, 31(9), 1271–1290, 2010, doi: https://doi.org/10.1088/0967-3334/31/9/015.
- J.-M. Grégoire, C. Gilon, S. Carlier, and H. Bersini, “Autonomic nervous system assessment using heart rate variability,” Acta Cardiologica,1–15, 2023, doi: https://doi.org/10.1080/00015385.2023.2177371.
- M. G. Ziegler, “Psychological Stress and the Autonomic Nervous System,” Primer on the Autonomic Nervous System, 291–293, 2012, doi: 10.1016/b978-0-12-386525-0.00061-5.
- H.-G. Kim, E.-J. Cheon, D.-S. Bai, Y. H. Lee, and B.-H. Koo, “Stress and Heart Rate Variability: A Meta-Analysis and Review of the Literature,” Psychiatry Investigation, 15(3), 235–245, 2018, doi: 10.30773/pi.2017.08.17.
- M. T. Valderas, J. Bolea, P. Laguna, M. Vallverdu, and R. Bailon, “Human emotion recognition using heart rate variability analysis with spectral bands based on respiration,” 2015 37th Annual International Conference of the IEEE Engineering in Medicine and Biology Society (EMBC), 2015, doi: 10.1109/embc.2015.7319792.
- F. Shaffer and J. P. Ginsberg, “An Overview of Heart Rate Variability Metrics and Norms,” Frontiers in Public Health, 5(258), 2017, doi: 10.3389/fpubh.2017.00258.
- K. Yoo and W. Lee, “Mental stress assessment based on pulse photoplethysmography,” 2011 IEEE 15th International Symposium on Consumer Electronics (ISCE), 2011, doi: https://doi.org/10.1109/isce.2011.5973841.