Measurement System for Evaluation of Radar Algorithms using Replication of Vital Sign Micro Movement and Dynamic Clutter

Adv. Sci. Technol. Eng. Syst. J. 8(3), 29–39 (2023);
 DOI: 10.25046/aj080304
In this paper we present a measurement system that is able to evaluate radar algorithms for vital signs sensing applications. For such medical applications, it is crucial to develop robust and reliable algorithms that are tested in a laboratory environment. The presented measurement system generates reproducible vital sign micro movement and dynamic clutter using loudspeakers to replicate realistic scenarios with two moving objects. It is described how realistic vital sign movement patterns are prepared using signal synthesis or recorded measurements, e.g. from a published dataset. The capability of the system to evaluate radar algorithms is demonstrated by investigating the impact of a beamforming algorithm on dynamic clutter. During the measurements presented in this paper, one loudspeaker replicates different vital sign movement patterns and the other loudspeaker creates dynamic clutter. It is shown that a digital beamforming improves the dynamic clutter rejection and leads to a better quality of the radar phase signal.
1. Introduction
This paper is an extension of work originally presented in the 44th Annual International Conference of the IEEE Engineering in Medicine and Biology Society (EMBC) [1]. The concept of both publications is to create repeatable and realistic scenarios for testing, comparing and optimizing different post processing algorithms for radar technology used in vital sign sensing scenarios. Those algorithms should be tested in corresponding laboratory environment before used in clinical studies or real world applications.
Research in radar technology for medical applications recently gains increased attention. The ability of radar sensors to measure movement and micro movement like vibration [2] or movement from vital signs [3] [4] [5] leads to many applications. Doppler cardiograms, for example, can be used for measurements that make significant conditions of the heart visible comparable to the electrocardiogram [6]. Another discussed application is respiration movement measurement for motion-adaptive cancer radiotherapy [7].
Medical scenarios have special requirements for the technology used. It is very important to have a robust and reliable system. The system has to be easy in use for medical professionals without creating a huge amount of additional work. This means, the system must be tolerant against inaccurate positioning, random body movement of the target person [8] [9], radar self-motion [10] and clutter. A challenge for many medical scenarios is the clutter of other moving or stationary objects in proximity to the person, whose vital signs are to be measured. FMCW radars can help to distinguish objects at different distances. A limitation of the field of view by using a dielectric lens or smart antennas with beamforming capabilities could reduce this problem further. However, the dielectric lens would require a very accurate positioning of the radar, and problems in measuring the target due to unconscious movements occurred. This can be improved in terms of achieving a more robust condition with digital beamforming in post processing. By applying digital beamforming in post processing, a wide angle range is recorded first and, then, the target angle can be found and tracked afterwards. In this paper, we will address the mentioned effect by introducing a measurement system for evaluating radar post processing algorithms, e.g. beamforming algorithms.
In contrast to the setup presented in our previous paper [1], the setup that will be introduced in the following will use a second loudspeaker to replicate clutter from a second moving object. The previous paper [1] introduced a setup to generate reproducible movement patterns analog to chest wall micro movement from vital signs. That setup consisted of a single loudspeaker actuated by a function generator. It was shown that the diaphragm deflection measured by radars is linear to the voltage applied to the loudspeaker. Although this means that accurate measurements of the replicated micro movement are possible with the presented setup in [1], the replication of more realistic vital sign micro movement is problematic with that setup, which was addressed by the reviewers and numerous readers at the conference. To meet this request in this present paper, we will describe a new hardware setup using more flexible signal generation.
A loudspeaker for the replication of vital signs is also used in [11]. Another approach for generating movement of vital signs is introduced in [12] and [13]. There, a mechanical chest model for testing a wearable device is used to measure the chest circumference change. The simulation of the chest circumference change is not necessary for testing radar sensors and algorithms because the radar would only measure the movements effective to its range. A simulation approach based on a mathematical model that simulates the chest wall movement is presented in [14]. The chest wall motion simulation is useful to develop new algorithms for medical diagnosis while we focus more on the algorithms of the radar signal processing.
In the following chapters, at first, we will describe the radar signal processing used in this paper. Afterwards, the hardware of the measurement setup will be presented as well as the generation of realistic movement signals. Then, the impact of dynamic clutter will be investigated and a digital beamforming algorithm is tested concerning its rejection of the dynamic clutter. Finally, realistic heartbeat movement from the clinical recorded dataset from Schellenberger [15] will be used.
2. Radar and Signal Processing
A moving target creates a Doppler shift, which can be measured by continuous wave radars [16] as well as by FMCW radars [17]. Using FMCW radar sensors, multiple frequency ramps have to be captured consecutively. After range FFT and target finder algorithm mentioned in section 2.2, the range difference ∆R results in a phase difference ∆Φ. The phase difference ∆Φ can be described as
![]()
using the wavelength λ [18]. The equation is unambiguous if −π < ∆Φ < π. Hence, larger macro movement of an object and a low sample rate of the phase signal can cause problems in measurements. It is also notably that only movement radial to the radar is measured.
2.1 Radar Hardware and Settings
During all measurements, the Radarbook2[1] from INRAS with the 77GHz RF77II-IFX-TX2RX16 D01 frontend is used. Figure 1 shows a picture of the radar frontend.
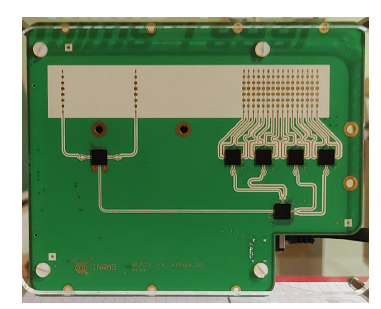
Figure 1: Picture of 77GHz frontend of Radarbook2.
The Radarbook2 with 77GHz frontend is configured according to the parameters depicted in Table 1. No further signal processing is done internally by the radar FPGA during the measurements conducted for this article. The raw ADC samples are transferred to the post processing device via LAN interface.
Table 1: Radar parameters and our default settings of Radarbook2 77GHz. These default values are used, if not otherwise specified.
| Radar antenna | Horizontal (RX, TX) | 76.5◦ |
| characteristic | Vertical (RX, TX) | 12.8◦ |
| 3dB beamwidth | No. of used TX channels | 1 |
| No. of used RX channels | 16 | |
| Mode of operation | FMCW | |
| Radar | EIRP | 3.2dBm |
| settings | ADC sample rate fs | 5MHz |
| Frame time TF | 5ms | |
| Samples per chirp N | 1024 | |
| Chirps per frame | 1 | |
| Start frequency fStart | 76GHz | |
| Chirp | Stop frequency fStop | 78GHz |
| configuration | Bandwidth B | 2GHz |
| N
Ramp up time TC = fs |
204.8µs | |
| B
Slope S = TC |
MHz
9.7656 µs |
2.2 Signal Processing
The key point of the presented measurement system is the evaluation of radar algorithms. This means that the software framework can be adapted to different algorithms used in different scenarios. In this work we use a post processing of the raw FMCW radar data as displayed in Figure 2.
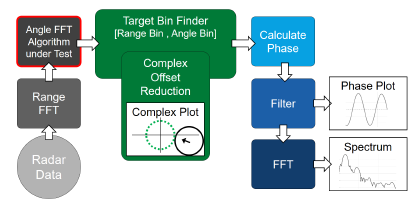
Figure 2: Block diagram of radar signal processing with angle FFT algorithm under test.
The first step in the signal post processing is a range FFT of the radar ADC data. The spectral lines of the range FFT stand for different distances. The range resolution or real bin width BinW can be calculated with
![]()
using the parameters presented in Table 1. Two different ob-
jects can only be distinguished if their distance to the radar has at least one bin width difference, otherwise they are measured as a single object. The distance R between radar and target object can be calculated with
![]()
using BinW and the index of the spectral line where the target object can be found called Bin.
In this paper we use zero padding to increase the number of spectral lines with a factor of four. So, the bin with zero padding BinZP result in Bin · 4 and the reading accuracy of the distance will be higher but the range resolution does not change.
The next step, which is highlighted with a red outline in the block diagram in Figure 2, is an optional digital beamforming algorithm. As mentioned in the introduction, digital beamforming is of special interest in this work and will be used to demonstrate the benefits of this measurement system. The used radar has 16 receiving channels, which allows to calculate a digital beamforming post processing algorithm. Further explanation of digital beamforming algorithm and clutter rejection with and without digital beamforming can be found in chapter 5.4.
Necessary in any case is a target bin finder. The easiest way is to find the bin with the maximal magnitude. However, in measurements with static clutter this could lead to a wrong range bin and angle bin. Moreover, the phase signal of the target can be distorted by static clutter. We use the complex offset reduction algorithm (COR) for elimination of static clutter as signal processing step shown in Figure 2.
After the range and angle FFT, the complex signals of a moving target without clutter will be on a circle in the complex plot. The center of the circle is in the point of origin. When the magnitude of the target is changing over time, the complex plot can show a helix but the center has to be in the point of origin. When the center of the complex signal is not in the point of origin, this is because of a second, not moving object in proximity to the target object, where the overall effect is attributed to static clutter. More about static clutter can be found in [17]. Our COR algorithm finds the complex offset and subtracts it from the complex signal. This will be done in an area around the previously found range bin and angle bin.
After COR, the target bin finder determines the correct maximal magnitude again and, then, outputs the target data at correct range and angle bin to the phase calculation. The phase signal is calculated using the arctangent function and a phase unwrapping. After the phase calculation, other signal processing algorithms can be used for performance tests, e.g. in medical applications. An example for a performance test of beamforming algorithms is presented in chapter 5 by calculating the clutter rejection with and without digital beamforming.
2.3 Measurement of Human Heartbeat and Respiration
Using the previously described radar sensor and signal post processing, we have done measurements with a sitting person. The person was sitting still on a chair with a distance of 60cm to the radar. The respiration and heartbeat curves are shown in Figure 3. The respiration measurement was recorded under resting conditions, and the heartbeat measurement was recorded during an apnea after exhalation scenario.
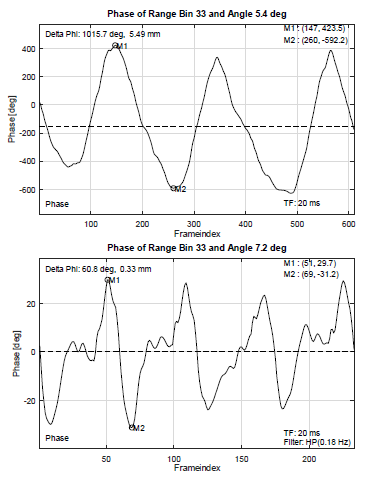
Figure 3: Radar measurements of human respiration (top) and heartbeat (bottom).
The movement amplitude of the respiration measurement is 5.49mm with a breathing rate of approximately 15 breaths per minute. For the heartbeat measurement, the movement amplitude is 0.33mm with a heart rate of approximately 52 beats per minute. The maximal movement that can be expected from the heartbeat is 0.6mm in average according to different studies mentioned in [19].
3. Hardware Setup
In this chapter, the hardware of the introduced measurement system is described. It is the foundation for the investigations of this work. In our previous work we evaluated a loudspeaker setup and different radar sensors in regard to the ability of replicating and recording micro movement from vital signs. The results showed that “the setup is particularly suitable for the generation of micro movement analog to CWmM[2] of vital signs. The diaphragm deflection is linear to the applied voltage […].” as outlined in [1]. This result is displayed again in Figure 4. The following sections describe the differences of the hardware used for the present paper.
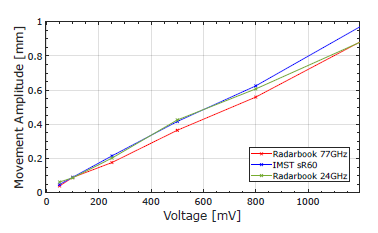
Figure 4: Measured micro movement using three radars at different voltage amplitudes on the loudspeaker. Figure from [1].
3.1 Loudspeaker
As mentioned in the introduction, the evaluation of beamforming algorithms is an important feature of the presented measurement system. In order to realize this, it is necessary to have two loudspeakers that can be positioned independently. In preparations of the measurements, we built two identically constructed casings for the low-frequency loudspeakers W 300 – 8 Ohm from Visaton[3]. The specifications of the loudspeaker include a maximal stroke of ±14mm and a DC impedance of 6.6Ω. The outcome is depicted in Figure 5.
We applied copper foil to both loudspeaker diaphragms. The diameter of the copper foil is 22.3cm, which is much larger than it was in the previous setup. A new feature, however, is the static foil ring around the diaphragm. The foil ring is used to shadow the inside of the loudspeaker that is not covered with the copper foil on the diaphragm. The static clutter that is resulting from the foil ring can be eliminated using the complex offset reduction mentioned in 2.2.
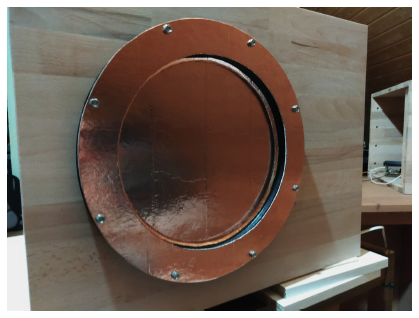
Figure 5: One of the new loudspeakers with copper foil on diaphragm and foil ring.
3.2. Amplifier
The loudspeakers need a suitable signal to generate a movement. In [1] a function generator is used to drive the loudspeakers, but this approach is very limited as mentioned before. A flexible strategy is necessary to reproduce real chest wall micro movement from vital signs. The best results were achieved using a sound card and an amplifier built for this measurement system. The amplifier is based on the TDA 2050 audio amplifier. All circuits that usually block low frequencies are excluded in the amplifier circuit. In Figure 6 you can see an amplifier.
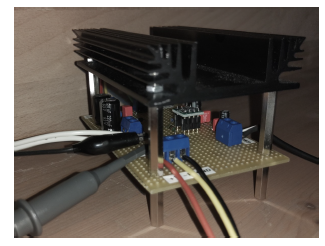
Figure 6: One of the new amplifiers.
The circuit also contains a low pass filter to prevent aliasing during the recording by the radar. The cut off frequency is currently adjusted to 10Hz. Furthermore, an attenuation is integrated for achieving very small movements with the full bandwidth of the sound card. Different attenuation factors can be used to optimize the system for different micro movements like heart beat and respiration. The movement achieved with the current configuration is up to 10mm using the full sound card’s dynamic range.
4. Signal Preparation for the Measurement System
The hardware described in the previous chapter needs audio signals to generate micro movement. In this chapter, we will explain how audio signals for our measurement system are generated. In our previous work, we took a simpler approach to generate movement with a loudspeaker. It is further described in [1]. There, we applied a waveform generator to generate the signal that moves the loudspeaker. The signal applied in the previous setup was a sine signal for replicating respiration movement and an asymmetric sine signal for replicating heartbeat movement. Unfortunately, this approach is limited in terms of replication of realistic vital sign micro movement or of special conditions of the pulmonary or cardiovascular system like diseases. Therefore, the generation of realistic signals was a key point in the development of the new measurement system.
Because the signals are all played back by a sound card, they have to be saved as regular audio files. For the measurements for this article, the audio files are saved in the uncompressed waveform audio file format (.wav). The signals are saved with a sampling frequency of 44100Hz and a resolution of at least 16 bits per sample.
4.1 Signal Synthesis
One strategy to generate movement signals is to synthesize them. It is possible to create a signal based on signature points and interpolation. Another approach is to use Fourier-synthesis for periodical signals.
For the signal synthesis we started with the generation of sine signals as fundamental oscillations. Those fundamental sine signals were used as signals during testing and calibration of the hardware setup. Additionally, in some measurements it is advantageous to use sine signals to show an investigated effect more clearly. This is why a sine signal is used for each loudspeaker during the investigation of dynamic clutter and beamforming algorithms that will be described in chapter 5.
By using Fourier-synthesis, periodical signals with higher complexity are created in the following:
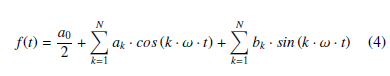
Figure 7 shows a synthesized heartbeat signal using 0.88Hz as fundamental oscillation and eight harmonics. The Fourier coefficients are a0=0, ak=0 and bk=[1.00, 0.97, 0.35, 0.06, 0.03, 0.03, 0.11, 0.06, 0.05] for k = 1,2, …, 9. The coefficients bk are optimized to synthesize a heartbeat movement signal based on the frequency components of the heartbeat movement measurement presented in chapter 2.3. It has much more resemblance to a real heartbeat micro movement than the asymmetric sine signal used with the previous setup in [1].
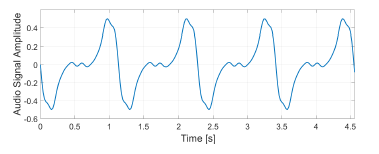
Figure 7: Pattern of heartbeat micro movement created with signal synthesis.
4.2 Vital Sign Micro Movement Patterns
For replication of real respiration and heartbeat movement, it is utterly important to use recordings of previous measurements as data source. Those recordings contain movement patterns of diseases and relevant conditions of the pulmonary or cardiovascular system, which are indispensable in the development of medical analysis and radar algorithms. Each measurement containing a movement pattern of the chest wall could be used independently of the technology that recorded those movement patterns. This gives us the opportunity to use published libraries of micro movement from vital signs. In our work we used the clinical recorded dataset published from Schellenberger in [15]. Figure 8 shows a heartbeat signal extracted from the dataset. The extracted part of the signal shows the heartbeat during apnea after exhalation from the measurement GDN0009 3 Apnea from the clinical recorded dataset.
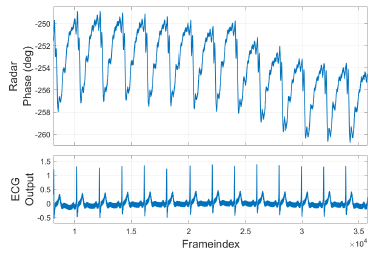
Figure 8: Heartbeat movement GDN0009 3 Apnea data from Schellenberger [15]. Top curve: Radar phase calculated from CW radar IQ values of the dataset. Bottom curve: Reference ECG measurement of the dataset.
The measurements were done using a 24GHz continuous wave radar. Also signals of synchronized reference sensors like three channel ECG and Continuous Noninvasive Arterial Pressure (CNAP) were recorded during each of their measurements. For more information on how the dataset is recorded please refer to [20] and [21]. The following paragraphs explain how to prepare previously recorded data containing chest wall micro movement to use them as signals for our radar measurement system.
The first step is to cut one part from the recorded measurement with the targeted length and content. If the signal contains decisive changes like the shift from respiration to heartbeat in an apnea after exhalation scenario, it would contain a DC offset during the heartbeat movement. This DC component will not be included in the played signal. The part of the heartbeat signal in Figure 8 starts with a QRS complex followed by the systole part of the cardiac cycle. The systole containing the contraction of the heart is visible as a falling edge in the radar phase signal of the dataset.
The next step is the scaling of the signal amplitude. For data recorded with radar sensors, the movement amplitude can be calculated using (1). Then the signal has to be scaled to the corresponding audio signal amplitude to generate the calculated movement amplitude. For special investigation or medical scenarios, movement amplitude can be increased or decreased during this preparation step. The movement amplitude of the dataset signal shown in Figure 10 as green curve was increased from 0.15mm to approximately 0.5mm.
After scaling the signal, it is necessary to adjust the sampling rate to 44100Hz. As mentioned in chapter 2 we are recording our measurements with a sampling frequency of 200Hz, and the measurements from the clinical recorded dataset published in [15] are recorded with a sampling frequency of 2kHz. That is, oversampling to 44100Hz is the next preparation step with additional low pass filtering to reduce oversampling artifacts. This filter also prevents aliasing during recording with the radar. Because of the typically configured frame time of 5ms the highest frequency in the movement signal must be lower than 100Hz. The signal is now ready to be used in the measurement system to generate realistic vital sign micro movement.
A performance test of our measurement system with play back of the prepared signal and recording with the radar was realized. Figure 9 shows the complex data of the radar recording with complex offset reduction.
Complex of Radar Measurement (black) and COR circle (green)
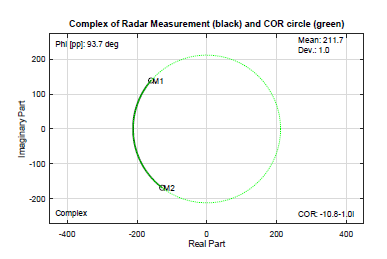
Figure 9: Complex signal of radar measurement (black) of realistic vital sign micro movement using the measurement system and COR circle (green).
Figure 10 shows the prepared signal and the recorded radar phase curve. When comparing both curves you can see, that the measured radar phase fits the prepared signal very good. Only the short peaks are decreased. These small differences between both curves are related to the low pass filter inside the amplifier that controls the loudspeaker mentioned in chapter 3.2. To allow higher frequency components, we have to increase the low pass cutoff frequency.
Phase of Radar Measurement (Curve 1) and Dataset Signal with Preparation (Curve 2)
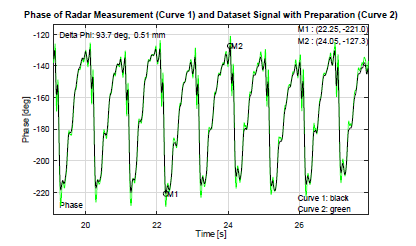
Figure 10: Schellenberger dataset signal after preparation (green) and the related phase curve of the radar measurement using our measurement system (black).
5. Investigation of Dynamic Clutter
All objects in the field of view of the radar sensor have an impact on the measured data. In real measurement scenarios, multiple objects are in the field of view and not all of them are static. Figure 11 displays the complex target signal and phase signal of a measurement with a second moving object close to the target object. A complex offset reduction as mentioned in chapter 2.2 is not able to reduce the clutter that is changing dynamically over time. This is called dynamic clutter. To investigate the effect of dynamic clutter, we created the following scenario with the hardware described in 3.
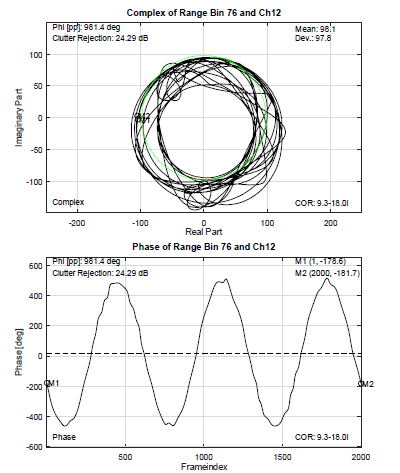
Figure 11: Complex and phase plot from dynamic clutter measurement in range binZP 76 without beamforming using the measurement scenario explained below.
5.1 Measurement Setup
To investigate the impact of dynamic clutter, we used two loudspeakers close to each other in our evaluation setup. They are positioned in different distances and different angles in front of the radar. Figure 12 shows a picture of the used measurement setup. The right loudspeaker is the target object, whose movement we want to measure, and is called target loudspeaker in the following chapters. It is placed at 150cm at an angle of -9◦ relative to the radar position. Angles left to the radar are defined as negative angles. The left loudspeaker is the additional moving object next to the target. It is used to generate the clutter movement and is called clutter loudspeaker in the following chapters. The clutter loudspeaker is placed at 130cm at an angle of -36◦.
The measurement setup is chosen to simulate realistic scenarios. The two loudspeakers stand in alike position and distance to each other mimicking a patient lying on a hospital bed and a healthcare professional standing next to the patient during a diagnostic measurement using a radar from above. In this scenario the patient is represented by the target loudspeaker, and the healthcare professional is represented by the clutter loudspeaker. For easier measurement using the loudspeaker setup, the arrangement is shifted to the horizontal plane with the radar standing in front of the loudspeakers instead of being mounted on the ceiling.
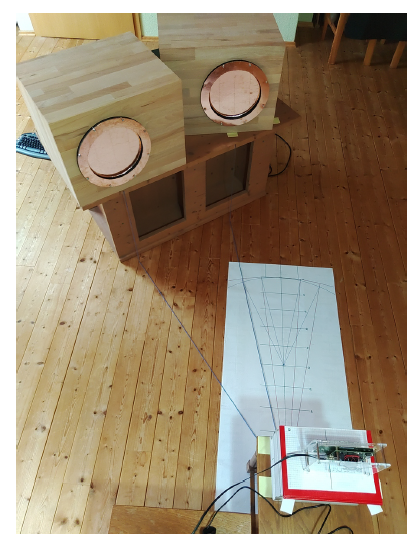
Figure 12: Picture of the measurement setup to investigate dynamic clutter with two loudspeakers.
5.2 Movement Signal
Each loudspeaker needs to play a suitable signal so that it is possible to investigate the impact of dynamic clutter. In this paper we present a measurement, in which each loudspeaker plays a sine signal. This ensures that the effect of dynamic clutter is not overlaid with other effects using more complex signals. The oscillation frequencies of the sine signals are chosen to fit usual respiration frequencies. With 0.3Hz frequency and a movement peak-to-peak amplitude of 5.2mm the target loudspeaker represents a typical respiration movement for resting humans, while the 0.5Hz sine with a movement peak-to-peak amplitude of 4.7mm on the clutter loudspeaker represents a faster respiration.
For the investigation of the dynamic clutter, it is important to compare the signal with dynamic clutter to a reference signal without clutter. Therefore, the clutter movement is not active the whole measurement time. Figure 13 shows the structure of the used audio signal. The full measurement time is 30s. The signal is designed to have three equal parts. At first, both signals are active and the signal with dynamic clutter can be examined. This part has to be the first part in the signal because the hardware setup including the amplifier with the low pass filter and the loudspeakers need some seconds before the measurement to settle to a stable state for those low frequencies. It is important to consider this settling time while generating the audio signal, but it will not be measured by the radar. In Figure 13 this settling time is not displayed. The middle part of the signal is used to turn off the signal of the clutter loudspeaker. After turning the clutter signal off, the hardware setup also needs a settling time, but it is shorter than the settling time after turning a signal on. The last part, named part C in Figure 13, of the measured signal is used as a reference. Only the 0.3Hz sine signal on the target loudspeaker is active.
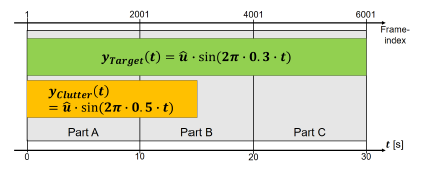
Figure 13: Audio signal during the dynamic clutter measurement.
Each part of the signal is 10s long and, therefore, three oscillations of the 0.3Hz target signal and five oscillations of the 0.5Hz clutter signal fit exactly in each part. This is very important for the subsequent processing of the radar measurement. There, the signal of “Part A” in Figure 13 is compared with the reference signal in “Part C”. This is only possible if both signals are in synchronized state. A synchronized state means that the signals are in the exact same state at the beginning of each part. Also the sampling of the radar phase signal has to fit to the synchronization, otherwise a systematic error would occur during the calculations described in the next section. With the radar frame time mentioned in Table 1 of 5ms, the synchronization points of the audio signal occur at the radar frame indices 1, 2001 and 4001.
5.3 Dynamic Clutter Rejection
The measurements for this investigation are realized with the Radarbook2 using the post processing presented in chapter 2.2. In the dynamic clutter rejection measurements, the COR algorithm is used slightly different than usual to achieve a better performance. For every bin, the COR algorithm finds the complex offset only using the signal “Part C” and uses this complex offset for all three signal parts. The result is that in “Part A” no static clutter is remaining, and the dynamic clutter can be investigated now. The quantification of the impact of dynamic clutter needs an extra step of processing. In (5) the dynamic clutter is defined as additive noise on the reference signal.
![]()
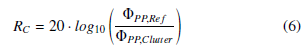
Equation (5) includes Φ as the signal with dynamic clutter, ΦRef as reference signal without clutter and ΦClutter as the dynamic clutter we want to investigate. Therefore, the dynamic clutter can be calculated as the difference between the measured signals of the different synchronized parts. Φ and ΦRef are measured radar phase signals that contain the information about the loudspeaker movement as described in (1). After calculating ΦClutter, the dynamic clutter rejection RC in dB can be defined as in (6) using the peak to peak value of the reference signal ΦPP,Ref and the peak to peak value of the clutter curve ΦPP,Clutter.
In the measurement scenario described in section 5.1, there are two loudspeakers at the distances 130cm and 150cm. With the range resolution of the radar mentioned in 2.2, these targets could be measured in range Bin 17 and 20. Therefore, the targets will be measured at BinZP 68 and 80 with using zero padding. Nevertheless, it is important to keep in mind that the real range resolution of the radar is lower than the BinZP suggests.
The chosen scenario allows to specifically investigate the range bins in between the two moving loudspeakers to indicate the robustness of the evaluated algorithms. The following Table 2 shows the results of the dynamic clutter investigation measurement.
Table 2: Dynamic clutter rejection in different range bins without beamforming.
| BinZP | ΦPP,Clutter [◦] | Clutter Rejection [dB] |
| 80 | 13 | 37.36 |
| 79 | 14.4 | 36.49 |
| 78 | 17.1 | 34.98 |
| 77 | 24.7 | 31.76 |
| 76 | 58.5 | 24.29 |
| 75 | 547.1 | 4.87 |
All range bins in which the dynamic clutter rejection in dB is higher than zero are evaluated. The according peak to peak value of the reference signals in all bins is about 958◦. For the calculation of the dynamic clutter rejection, the exact value of each range bin was certainly used. The peak to peak value is equivalent to a movement of 5.18mm of the target loudspeaker diaphragm. This is a typical movement range of the chest wall generated by the respiration, but it is important to note that the dynamic clutter rejection will be lower for signals with lower movement amplitude like the heartbeat movement.
In the range bin corresponding to the target loudspeaker, the dynamic clutter rejection is 37.36dB, and it drops to 24.29dB in range bin 76. This means that with a target detection one real range bin too low, the signal quality of the target movement measurement in this detected range bin is greatly reduced. The graphs in Figure 11 clearly visualize the changes due to the dynamic clutter. The problem with visible differences in the signal becomes apparent when considering the visual analysis by healthcare professionals.
5.4. Impact of Beamforming on Dynamic Clutter
In this paper we not only want to investigate the dynamic clutter but also how a digital beamforming can reduce the dynamic clutter for a scenario with multiple radar targets. With the presented measurement system, it is possible to test the performance of different beamforming algorithms concerning their capability to reduce dynamic clutter. In the scope of this article, we will demonstrate this by discussing a beamforming algorithm and its effect on the dynamic clutter.
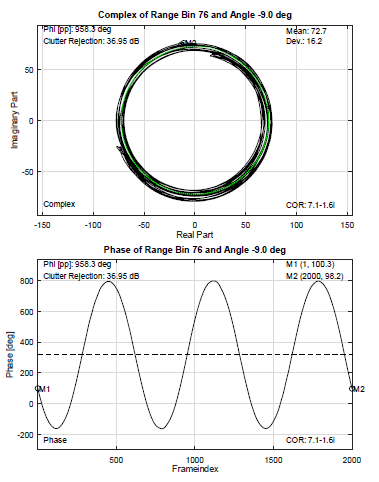
Figure 14: Complex and phase plot from dynamic clutter measurement in range binZP 76 with beamforming.
In [22], three different beamforming algorithms are compared, Bartlett, Capon and MUSIC algorithm. Those algorithms are candidates for future studies using our presented measurement system. By now, we implemented a second Fourier transform on all radar RX channels as mentioned in chapter 2.2. As already used in the range FFT, a zero padding with factor four is used in the angle FFT. Like mentioned before, this does not change the angle resolution of the radar, but adds more points to the spectral curve.
After the angle FFT, the same processing was done on the data as in section 5.3. The angle of the target loudspeaker for all presented results is found by the target bin finder described in chapter 2.2. The results of the processed data are presented in Table 3. Figure 14 shows the radar phase and complex curves with dynamic clutter in range bin 76. In comparison to the curves in Figure 11 this is a great improvement.
Table 3: Dynamic clutter rejection of different range bins with beamforming.
| BinZP | ΦPP,Clutter [◦] | Clutter Rejection [dB] |
| 80 | 10.4 | 39.26 |
| 79 | 10.6 | 39.15 |
| 78 | 10.9 | 38.90 |
| 77 | 11.3 | 38.60 |
| 76 | 13.6 | 36.95 |
| 75 | 33.2 | 29.19 |
Figure 15 condenses all values from the Tables 2 and 3 into two curves. There you can see that the usage of beamforming greatly increases the signal quality in the observed range bins. Even when analyzing the data in range bin 80, where we expect the target signal to be, a slight improvement thanks to digital beamforming is measurable. Further, dealing with movements with smaller micro movement (like the one from the heartbeat), this could be even more important. As mentioned before, the visual representation of the phase signal related to the chest wall micro movement could be important to healthcare professionals in future diagnosis. A comparison of the curves in Figure 11 and 14 distinctly visualizes that the dynamic clutter rejection is more effective when using beamforming. Especially in real scenarios it is important to achieve a high robustness because the perfect adjustment cannot be expected at all times.
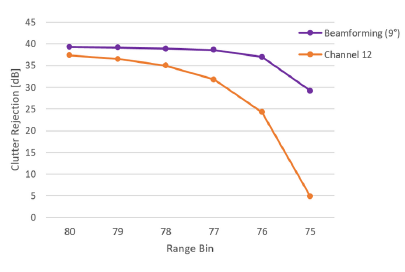
Figure 15: Dynamic clutter rejection with and without beamforming in different range bins.
6. Replication and Recording of realistic Micro Movement
In this chapter, measurements of realistic heartbeat movements are presented. The objective is to survey the effect of dynamic clutter on realistic micro movement with smaller movement amplitude. As already mentioned in 4.2, we used an apnea after exhalation scenario from the GDN0009 3 Apnea measurement of the clinical recorded dataset of Schellenberger [15]. Also, the chapter 4.2 explains the preparation of the dataset data for measurements.
For the measurement presented in this chapter, the prepared heartbeat motion signal is replayed on the target loudspeaker. In addition, a clutter movement is generated by the clutter loudspeaker at the same time. The used clutter signal is a sine with 0.4Hz frequency and 4.7mm movement peak-to-peak amplitude.
The recorded radar phase signal is shown in Figure 16. The investigated range bin is 76, which is one real BinW apart from the target bin. This constellation was already used in chapter 5. On the recorded data, the signal processing from 2.2 is used without a digital beamforming.
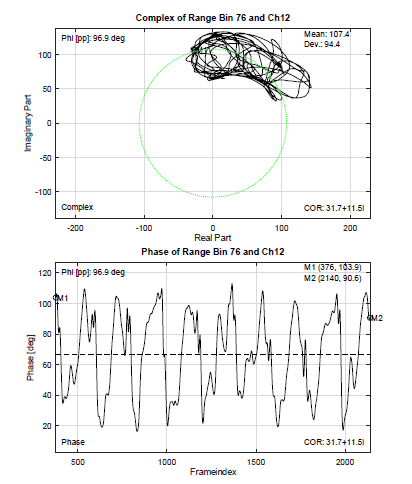
Figure 16: Complex and phase plot of radar measurement using heartbeat movement from dataset without digital beamforming.
In the performance test without any dynamic clutter presented in Figure 10 the heartbeat curve is clearly visible. However, during the measurement with dynamic clutter, the signal is strongly disturbed and the heartbeat movement is hardly visible. To improve the signal quality, the measured data were then processed again, this time with an additional angle FFT as digital beamforming. The results of the second signal processing using digital beamforming is presented in Figure 17. There, the quality of the curve is significantly higher.
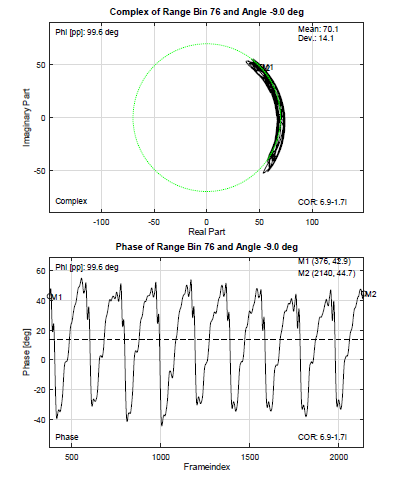
Figure 17: Complex and phase plot of radar measurement using heartbeat movement from dataset with digital beamforming.
The measurements in this chapter confirm once again the relevance of digital beamforming for vital sign sensing scenarios. They are an important supplement to the results of the previous chapter, in which the influence of dynamic clutter was quantitatively evaluated using the clutter rejection. Both measurement methods are steps in the evaluation of different beamforming algorithms.
7. Conclusion
In this paper we presented a measurement system that can be used for evaluating radar algorithms by replication of vital sign micro movement and dynamic clutter. It is an extension of work originally presented in the 44th Annual International Conference of the IEEE Engineering in Medicine and Biology Society (EMBC) [1]. In contrast to the previous work, the measurement setup was completely re-designed to be able to replicate realistic micro movement from vital signs and to enable scenarios with two moving objects. Movement data used for the replication was synthesized or taken from recorded movement data. The heartbeat movement from the clinically recorded dataset [15] was successfully reproduced and recorded by the measurement setup.
The ability to evaluate radar algorithms was demonstrated by the investigation of dynamic clutter. It was shown that an angle FFT algorithm increases the dynamic clutter rejection and signal quality in a scenario with dynamic clutter. This increase in signal quality is also clearly visible in the phase signal related to the chest wall micro movement, which can be important to healthcare professionals in future diagnosis.
In future studies, different beamforming algorithms like Capon and MUSIC can be compared using the presented measurement system. It is suitable to evaluate signal processing algorithms for radar applications by replicating real micro movement scenarios. This is crucial in optimizing robust and reliable systems for medical applications. In addition, it is also possible to test radar algorithms implemented in a signal processor inside of the radar sensor at realtime using the measurement system.
- C. Domnik, M. Meuleners, C. Degen, “Radar Evaluation Setup for the Replication of Chest Wall Movement from Vital Signs,” in 2022 44th Annual International Conference of the IEEE Engineering in Medicine and Biology Society (EMBC), IEEE, 2022, doi:10.1109/embc48229.2022.9871203.
- V. Chen, F. Li, S.-S. Ho, H. Wechsler, “Micro-doppler effect in radar: phenomenon, model, and simulation study,” IEEE Transactions on Aerospace and Electronic Systems, 42(1), 2–21, 2006, doi:10.1109/taes.2006.1603402.
- Y. Zhang, F. Qi, H. Lv, F. Liang, J. Wang, “Bioradar Technology: Recent Research and Advancements,” IEEE Microwave Magazine, 20(8), 58–73, 2019, doi:10.1109/mmm.2019.2915491.
- J. C. Lin, “Microwave sensing of physiological movement and volume change: A review,” Bioelectromagnetics, 13(6), 557–565, 1992, doi:10.1002/bem. 2250130610.
- C. Feng, X. Jiang, M.-G. Jeong, H. Hong, C.-H. Fu, X. Yang, E. Wang, X. Zhu, X. Liu, “Multitarget Vital Signs Measurement With Chest Motion Imaging Based on MIMO Radar,” IEEE Transactions on Microwave Theory and Techniques, 69(11), 4735–4747, 2021, doi:10.1109/tmtt.2021.3076239.
- S. Dong, Y. Zhang, C. Ma, C. Zhu, Z. Gu, Q. Lv, B. Zhang, C. Li, L. Ran, “Doppler Cardiogram: A Remote Detection of Human Heart Activities,” IEEE Transactions on Microwave Theory and Techniques, 68(3), 1132–1141, 2020, doi:10.1109/tmtt.2019.2948844.
- C. Gu, R. Li, H. Zhang, A. Y. C. Fung, C. Torres, S. B. Jiang, C. Li, “Accurate Respiration Measurement Using DC-Coupled Continuous-Wave Radar Sensor for Motion-Adaptive Cancer Radiotherapy,” IEEE Transactions on Biomedical Engineering, 59(11), 3117–3123, 2012, doi:10.1109/tbme.2012.2206591.
- M.-C. Tang, F.-K. Wang, T.-S. Horng, “A single radar-based vital sign mon- itoring system with resistance to large body motion,” in 2017 IEEE MTT-S International Microwave Symposium (IMS), IEEE, 2017, doi:10.1109/mwsym. 2017.8058758.
- J.-M. Munoz-Ferreras, Z. Peng, R. Gomez-Garcia, C. Li, “Random body move- ment mitigation for FMCW-radar-based vital-sign monitoring,” in 2016 IEEE Topical Conference on Biomedical Wireless Technologies, Networks, and Sensing Systems (BioWireleSS), IEEE, 2016, doi:10.1109/biowireless.2016. 7445551.
- E. Cardillo, C. Li, A. Caddemi, “Vital Sign Detection and Radar Self-Motion Cancellation Through Clutter Identification,” IEEE Transactions on Microwave Theory and Techniques, 69(3), 1932–1942, 2021, doi:10.1109/tmtt.2021. 3049514.
- A. Marnach, D. Schmiech, A. R. Diewald, “Verification of Algorithm for an I/Q-Radar System for Breathing Detection in an Incubator,” in 2019 International Conference on Electromagnetics in Advanced Applications (ICEAA), IEEE, 2019, doi:10.1109/iceaa.2019.8879336.
- B. Padasdao, E. Shahhaidar, C. Stickley, O. Boric-Lubecke, “Electromagnetic Biosensing of Respiratory Rate,” IEEE Sensors Journal, 13(11), 4204–4211, 2013, doi: 10.1109/jsen.2013.2266253.
- B. Padasdao, E. Shahhaidar, O. Boric-Lubecke, “Measuring chest circumference change during respiration with an electromagnetic biosensor,” in 2013 35th Annual International Conference of the IEEE Engineering in Medicine and Biology Society (EMBC), IEEE, 2013, doi:10.1109/embc.2013.6609906.
- A. Singh, S. U. Rehman, S. Yongchareon, P. H. J. Chong, “Modelling of Chest Wall Motion for Cardiorespiratory Activity for Radar-Based NCVS Systems,” Sensors, 20(18), 5094, 2020, doi: 10.3390/s20185094.
- S. Schellenberger, K. Shi, T. Steigleder, A. Malessa, F. Michler, L. Hameyer, N. Neumann, F. Lurz, R. Weigel, C. Ostgathe, A. Koelpin, “A dataset of clinically recorded radar vital signs with synchronised reference sensor signals,” 2020, doi:10.6084/M9.FIGSHARE.12186516.V2.
- A. Singh, B.-K. Park, O. Boric-Lubecke, I. Mostafanezhad, V. M. Lubecke, “Physiological Doppler Radar Overview,” in Doppler Radar Physiological Sensing, 69–94, John Wiley & Sons, Inc, 2016, doi:10.1002/9781119078418.ch4.
- J. Liu, Y. Li, C. Li, C. Gu, J.-F. Mao, “Accurate Measurement of Human Vital Signs With Linear FMCW Radars Under Proximity Stationary Clutters,” IEEE Transactions on Biomedical Circuits and Systems, 15(6), 1393–1404, 2021, doi:10.1109/tbcas.2021.3123830.
- Y. Wang, A. Ren, M. Zhou, W. Wang, X. Yang, “A Novel Detection and Recognition Method for Continuous Hand Gesture Using FMCW Radar,” IEEE Access, 8, 167264–167275, 2020, doi:10.1109/access.2020.3023187.
- A. D. Droitcour, O. Boric-Lubecke, “Physiological Motion and Measurement,” in Doppler Radar Physiological Sensing, 39–68, John Wiley & Sons, Inc, 2016, doi: 10.1002/9781119078418.ch3.
- S. Schellenberger, K. Shi, T. Steigleder, A. Malessa, F. Michler, L. Hameyer, N. Neumann, F. Lurz, R. Weigel, C. Ostgathe, A. Koelpin, “A dataset of clin- ically recorded radar vital signs with synchronised reference sensor signals,” Scientific Data, 7(1), 2020, doi: 10.1038/s41597-020-00629-5.
- K. Shi, S. Schellenberger, C. Will, T. Steigleder, F. Michler, J. Fuchs, R. Weigel, C. Ostgathe, A. Koelpin, “A dataset of radar-recorded heart sounds and vital signs including synchronised reference sensor signals,” Scientific Data, 7(1), 2020, doi:10.1038/s41597-020-0390-1.
- C. Degen, “On single snapshot direction-of-arrival estimation,” in 2017 IEEE International Conference on Wireless for Space and Extreme Environments
(WiSEE), IEEE, 2017, doi: 10.1109/wisee.2017.8124899.