Inferring Student Needs Based on Facial Expression in Video Images

Adv. Sci. Technol. Eng. Syst. J. 8(3), 19–28 (2023);
 DOI: 10.25046/aj080303
Limited interactive communication modes between students and teachers in online environments may lead to teachers misinterpreting or overlooking student needs during online teaching. Students learning online may also hesitate to make their needs known even when latent desires in teaching flow, pacing, and review, may be beneficial to the quality of the learning experience. The objective of the study is to construct and test models to infer student needs based on the facial expressions of students while they are learning online. Several Random Forest models were constructed to infer the reported conditions and tested using facial expression data extracted from the videos as action units in Facial Action Coding System (FACS). Exploratory Factor Analysis (EFA) was adopted to extract and combine the highly-related facial action units for building the training and testing data. The testing of the inference model yielded a result of 0.028 on the mean average error (MAE). This result suggests these methods would contribute to the development of improved online learning systems that assist teachers in understanding in real-time how students are responding to a lecture or other classroom experience.
1. Introduction
With the sudden expansion of online teaching from 2020, due in large part to measures intended to prevent opportunities for transmission of the SARS-Cov-2 virus, teachers and students were suddenly confronted by many of the difficulties associated with online learning environments. Among those difficulties is significantly fewer points at which a student can indicate feedback to a teacher, or a teacher can take a quick reading of the room to investigate facial expressions, sounds, body movements, and the like. The objective of this research is to investigate the feasibility of using video of students to monitor their facial movements in order to infer needs the students may wish to communicate to the teacher without unnecessarily interrupting the flow of the class. Here, student needs refers to implicit or latent requests about class flow and pace, such as increased or decrease in teaching speed, review of material introduced in this lecture, requests for breaks, and the like. The concept, as envisioned here, uses only local video monitoring and therefore can avoid privacy issues, as well as video and audio resolution difficulties, involved when classrooms rely on direct video of student faces during learning. The present study extends a study originally presented in the 10th International Conference on Information and Education Technology (ICIET 2022) by describing an investigation of new methods of inferring student needs in an online teaching scenario and the results of testing these methods on the experiment data presented in the previous work [1]
During the 2020 and 2021 academic years, schools of all types but especially institutions of higher learning, greatly expanded the use of online platforms to deliver lectures and other teaching activities. Platforms such as Zoom [2], Skype [3], and Google Hangouts [4] were quickly adopted to allow student and faculty participation from home in order to minimize contact and quell the spread of the Covid-19 pandemic. Teachers who were mostly accustomed to lecturing, and students who had for the most part attended class, in a conventional classroom, quickly discovered that many common, established objectives of communication between student and teacher [5] may become far more difficult when learning online [6], [7]. For example, in a conventional classroom, teachers may more easily gauge student needs, such as, by periodically checking their facial expressions. In addition to monitor resolution and video quality questions, the direct use of video has also been a privacy concern for students studying in their own abodes or in shared spaces [8].
This study provides a model for automatically inferring student needs based on their facial expressions during online lectures. The Facial Action Coding System (FACS) [9] provides a methodology to identify human facial emotions by collecting a group of facial Action Units (AUs), which are collections of facial muscle movements. In this study, FACS is used to identify a student need from facial muscle movement at a certain moment. The inputs of the model are the intensity levels of AUs. Exploratory Factor Analysis (EFA) [10] is performed to reduce the number of inputs and determine the most effective combinations of AUs. Finally, Random Forests (RF) [11], a popular machine learning method for classification models were adopted to implement the inference models.
This article differs from the previously published conference paper titled “Inference of Student Needs in an Online Learning Environment Based on Facial Expression” in the following aspects. The introduction was significantly changed and expanded to discuss the relevance of this system for online learning support. The inference model was implemented with ten RF models to infer each student need rather than using one neural network model to infer ten student needs at once as in the conference paper, showing significantly improved accuracy. The experiment settings were significantly expanded, adding detail to the experimental methods, as well as deeper analysis and discussion of the experimental results. This paper further confirms the feasibility previously presented methods with added accuracy reported and further details for implementation in future online learning systems.
2. Related Work
Previous studies have investigated methods of automatically assessing student emotions during classroom activities. For example, in [12], the authors describe a method to provide teachers with emotional signals from their students based on measurements of electrodermal activity. Such methods, while offering immediate and relevant signals, also require shipping and local set up of equipment that is not typically part of the student’s hardware and software. This paper, on the other hand, describes methods that use hardware and software typically part of most student online equipment available in laptops (as in the present work) or other devices commonly used to participate in online learning.
Some approaches use the camera for eye tracking in an effort to use gaze detection signals, as such signals are thought to be relevant to both emotional responses and learning activities. For example, the authors in [13] propose a system that collects data on eye movements, such as blinking or the duration of a gaze in a single location, to determine how well a student is progressing in the visual contents during a lesson. Signals reporting on student concentration during a lesson, while certainly providing what could be processed into useful information for instructors, do not on their own give the teacher some understanding of how to respond in a positive manner. In other words, simply telling the teacher that students may not be concentrating does not necessarily assist the teacher in responding to that situation. Facial expressions allow acquisition of more specific states of emotional reaction than concentration alone.
Several systems have been developed to track student facial landmarks, head positions, facial actions, and eye movements in order to infer a student’s emotional state. For example, the systems described in [14] and [15] propose models to measure student engagement during video engagement based on facial expression data. The system described in [14] uses the Microsoft Kinect camera to acquire input data for a model to infer labels attached by a separate set of video observers. The work in [15] uses OpenPose [16] in a similar manner to that in [13]. In such systems, video observers may not be able to pick up relevant but subtle cues in student expressions. Additionally, as noted above, tracking student emotions or concentration during learning does not necessarily yield information directly applicable to assisting teachers grasp student needs.
Therefore, the contributions of this study can be listed as follows:
- To propose a new approach to the improvement of online learning environments by providing teachers specific information about student status in terms of specific needs. • To propose a novel model of inferring student needs based on their facial expressions and, according to the model proposed, an online education platform using commonly available device tools and processing power.
- To find and identify associations between specific needs and facial emotions.
3. Proposed Inference Model
A student needs inference model was proposed. Figure. 1 shows each component of the model. The following shows a detailed explanation:
- Facial expression video recordings: A front-facing camera continuously records facial expressions while students attend real-time online lectures or watch video lectures. The tracking system simultaneously transfers the facial expression recordings to the FACS server.
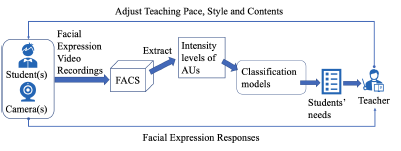
Figure 1: Model architecture for a student needs tracking system
- Facial Action Coding System (FACS): FACS detects human facial emotions like surprise or fear using forty-six facial Action Units (AUs), each of which represents a collection of human facial muscle movements. For example, levator palpebrae superioris, superior tarsal muscle facial muscle movements align to AU05’s definition of “Upper lid raiser”. Student needs depend only partly on their emotions. Therefore, the FACS method is used in this model to pre-process the video recordings. The input data of the classification models is composed of the intensity levels of the AUs from the pre-processing results. Here, an intensity level of each facial AU represents the confidence level of that facial AU.
- Classification models: In order to infer a list of student needs at a given moment, pre-trained supervised classification models are also necessary. These models are based on the intensity levels of the AUs.
- Average of each need across all students: In the end, the tracking system reports the average value of each need in the list, across all students, at a given moment. Ideally, the teacher will adjust the teaching pace, style and contents based on the reports from the tracking system.
This model can be used to build a student need tracking system for either real-time or on-demand online education. In the latter case, a teacher can adjust the teaching style and contents according to the overall output of the system.
4. Experiment Settings
This experiment simulates a situation in which students observe a college-level class given in an online video format with web cameras facing the students during the learning. Students were asked to watch educational videos that ranged from 8 to 9 minutes in length. Figure 2 shows the experiment flow for one viewing session. The experiment system automatically pauses the video every two minutes and requests that the student complete a survey on their current needs. After completing the survey the participant presses the “Play video” button on the in order to resume watching the video lesson. Other controls for the flow of the video were disabled in order to resemble real-time streaming participation. The web camera facing the student recorded facial expressions while the participants were watching the videos.
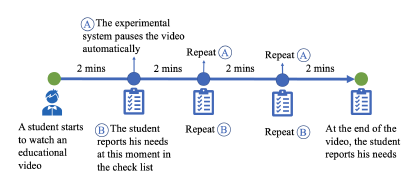
Figure 2: Human interaction experiment flowchart
The videos used in the experiment were three college-level educational videos, two selected from the Massachusetts Institute of Technology (MIT) OpenCourse [17] lectures on propositional logic and computing mathematics, and one of a recorded lecture given as a part of a C Language programming lecture at Ritsumeikan University, Japan, in which the topic is function declarations. This course is intended for students with no C programming experience and therefore precedes at a slower pace than the MIT courses selected. Due to privacy and consent considerations, the faces of students and teachers, as well as the voices of the students were omitted from this video. The three videos used in the experiments are each about fundamental computer science topics typically given to computer science students an intermediate level of difficulty in the curriculum. All three of the videos lectures employed a typical teaching format for such college courses, for example using slides to introduce and detail each main topic. Seven students participated in the experiment. All of the students were in their 4th year of an undergraduate information systems engineering curriculum.
4.1 Creation of a Student Needs Survey
Based on previous studies and investigations of student needs, in [18] and [6], with consideration for their findings on needs that would be of practical use during teaching, the survey asked students about ten specific needs or requests for the teacher. Table 1 shows the list of student needs surveyed after each video session. These student needs were also intended to be helpful for learning and may be classified by their general teaching objectives: • Needs that allow the teacher to adjust teaching pace in order to allow enough time for teachers and students to progress in their learning activities, which includes the needs numbered 01, 02, 03, 05, 06, 07, 08 and 10.
- Needs that inform the teacher on teaching style in order to increase engagement and understanding during the lecture and subsequent activities, which includes the need numbered 09.
- Needs that give the teacher feedback on adjust teaching contents so that the teaching materials may be more effectively paired with subsequent lectures, as in the need numbered 04.
Table 1: List of student needs investigated
| Student Needs No. | Student Needs Descriptions |
| 01 | Please teach faster |
| 02 | Please teach slower |
| 03 | Please wait a moment |
| 04 | Please skip this part |
| 05 | Please go back to the last part |
| 06 | Please explain more |
| 07 | Please let me ask a question |
| 08 | Please let me take a break |
| 09 | Please make the class more interesting |
| 10 | I don’t need anything; please continue |
4.2 Facial Action Unit Extraction using OpenFace Technology
The FACS toolkit, OpenFace [19] was used to extract AU intensity levels (or AU values) in each recorded facial expression video. Seventeen AU features have been extracted as shown in Table 2. Although OpenFace can not extract all forty-six AUs as mentioned in Section 3, the seventeen AU features extracted were enough for the purpose of this study.
Additionally, an AU correlation matrix, which is given in Table 3, was also calculated to show the linear correlations among the AU features using all of the recorded videos. The AU correlation matrix calculation method is by Equation 1, which is based on the Pearson correlation matrix [20].
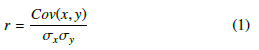
where, r is the correlation coefficient between two AU features: x and y, which are two sets of AU values.
The AU correlation matrix shows there are many features with correlation coefficients greater than 0.30 and some of the correlation coefficients are relatively high, such as the correlation coefficient (0.78) between AU01 and AU02. Therefore, factor analysis models may be implemented to identify interrelationships among the AU features. In this study, an Exploratory Factor Analysis (EFA) model was adopted to find the factor analysis clusters, which were also used to construct the sample data for training and testing the classification models.
Table 2: Action Unit feature list extracted by OpenFace
| Action Unit No. | Action Unit Descriptions |
| AU01 | Inner Brow Raiser |
| AU02 | Outer Brow Raiser |
| AU04 | Brow Lowerer |
| AU05 | Upper Lid Raiser |
| AU06 | Cheek Raiser |
| AU07 | Lid Tightner |
| AU09 | Nose Wrinkler |
| AU10 | Upper Lid Raiser |
| AU12 | Lid Corner |
| AU14 | Dimpler |
| AU15 | Lip Corner Depressor |
| AU17 | Chin Raiser |
| AU20 | Lip Stretcher |
| AU23 | Lip Tightener |
| AU25 | Lips Part |
| AU26 | Jaw Drop |
| AU45 | Blink |
4.3 Construction of Sample Data using Exploratory Factor Analysis (EFA)
In order to implement EFA, three major steps were conducted:
- Assessment of the factorability of the AU features: Both the Kaiser-Meyer-Olkin (KMO) test [21] (given by Equation 2) and Bartlett‘s Test of Sphericity (BTS) [21] (given by Equation 3) were performed on the AU correlation matrix.
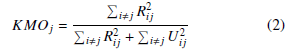
where, KMOj is the KMO value for the given AU dataset; R is the AU correlation matrix shown in Table 3; i and j indicate the indices of the AU correlation matrix; and U is the partial covariance matrix.
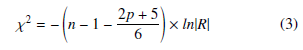
where, p is the number of variables; n is the total sample size in the given AU dataset; and R is the AU correlation matrix shown in Table 3.
The KMO statistic was equal to 0.63 > 0.60, which indicates that the collected AU features are adequate and it is appropriate to use EFA for the data. The BTS was highly significant with a test statistic of 146,276.26 and an associated degree of significance, p < 0.0001, which shows that the AU correlation matrix has significant correlations among at least some of the features. Hence, the hypothesis that the AU correlation matrix is an identity matrix is rejected, also indicating that an EFA model is worthwhile for the AU features.
- Factor extraction: In this study, Kaiser’s (Eigenvalue) Criterion [22] and the Scree Test [23] were used to determine the number of the initial unrotated factors to be extracted. The eigenvalues associated with each component represent the total amount of variance that can be explained by this component. They were plotted based on the Scree Test. Six remarkable factors having an eigenvalue greater than one were retained. In the end, the Varimax rotation method [24] was adopted to implement the factor extractions.
- Sample data construction: Six remarkable factors were used to describe the sample data for classification models in six dimensions. Each factor score for each dimension was calculated from the factor loadings extracted from EFA. The calculation is a weighted average as shown in Equation 4 .
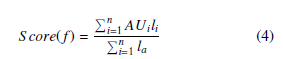
where, f is the fth factor; n is the number of AU features involved; AUi is the ith AU value in each sample; li is the corresponding factor loading for the ith AU feature.
4.4 Classification Models
Random Forests (RF) were adopted to build the student needs inference model. Figure 3 shows the architecture of the inference model. The inputs of the inference model were the floating factor scores, and the outputs were the ten student needs listed in Table
- 1. The factor loadings for each corresponding AU feature and the AU values for the final 300 frames in each video clip were used to generate the factor scores. Ten RF models were trained to target each of the ten student needs for classifying whether this sample data corresponds to the need or not, indicated with an integer value “zero” (not corresponding) or “one” (is corresponding). In the end, the outputs from the ten models were combined as the output of the inference model.
4.5 Construction of the Experiment
A web application was built on the frontend to show and control the flow of the educational videos and survey to students. The survey results were stored in a local web server. A web 720p front-facing camera was also used to record the facial expression videos.
Table 3: Linear correlation matrix for AU features: correlation coefficients above 0.30 are highlighted; columns and rows are corresponding to AU No. shown in Table 2
|
||||||||||||||||||||||||||||||||||||||||||||||||||||||||||||||||||||||||||||||||||||||||||||||||||||||||||||||||||||||||||||||||||||||||||||||||||||||||||||||||||||||||||||||||||||||||||||||||||||||||||||||||||||||||||||||||||||||||||||||||||||||||||||||||||||||||||||||||||||||||||||||||||||||||||||||||||||||||||||||||||||||||||||||||||||||||||||||||||||||||||||||||||||||||||||||||||||||||||||||||||||||||||||||||||||||||||||||||||||||||||||||||||||||||||||||||||||||||||||||||||||||||||||||||||||||||||||||||||||||||||||||||||||||||||||||||||||||||||||||||||||||||||||||||||||||||||||||||||||||||||||||||||||||||||||||||||||||||||||||||||||||||||||||||||||||||||||||||||||||||||||
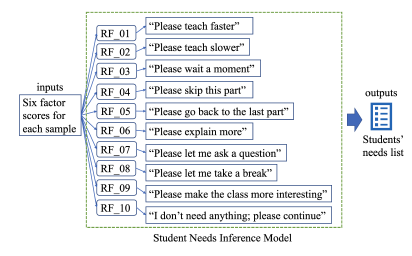
Figure 3: Student needs inference model architecure
5. Experimental Results and Discussion
The experiment data includes a total of 84 segments of participant facial expression data, each recorded at the end of a two-minute viewing session. Two of the seven participants completed all three educational videos. Four participants watched two of the video lectures. One subject watched one video lecture. Each educational video includes four clips; for each clip, one survey result was produced. OpenFace recorded all AU intensity levels (ranging from 0.0 to 5.0) for each video frame of the participants face for an average of 3485 frames for each two-minute session. As mentioned in Section 4, the final 300 frames of each clip (ten seconds) prior to each survey response were used as the input data for training and testing the classification models. Therefore, the 84 data sets of 300 video frames each resulted in a total of 25,200 sets of AU intensity levels as input data in the models. The labels for the supervised classification models tested were each student need selected immediately after the given video clip. Table 4 shows an example of labeled clips; “A2-1” and “B2-1” represent two clips from two participants, where a “one” indicates that particular student need was selected in the survey and a “zero” indicates it was not selected.
Table 4: An example of labeled partial clips: the student need numbers are corresponding to those in Table 1
| Student Needs No. | Clip No. | |||
| A2-1 | A2-2 | B2-1 | C2-4 | |
| 01 | 1 | 1 | 0 | 1 |
| 02 | 1 | 0 | 0 | 0 |
| 03 | 0 | 1 | 0 | 0 |
| 04 | 0 | 0 | 0 | 0 |
| 05 | 0 | 0 | 0 | 1 |
| 06 | 0 | 0 | 1 | 0 |
| 07 | 0 | 0 | 0 | 0 |
| 08 | 0 | 0 | 0 | 0 |
| 09 | 0 | 0 | 0 | 0 |
| 10 | 0 | 0 | 0 | 0 |
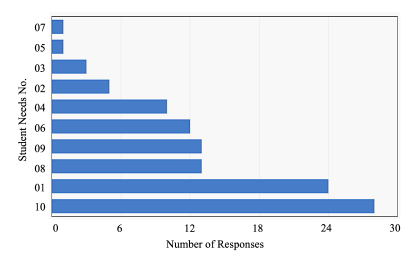
Figure 4: Distribution of student needs responses: the vertical labels are student needs numbers corresponding to those in Table 1.
5.1 Student Needs Survey Results
Figure. 4 shows the frequency for each response in the student needs survey data for all 84 sessions. The most frequently selected need was No. 10 (“I don’t need anything; please continue”) at 35% of the total responses. The second most frequently selected was No. 01 (“Please teach faster”) at 29%. These results indicate that the level of difficulty in these lessons may have been slightly low but not to the degree that it would interfere with the collection of data about the other surveyed needs. The overall distribution of the frequencies lends support to the validity of the inclusion of these particular needs in the survey, with each one selected by at least one participant and no need selected more than half of the time.
Table 5: Eigenvalues (EV) and total variance explained:
| Component | Initial Eigenvalues | ||||
| Total | % of Variance | Cumulative % | |||
| 01 | 3.289 | 19.347 | 19.347 | ||
| 02 | 2.254 | 13.257 | 32.604 | ||
| 03 | 2.027 | 11.925 | 44.529 | ||
| 04 | 1.416 | 8.331 | 52.860 | ||
| 05 | 1.217 | 7.478 | 60.337 | ||
| 06 | 1.042 | 6.130 | 66.467 | ||
| 07 | 0.997 | 5.863 | 72.331 | ||
| 08 | 0.844 | 4.965 | 77.296 | ||
| 09 | 0.769 | 4.525 | 81.821 | ||
| 10 | 0.712 | 4.186 | 86.007 | ||
| 11 | 0.623 | 3.667 | 89.674 | ||
| 12 | 0.454 | 2.669 | 92.342 | ||
| 13 | 0.407 | 2.394 | 94.736 | ||
| 14 | 0.319 | 1.876 | 96.612 | ||
| 15 | 0.270 | 1.588 | 98.200 | ||
| 16 | 0.158 | 0.930 | 99.130 | ||
| 17 | 0.148 | 0.870 | 100.000 | ||
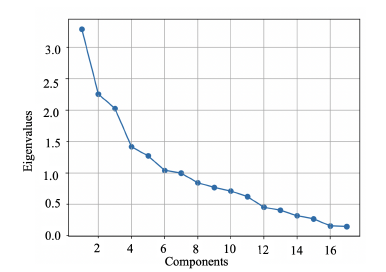
Figure 5: Scree Plot
5.2 Exploratory Factor Analysis Results
Based on the presumption that isolated facial actions taken out of context would be difficult for observers to interpret, EFA was used to determine effective combinations of the AU sets, as mentioned in Section 4. Table 5 shows the eigenvalues and total variance explained. Figure 5 shows the results of a Scree test, plotting the seventeen components on the x-axis and the respective eigenvalues for each number of components on the y-axis. Following the general rule of including the distinct linear components of the AU features with eigenvalues of greater than one, six of the seventeen components are included after extraction and rotation. The validity of this decision is further supported by the fact that the proportion of the total variance explained by the factors retained(66.5%) is greater than 50% [25]. Therefore, six factors were used for the subsequent EFA.
The present study performed EFA based on the Varimax rotation method. Table 6 shows factor loadings after EFA extraction, the mean and standard deviation of each corresponding AU features of all 25,200 frames. Here, the range of the intensity level of an AU is from 0.0 to 5.0 and is measured by OpenFace. AU features with loading values less than 0.40 are in grey, which indicates that they are not able to represent the corresponding factor.
Table 6: Factor loadings for each AU types
| Action Units | Mean | SD | Factor Loadings | ||||
| Factor 1: Scowling | |||||||
| Brow Lowerer | 1.002 | 1.045 | 0.765 | ||||
| Cheek Raiser | 0.331 | 0.518 | 0.668 | ||||
| Lid Tightner | 0.871 | 1.081 | 0.943 | ||||
| Factor 2: Squinting | |||||||
| Upper Lid Raiser | 0.451 | 0.501 | 0.687 | ||||
| Lid Corner | 0.496 | 0.646 | 0.945 | ||||
| Dimpler | 0.907 | 0.675 | 0.432 | ||||
| Factor 3: Blinking | |||||||
| Inner Brow Raiser | 0.299 | 0.682 | 0.957 | ||||
| Outer Brow Raiser | 0.133 | 0.338 | 0.809 | ||||
| Lips Part | 0.270 | 0.351 | 0.356 | ||||
| Blink | 0.264 | 0.442 | 0.304 | ||||
| Factor 4: Frowning | |||||||
| Nose Wrinkler | 0.056 | 0.164 | 0.074 | ||||
| Lip Corner Depressor | 0.137 | 0.293 | 0.796 | ||||
| Lip Stretcher | 0.151 | 0.315 | 0.529 | ||||
| Factor 5: Raising | |||||||
| Upper Lid Raiser | 0.088 | 0.252 | 0.978 | ||||
| Factor 6: Pursing | |||||||
| Chin Raiser | 0.370 | 0.457 | 0.575 | ||||
| Lip Tightener | 0.121 | 0.272 | 0.668 | ||||
| Jaw Drop | 0.320 | 0.391 | 0.351 | ||||
In addition, the top three highest mean values are highlighted. The AUs with the three highest mean intensity levels are “Brow Lowerer”, “Dimpler” and “Lid Tightener”, indicating that the brow, lid and dimple are the most significant signals. Each extracted factor was also given a name. These names do not necessarily reflect the emotions that might typically be expressed with these face actions. They are only intended as convenient labels for the discussion and analysis.
The factor analysis results appear to include principles of physical vicinity. For example, Factor 3 (Blinking) is associated with “Inner Brow Raiser” and “Outer Brow Raiser”. When a person elevates their inner brow, he is very likely to raise the outer brow as well. The sample data used for the inference was, therefore, the combinations between factor loadings and the actual AU values of each frame in each facial expression video. Here, only AU features with loading values that are not in grey in Table 6 were used.
5.3 Classification Model Evaluations
The training and testing data for all of the classification models were based on frames rather than clips. They were randomly split in a training-to-testing ratio of eight to two from the 25,200 frames. During training, for all of the models, 5-fold Cross-Validation [26] was done to reduce overfitting.
Random Forest is a popular machine learning procedure which can be used to develop prediction models. In the random forest settings, many classification and regression trees are constructed using randomly selected training datasets and random subsets of predictor variables for modeling outcomes. Results from each tree are aggregated to give a prediction for each observation [27]. In this study, “sklearn.ensemble.RandomForestClassifier” was used, which is a class of the “sklearn” machine learning package to train and test the RF models. In addition, considering the training time and overall accuracy, the basic parameter settings of all of the RF models are {number of estimators: 100 (default); max depth: 40}.
Figure 6 shows the confusion matrices for each trained RF model for each student need using the test data. As shown in Figure 6, in terms of all RF model evaluation results, the performance on true negatives was higher than that of the true positives due in part to an imbalance of the training data where there were far fewer positives than negatives in each category. For example, the lowest ratio of positives to negatives was approximately 0.01, and the highest ratio was less than 0.50. The highest two true positives were 89.3% and 86.0% on the student needs “I don’t need anything, please continue” and “Please teach faster”, indicating the model has better prediction abilities when the amount of training data is higher. However, while the amount of the training data may affect the model performance, it is not the only factor that affects the performance. For example, when comparing the performance on the student needs “Please wait a moment” and “Please go back to the last part”. The first need has a lower true positive rate than the second one, even though the amount of training data of the second need is twice the first one. In addition, the performance on false positive is worse than the false negative for all of the models, due in part to the issue of imbalance.
Figure 7 and Figure 8 show the validation curve and learning curve for each trained RF model for each student need using the test data. The left figure in each subfigure shows the validation curve, indicating the appropriate max depth for each RF model. The right figure shows the learning curve, summarizing the whole learning process during the 5-folder cross validation. The shading around the lines represents a 95% Confidence Interval (CI) [28] (given by the Equation 5) of each data point. From the validation curves, the maximum depth for nearly all of the RF models was between 20 and 30, indicating that a max depth in between 20 and 30 is appropriate and the most efficient for this task. The learning curves show increased accuracy with an increase in the number of cross-validations for most of the RF models.
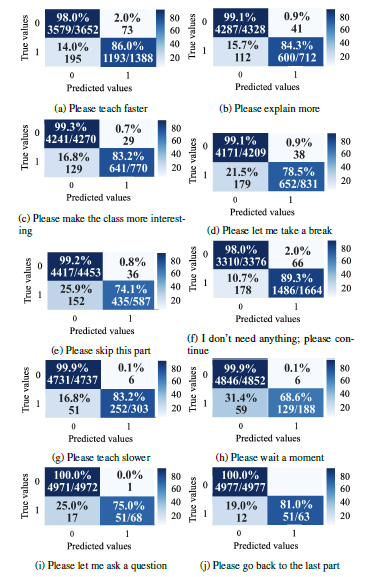
Figure 6: Confusion matrices for each trained RF model using the test dataset
where, X is the mean of the training or validation scores; Z is the zstatistic for the confidence level (for 95%, Z = 1.96 approximately); n is the sample size.
Finally, all of the RF model outputs were combined into one student needs list, including all ten possible needs. Table 7 shows the over-all evaluation of the inference model. Student need numbers: 08 (“Please let me take a break”), 09(“Please make the class more interesting”) and 10(“I don’t need anything; please continue”) received relatively lower average errors than other needs. This may be because those needs are more related to emotions. Student need numbers: 06 (“Please explain more”) and 01(“Please teach faster”) received higher mean average errors. This may be because of individual differences. For example, some people hide their emotions when they are thinking. The over-all MAE was 0.0283, which indicates the inference model could correctly infer more than nine students needs out of ten for each test video frame.
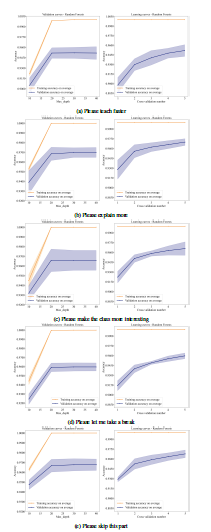
Figure 7: The validation curves (left) and learning curves (right) of RF models (RF01to RF05)
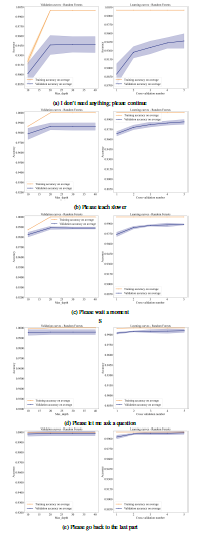
Figure 8: The validation curves (left) and learning curves (right) of each RF models(RF06 to RF10)
Table 7: Mean average error (MAE) of the inference model for predicting each student need: the student need numbers are corresponding to the ones in Table 1
| Student Needs No. | MAE for Each Need (1 × 10⁻²) |
| 01 | 5.595 |
| 02 | 2.778 |
| 03 | 3.472 |
| 04 | 4.345 |
| 05 | 3.671 |
| 06 | 5.238 |
| 07 | 1.488 |
| 08 | 1.032 |
| 09 | 0.456 |
| 10 | 0.198 |
| MAE of all sample data (1 × 10⁻²): 2.827 | |
6. Conclusion
This study demonstrates the feasibility of inferring student needs from real-time video data in online learning situations based on models trained on video and survey data collected from students learning from video learning materials. The video data was extracted as facial points which were further encoded using facial expression modeling methods, all of which can be collected in real-time during online teaching with the permission of the student. The survey was collected at the end of each two-minute video segment to label the needs of the student in terms of what the student would prefer in terms of change (or no change) in the teaching. This survey and the system itself is intended to allow students to give meaningful feedback that teachers may use to assist in decisions about class flow and student interaction, including teaching speed, class breaks, review of new material, etc. Facial actions were further classified using factor analysis to result in a final set of input parameters for the inference based on what may be described as facial expressions.
Of several models tested to infer the student needs from the facial expression data, the Random Forest models performed best. The results show each Random Forest is trained to classify a single need performs very well, especially excelling at excluding individual cases of need at which the model consistently performs with greater than 98% accuracy. When indicating a need, the model accurately classifies at a greater than 80% accuracy, a rate that could be extremely useful for teachers who, in online scenarios, typically cannot closely monitor each face or stop the flow of a lecture to inquire about feedback. More importantly, this accuracy in a class of even a small group could amalgamate several students inferred needs to give teachers a more accurate reading of the general mood about the class without needing any video transmission, or allowing complete anonymity.
The proposed inference model can also be tested in real learning situation given a flexible method of interaction and, as similar data is collected on the models’ accuracy in various situations, and the system accuracy improved, the interface may be adjusted to give teachers more confidence in relying on such systems to assist them in deciding who to respond to lecture flow and, eventually, to in responding to individual students. At the same time, as teachers become more comfortable with using such systems to determine the timing of specific feedback, they will also become more aware of the influence of their pacing and feedback on teaching in general.
Acknowledgment
This study was done using funds from Japan KAKENHI grant No. 21K17865.
- Y. Yan, J. C. Lee, E. W. Cooper, “Inference of student needs in an online learning environment based on facial expression, ” in the 10th International Conference on Information and Education Technology (ICIET), 113-117, 2022, doi: 10.1109/ICIET55102.2022.9779022.
- B. B. Wiyono, H. Indreswari, A. P. Putra, “The utilization of ‘Google Meet’ and ‘Zoom Meetings’ to support the lecturing process during the pandemic of COVID-19,” in the International Conference on Computing, Electronics & Communications Engineering (iCCECE), 25-29, 2022, doi: 10.1109/iC- CECE52344.2021.9534847.
- A. Karabulut, A. Correia, “Skype, Elluminate, Adobe Connect, Ivisit: a com- parison of web-based video conferencing systems for learning and teaching, ” in the Society for information technology & teacher education international conference, 484-484, 2008.
- H. Pratama, M. N. A. Azman, G. K. Kassymova, S. S. Duisenbayeva, “The trend in using online meeting applications for learning during the period of pandemic COVID-19: A literature review,” Journal of Innovation in Educa- tional and Cultural Research, 1(2), 58-68, 2020, doi:10.46843/jiecr.v1i2.15.
- E. A. Skinner, M. J. Belmont, “Motivation in the classroom: reciprocal ef- fects of teacher behavior and student engagement across the school year,” Journal of Education Psychology, 85(4), 571-581, 1993, doi:10.1037/0022- 0663.85.4.571.
- Y. Nailufar, S. Safruddin, M. I. Zain, “Analysis of teacher difficulties in online learning on mathematics subjects,” Prisma Sains: Jurnal Pengkajian Ilmu dan Pembelajaran Matematika dan IPA IKIP Mataram, 9(2), 280-288, 2021, doi:10.33394/j-ps.v9i2.4376.
- X. Lu, M. Wang, J. Fang, H. Liao, “Investigation on the difficulties and challenges of teachers online teaching in primary and middle schools of guangxi middle school,” in the International Conference on Computer Vision, Image and Deep Learning (CVIDL), 542–545, 2020, doi:10.1109/CVIDL51233.2020.00-31.
- M. H. Rajab, M. Soheib,“Privacy concerns over the use of webcams in online medical education during the COVID-19 pandemic,” Cureus, 13(2), 2021, doi: 10.7759/cureus.13536.
- P. Ekman, W. V. Friezen, “Facial Action Coding System (FACS),” Environmental Psychology & Nonverbal Behavior, 1978, doi:10.1037/t27734-000.
- A. G. Yong, S. Pearce, “A beginner’s guide to factor analysis: focusing on exploratory factor analysis,” Tutorials in quantitative methods for psychology, 9(2), 79-94, 2013.
- G. Biau, E. Scornet, “A random forest guided tour,” Test, 25, 197-227, 2016, doi: 10.1007/s11749-016-0481-7.
- P. W. Kim, “Real-time bio-signal-processing of students based on an in- telligent algorithm for internet of things to assess engagement levels in a classroom,” Future Generation Computer Systems, 86, 716– 722, 2018, doi: 10.1016/j.future.2018.04.093.
- M. Porta, S. Ricotti, C. J. Perez, “Emotional e-learning through eye tracking,” in IEEE Global Engineering Education Conference (EDUCON), 1–6, 2012, doi: 10.1109/EDUCON.2012.6201145.
- B. M. Booth, A. M. Ali, S. S. Narayanan, I. Bennett, A. A. Farag, “Toward active and unobtrusive engagement assessment of distance learners,” in the Seventh International Conference on Affective Computing and Intelligent Interaction (ACII), 470–476, 2017.
- X. Zheng, S. Hasegawa, M.-T. Tran, K. Ota, T. Unoki, “Estimation of learn- ers’ engagement using face and body features by transfer learning,” in the International Conference on Human-Computer Interaction, 541–552, 2021, doi:10.1109/ACII.2017.8273641.
- Z. Cao, G. Hidalgo, T. Simon, S.-E. Wei, Y. Sheikh, “Openpose: realtime multi-person 2d pose estimation using part affinity fields,” IEEE Transac- tions on Pattern Analysis and Machine Intelligence, 43(1), 172-186, 2021, doi:10.1109/TPAMI.2019.2929257.
- D. Cecilia, S. Carson, K. James, J. Lazarus, “MIT OpenCourseWare: unlock- ing knowledge, empowering minds, ” Science, 329(5991), 525-526, 2010, doi:10.1126/science.11826962.
- D. Patel, D. Ghosh, S. Zhao,“Teach me fast: how to optimize online lecture video speeding for learning in less time?, ” in the Sixth International Symposium of Chinese (CHI),160–163, 2018, doi: 10.1145/3202667.3202696.
- T. Baltrusaitis, A. Zadeh, Y. C. Lim, L. P. Morency, “Openface2.0: facial be- havior analysis toolkit,” in the 13th International Conference on automatic face & gesture recognition (FG 2018), 59–66, 2018, doi:10.1109/FG.2018.00019.
- J. Benesty, J. Chen, Y. Huang, I. Cohen, “Pearson correlation coefficient,” Noise Reduction in Speech Processing, 2, 2009, doi:10.1007/978-3-642- 00296-0 5.
- C. D. Dziuban, E. C. Shirkey, “When is a correlation matrix appropriate for factor analysis? some decision rules,” Psychological Bulletin, 81(6), 358–361, 1974, doi:10.1037/h0036316.
- K. A. Yeomans, P. A. Golder, “The Guttman-Kaiser Criterion as a predictor of the number of common factors,” Journal of the Royal Statistical Society. Series D (The Statistician), 31(3), 221–229, 1982, doi:10.2307/2987988.
- B. Raymond, Cattell, “The Scree Test For The Number Of Fac- tors,” Multivariate Behavioral Research, 1(2), 245-276, 1966, doi:10.1207/s15327906mbr0102 10.
- E. E. Cureton, S. A. Mulaik, “The weighted varimax rotation and the promax rotation,” Psychometrika, 40, 183–195, 1975, doi:10.1007/BF02291565.
- N. Shrestha, “Factor analysis as a tool for survey analysis,” American Journal of Applied Mathematics and Statistics, 9(1), 4-11, 2021, doi:10.12691/ajams- 9-1-2.
- T. Fushiki, “Estimation of prediction error by using K-fold cross-validation, ” Statistics and Computing, 21, 137–146, 2011, doi:10.1007/s11222-009-9153- 8.
- J. L. Speiser, M. E. Miller, J. Tooze, E. lp, “A comparison of ran- dom forest variable selection methods for classification prediction mod- eling”, Expert Systems with Applications, 134(15), 93-101, 2019, doi: 10.1016/j.eswa.2019.05.028.
- H. W. David, L. Stanley, “Confidence Interval Estimation of Interaction”, Epidemiology, 3(5), 452-456, 1992.