Assessment of Scattered-Bend Loss in Polymer Optical Fiber (POF) Displacement Sensor
 , Danial Haikal Mohd Razali 1, Chew Sue Ping 1, Nurul Sheeda Suhaimi 1, Sharifah Aishah Syed Ali 2, Nani Fadzlina Naim 3, Harry Ramza 4
Adv. Sci. Technol. Eng. Syst. J. 8(2), 123–129 (2023);
 DOI: 10.25046/aj080214
This work investigated the coupling behavior of the scattered-bend loss in displacement sensor during the bending of the fiber by using a multimode polymer optical fiber (POF). To utilize the scattered-bend effect for displacement measurement, a side coupling technique can be used by twisting a pair of POF fibers and bent the structure into a loop. The working principle of the sensor is quite simple. The bent radius grows smaller as the fiber draughts which simulate a change of displacement. The scattered-bend loss increases as the illuminating fiber is bent in decreasing angle and the light being coupled to the receiving fiber. The fabricated sensor is tested based on static measurement analysis and the sensor is characterized by its sensitivity, resolution, linearity, and repeatability error. From the experiment, the fabricated sensor has a range of roughly 160 mm with a sensitivity of 0.817 nW/mm, a resolution of 1.228 mm, and a repeatability error of 1.856 %. The sensor exhibits high linearity from 0 mm to 80 mm. The sensor’s design structure and analysis are simple, comprehensive, and cost-effective, with potential benefits in industrial applications.
1. Introduction
An optical fiber is a data transmission medium that uses lightwave propagation in conjunction with a fiber that is often constructed of glass or plastic. Optical fiber is mostly used in the application of high-speed and long communication. Various features of light behavior in optical fiber have been researched through time, including bend-loss studies which this work is based on and this paper is an extension of work originally presented in 2022 IEEE 9th International Conference of Photonics[1] among others [2], light propagation [3], coupled-mode theory [4] and scattering [5]. Until now, researchers have been attempting to explain many occurrences and properties in various types of optical fiber.
In sensing applications, most of the sensors can sense a variety of parameters such as temperature [6], pressure [7], displacement [8], biomedical [9], food quality [10,11] and chemical [12]. Many fibers have been used in the application of sensors such as glass optical fiber [13], polymer optical fiber, Fiber Bragg Grating [14], etc. In comparison to other fibers, POF is inexpensive, flexible [15] and is well known for its high reliability in short-distance communication and sensing applications. POF is widely recognized for its physical toughness, which can withstand the huge physical strain, as well as its low weight when compared to silica-based fiber, which is much more delicate and fragile due to the incredibly thin glass fiber it contains [16]. POFs are also immune to electromagnetic interference and have multiplexing capabilities [17].
1.1. Common Techniques
Researchers had offered many techniques to obtain a high-performance sensor with a simple structure and low-cost manufacture in Polymer Optical Fiber (POF) sensor applications [18]. Among the techniques proposed by researchers are long-period gratings [19], nonlinear effects [20], surface plasmon resonance [21] and fiber bragg gratings [22]. An intensity-based technique has addressed a high-performance, simple, and a low-cost sensor for various detections based on the approaches indicated above since it does not require specific equipment [23]. A sensor that uses light intensity as the measurement detecting technique is known as an intensity-based sensor [24]. The common sensor that uses an intensity-based sensor is a pressure sensor, temperature sensor, turbidity sensor, and displacement sensor. In terms of displacement measurement sensors, various methods have been proposed. Most of the methods are able to detect static, dynamic, and plane-in-out measurement analysis.
Diffraction grating technique [25] has achieved a 4 mm to 14 mm range of the best linearity for displacement range, however, it has a complicated design setup and complicated analysis, and the range is very small. The technique is found to be complicated because it requires a specific angle cut or called a diffraction angle at the end of the illuminating fiber which can cause a loss if the cut not clean enough. The analysis of this method is also difficult to determine the diffraction order its need to obtain the LED light wavelength, light cone angle, the period of the diffraction grating, and diffraction angle of the illuminating fiber.
This works integrated the principle of macro-bend loss and scattering loss to realize the fabricated sensor. The works studied and investigated the right tapered depth, bending angle and turns in order to optimize the results.
1.2. Macro-bend and Scattering Loss
The displacement sensor described in this research is based on the coupling of scattered-bend loss where to determine the scattering loss in POF, two fibers were twisted together. The first fiber is acting as illuminating fiber, while the second fiber couples scattered-bend radiation loss using the side coupling approach [26]. Fiber loss increases as a result of bending, as does coupling power. Based on this technique, the power coupling structure is employed for the displacement measurement sensor. The power coupling was visualized by measuring the outputs and calculate the coupling ratio at each bend diameter.
In optical application, there are a few detected types of losses in light transmission which are bend loss, dispersion loss, scattering and attenuation loss [27]. A bending loss is a loss that occurred due to the physical pressure where bending is applied to the optical fiber strand. There are two types of bending losses which are macroscopic bending and microscopic bending [28]. When the light source propagates, the power gets transferred into other modes, so the changing of the mode due to different refraction index due to bending makes the power leaked where the power will not continue to propagate in the fiber core, which the radiated light is known as scattering loss. This loss is caused by the material compositional fluctuation, density of the material, and manufacturing defects of the fiber [29]. Due to the bending of the fiber and density fluctuation in the core of the fiber, the loss is called scattered-bend loss.
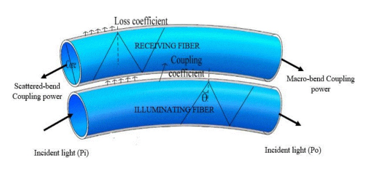
Figure 1: Coupled macro-bend and scattered-bend illustration.
In this method, the coupled scattered-bend loss has generated a polynomial to exponential-like curve while the macro-bend is producing an exponential curve [30]. This is caused by the power of the macro-bend being reflected at back-end of the receiving fiber. In general, due to the bending of fiber, consequently, there are two losses increase which are the macro-bend loss and scattered-bend loss. The macro-bend loss is propagating in the same direction as the light while a scattered-bend loss propagates in opposite direction toward the back-end of the receiving fiber. This can be illustrated in Figure 1.
To utilize the scattered-bend loss in the sensor application in this research, a polymer optical fiber, POF from ESKA Mitsubishi SK-40 bare multimode is used due to its durability and flexibility to the tightest bend and has a larger core which is 0.98 mm. To observe the relationship of the scattered-bend and macro-bend based on the changing of the bend radius, the coupling power received at both ends of the receiving fiber is measured and the ratio with respect to the LED input power can be calculated as:
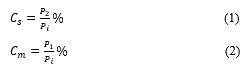
Where Cs is the coupling ratio of scattered-bend, P2 is the received power at the back-end of the fiber, Cm is the coupling ratio of macro-bend, P1 is the received power at forward-end of the fiber and Pi is the input power of the light source.
2. Experimental Design and Setup
Based on the coupling ratio of both macro-bend and scattered-bend equations, it can be observed that with the increases of bend-diameter, the power received at both back-end and forward-end is increasing. In this research, variation of the received power and bending diameter testing parameters are applied in displacement detection. The design of the sensor structure is shown in Figure 2 setup.
In the proposed structure, only a single light source as input is required for the illuminating fiber. The LED used is from Advanced Fiber Solutions, OS417N with an operating wavelength of 650 nm and output power measured, 6.475 mW. The power meter used is also from Advanced Fiber Solution, OM110N for detection of the received fiber at the back-end and forward-end of the receiving fiber. The power meter is set to 650 nm for calibration and the resolution of 1 mW or 0.01 dB.
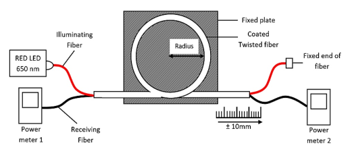
Figure 2: POF displacement sensor design structure.
For the main sensing part, a pair of twisted polymer optical fiber of SK-40 Bare Multimode POF is used and the fiber is coated with a black tube where in this experiment a black electrical shrink tube is used. The first fiber is connected to an LED source as an illuminating fiber. The second fiber is connected with a power meter to measure the received power both back-end and forward-end as receiving fiber. To test the sensor, the twisted fiber is bent to an initial 100 mm of bend radius, and adhesive tape is used to put the fiber at a fixed acrylic plate. The sensor is analyzed by using static measurement analysis with multiple variations of initial bend diameter.
During the experiment, the twisted fiber is manually pulled up to 100 mm for initial set loop with the changing of decreasing 10 mm displacement at each time. Each of the measurements is taken for both ends for scattered-bend and forward-end for macro-bend. From the result obtained, the losses of the light can be observed by the study of the graph of the received power. The tests are repeated three times to measure the repeatability of the reading for both the back-end and forward-end. The step will be repeated with setup loop of 80 mm and 60 mm loop. At the end of the experiment, the best result among the set loop of the sensor is characterized for the sensor parameter. The characterization of the sensor is based on performance parameters of resolution, sensitivity, repeatability error, and linearity of the reading and the obtained characteristic is compared with another studies.
3. Experimental Results
3.1 Coupling Power Ratio
Before the fabrication of the sensor, the coupling power response is studied and the result is being used as the reference element and for the verification of the sensor. Based on the coupling power ratio curve in Figure 3 and Figure 4, both losses in receiving fiber increase along with the decreasing bent diameter. This happened due to the increases of both losses in the illuminating fiber where with the side coupling effect, the light propagated from the illuminating fiber is radiated based on the evanescent wave theorem to receiving fiber. Most of the radiated power propagates parallel with the source but some of the power is refracted toward the back-end of the receiving fiber which is known as scattered-bend coupling power. When the fiber loop is pulled, the bend diameter is decreasing which causes the variation of coupling power.
Based on Table 1, the losses of the light in receiving fiber are decreasing at the forward end of the fiber from -44.06 dBm at 100 mm to -32.15 dBm at 20 mm. This also same goes to the power received at the back-end where the light losses also show a significant decrease from -51.50 dBm at 100 mm to -41.81 dBm at 20 mm. From observed Table 1, it is used for the displacement sensing and as guidance or reference to validate the sensor.
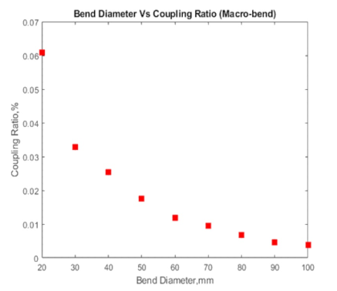
Figure 3: Macro-bend coupling power ratio.
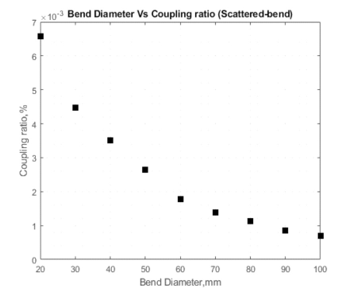
Figure 4: Scattered-bend coupling power ratio.
Table 1: Power losses from the reference power output.
| Power Received (dBm) | Total Power (dBm) | |||
| Diameter (mm) | Macro-bend | Scattered-bend | Macro-bend | Scattered-bend |
| 100 | -35.95 | -43.39 | -44.06 | -51.50 |
| 90 | -35.18 | -42.56 | -43.29 | -50.67 |
| 80 | -33.60 | -41.34 | -41.71 | -49.45 |
| 70 | -32.08 | -40.49 | -40.19 | -48.60 |
| 60 | -31.16 | -39.37 | -39.27 | -47.48 |
| 50 | -29.46 | -37.64 | -37.57 | -45.75 |
| 40 | -27.85 | -36.42 | -35.96 | -44.53 |
| 30 | -26.72 | -35.38 | -34.83 | -43.49 |
| 20 | -24.04 | -33.70 | -32.15 | -41.81 |
- Displacement Sensing Test
Figure 5 shows the initial bending diameter of the twisted bend part at 100 mm, 80 mm, and 60 mm used in the sensor structure. The bending diameter of the structure decreased in 10 mm at each test which increases the coupled power received at receiving fiber.
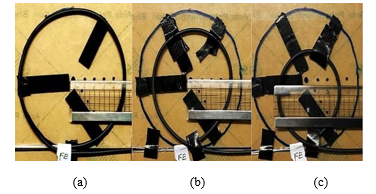
Figure 5: Initial bending diameter of sensor structure for (a) 100 mm, (b) 80 mm and (c) 60 mm
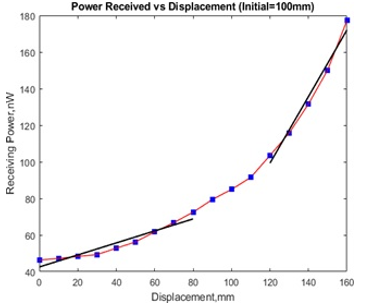
Figure 6: Received power at back-end of receiving fiber (Scattered-Bend coupling power).
Figure 6 showing the power received for the initial 100 mm bend diameter. It clearly shows that when the fiber is dragged 10 mm in each reading, the power received also increases. For macro-bend coupling power, it is producing an exponential curve relation as shown in Figure 7. From the experiment, both losses have producing good repeatability.
The step of the experiment is repeated by changing the loop bend diameter to 80 mm then 60 mm. As for a structure with an initial loop bend diameter of 100 mm, the smallest bend diameter at 160 mm displacement length is 50 mm. While the smallest diameter for initial loop bend of 80 mm is 30 mm at 160 mm displacement length, the smallest diameter for initial loop of 60 mm is 20 mm at 150 mm displacement length.
The result obtained can be verified by comparing the value of the power received of the tested sensor with the coupling power ratio graph.
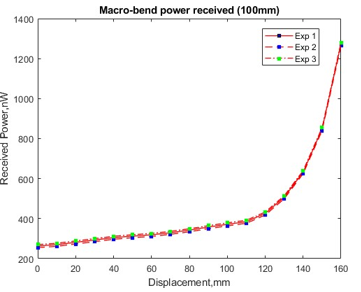
Figure 7: Macro-bend coupling received power at forward-end of receiving fiber.
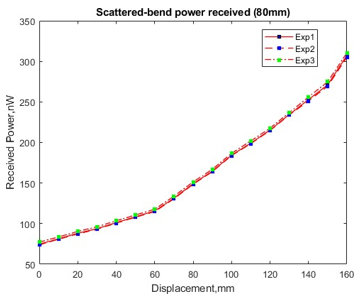
Figure 8: Scattered-bend coupling received power at forward-end of receiving fiber of 80 mm structure.
The power received should be in the range between the initial diameter and smallest diameter based on the coupling power ratio as shown in Figure 3 and Figure 4. The structure with 80 mm and 60 mm initial bend loop also shows a huge power gap between the changes of bend diameter for scattered-bend losses. This is because the characteristic of both losses is polynomial to exponential-like relation as in Figure 8 to Figure 11. This is also due to the increases of both losses at illuminating fiber which then transferred to receiving fiber by side coupling effect.
As in Figure 8 and Figure 9, both graphs showing the increases of the coupled power of scattered-bend for initial bend loop of 60 mm and 80 mm. In terms of the differences between received power, the coupling power of the macro-bend is particularly high compared to scattered-bend for all bending structures as shown in Figure 10 and Figure 11. This phenomenon happened because the macro-bending loss is producing a much higher loss due to the stress of the fiber which makes the refraction angle inside the fiber core is changes and then the light is radiated out from the core to the cladding. Due to the macro-bend is mostly propagate parallel with the light source the power received at the forward-end of the receiving fiber is higher compared to the back-end.
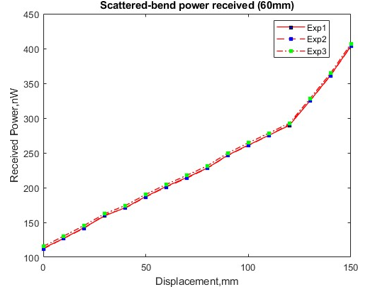
Figure 9: Scattered-bend coupling received power at forward-end of receiving fiber of 60 mm structure.
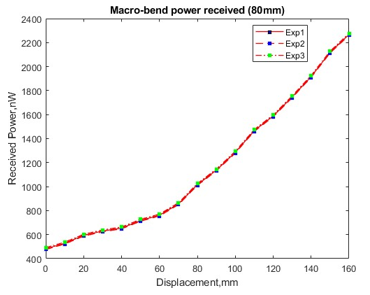
Figure 10: Macro-bend coupling received power at forward-end of receiving fiber of 80 mm structure.
While coupling power of scattering-bend loss is much lower because the scattering losses are considered a minor loss compared to macro-bend. This is because the scattering losses are caused by the density fluctuation and core defect which commonly ignore. Therefore, the coupled power of the scattered-bend in receiving fiber is very low.
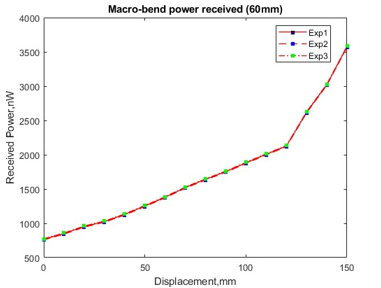
Figure 11: Macro-bend coupling received power at forward-end of receiving fiber of 60mm structure.
In comparison, the coupling power of scattered-bend loss is much stable, and the response showed by the scattered-bend loss coupling power towards the increases of displacement is much more suitable in displacement sensing application compared to macro-bend effect and characteristic of the proposed sensor has high reliability.
4. Sensor Characterization
The sensor characterization is a crucial part of sensing application. A sensor characterization is required to assess if the produced sensor is a good sensor [31]. In this experiment, the characterization parameters of the sensor that have been determined are sensitivity, linearity, resolution, and repeatability error as stated in Table 2. The characteristic will also be compared with other fiber-based displacement sensors in terms of the displacement range. The characterization is analyzed based on static measurement analysis. Based on the tested sensor, the best characteristic sensor is the structure that have an initial bend diameter of 100 mm, because the sensor is much more sensitive with the value of 0.817nW/mm, has a reasonable resolution value of 1.228 mm, and a small repeatability error of 1.858% compared to initial bend loop of 80 mm and 60 mm. Based on the comparison between techniques as in Table 3, the sensor proposed has one of the highest achieved displacement ranges which is up to 160 mm. If the tested sensor is compared with the linearity, the proposed sensor has good linearity at 0 mm to 80 mm and
120 mm to 160 mm where each linearity has a R2 of 0.9182 and 0.9777. The sensitivity of the sensor is 0.817mW/mm which was calculated by using:
Where S is the sensitivity of the sensor, ∆?2 is changes of received power at the back-end of the fiber, and ∆? is changes of displacement. For the repeatability error, the sensor is tested three times at each test using the repeatability testing method where statistical mathematics is used by calculating the pooled standard deviation of the output.
Table 2: Fabricated sensor performance parameters.
| Parameter | Measured Value | Reference Value |
| Range | 0 mm – 160 mm | 150mm -160mm |
| Sensitivity | 0.817nW/mm | 0.1nW/mm to 5nW/mm |
| Resolution | 1.228mm | 0.1mm to 1.5mm |
| Linearity | y = 0.3282x + 42.55
R2= 0.9182 |
0.8< R2 ≤1 |
| Repeatability Error | 1.856% | 2% to 1% |
Table 3: Comparison between the technique in sensor structure.
| Technique | Displacement Range |
| Twisted coupled macro-bend [32] | 0mm – 140mm |
| Diffraction grating Ended [25] | 4mm – 14mm |
| Dual-wavelength compensation [33] | 0mm – 10mm |
| Twisted coupled scattered-bend | 0mm – 160mm |
5. Conclusions
In this research, a displacement measurement displacement sensor is designed by using a polymer optical fiber (POF) where the sensing part is utilizing the scattered-bend loss by side coupling method utilizing macro-bend effect. A scattered-bend loss is a combination of the scattering losses with the bending loss of the fiber where the losses are caused by density fluctuation and physical bending of the fiber. The measurement of the scattered-bend coupled power is measured at the back-end and the macro-bend coupled power at the forward-end of the receiving fiber. Most of the losses generated propagated parallel with the light source and some of the losses are refracted toward the back-end of the receiving fiber. This phenomenon explains the reason coupled power received at the forward-end of the receiving fiber is higher compared to the power received at the back-end of the fiber. The fabricated sensor can detect a measurement of displacement up to 160 mm with a sensitivity of 0.817 nW/mm, resolution of 1.228 mm, and repeatability error of 1.856%. The fabricated sensor also has a simple structure and analysis, low cost and easy to set up. The sensor also has a high potential advantages on the industrial application such as civil structuring, building surveyor, architecture, earth movement, landslides and medicine. The future works may include the utilization of IoT subsystem to be part of the system where the data collected can be analyzed beforehand and send to the users.
Conflict of Interest
The authors declare no conflict of interest.
Acknowledgment
This work would not have been possible without the financial and facility support of the Department of Electrical and Electronics Engineering, Faculty of Engineering, National Defence University of Malaysia.
- L.S. Supian, D.H.M. Razali, S.A. Syed Ali, “Investigation of Scattered-Bend Loss Coupling in Polymer Optical Fiber (POF) – Based Displacement Measurement Sensor,” in 2022 IEEE 9th International Conference on Photonics (ICP), IEEE: 13–14, 2022, doi:10.1109/ICP53600.2022.9912445.
- A. Zendehnam, M. Mirzaei, A. Farashiani, L. Horabadi Farahani, “Investigation of bending loss in a single-mode optical fibre,” Pramana, 74(4), 591–603, 2010, doi:10.1007/s12043-010-0052-5.
- S. Addanki, I.S. Amiri, P. Yupapin, “Review of optical fibers-introduction and applications in fiber lasers,” Results in Physics, 10, 743–750, 2018, doi:10.1016/j.rinp.2018.07.028.
- A.W. Snyder, “Coupled-Mode Theory for Optical Fibers,” Journal of the Optical Society of America, 62(11), 1267, 1972, doi:10.1364/JOSA.62.001267.
- Z. Wang, H. Wu, X. Hu, N. Zhao, Q. Mo, G. Li, “Rayleigh scattering in few-mode optical fibers,” Scientific Reports, 6(1), 35844, 2016, doi:10.1038/srep35844.
- K. Tian, Y. Liu, Q. Wang, “Temperature-independent fiber Bragg grating strain sensor using bimetal cantilever,” Optical Fiber Technology, 11(4), 370–377, 2005, doi:10.1016/j.yofte.2005.03.001.
- W.J. Bock, J. Chen, P. Mikulic, T. Eftimov, “A Novel Fiber-Optic Tapered Long-Period Grating Sensor for Pressure Monitoring,” IEEE Transactions on Instrumentation and Measurement, 56(4), 1176–1180, 2007, doi:10.1109/TIM.2007.899904.
- G. Perrone, A. Vallan, “A Displacement Measurement System Based on Polymer Optical Fibers,” in 2008 IEEE Instrumentation and Measurement Technology Conference, IEEE: 647–651, 2008, doi:10.1109/IMTC.2008.4547116.
- R. Correia, S. James, S.-W. Lee, S.P. Morgan, S. Korposh, “Biomedical application of optical fibre sensors,” Journal of Optics, 20(7), 073003, 2018, doi:10.1088/2040-8986/aac68d.
- N. Albakri, S. Abdullah, L.S. Supian, N. Arsad, S.D. Zan, A.A.A. Bakar, “Assessment of Palm Oil Fruit Bunch Maturity based on Diffuse Reflectance Spectroscopy Technique,” in 2018 IEEE 7th International Conference on Photonics (ICP), IEEE: 1–3, 2018, doi:10.1109/ICP.2018.8533172.
- L.S. Supian, A.M.A. Amboalang, U.F.A. Rauf, K. Ismail, C.S. Ping, N.F. Naim, “Qualitative Assessment of Cooking Oil using Diffuse Reflectance Spectroscopy Technique,” in 2022 International Conference on Green Energy, Computing and Sustainable Technology (GECOST), IEEE: 221–226, 2022, doi:10.1109/GECOST55694.2022.10010506.
- S. Thomas Lee, R. Dinesh Kumar, P. Suresh Kumar, P. Radhakrishnan, C.P.G. Vallabhan, V.P.N. Nampoori, “Long period gratings in multimode optical fibers: application in chemical sensing,” Optics Communications, 224(4–6), 237–241, 2003, doi:10.1016/S0030-4018(03)01597-9.
- A.B.L. RIBEIRO, J.L. SANTOS, J.M. BAPTISTA, L.A. FERREIRA, F.M. ARAÚJO, A.P. LEITE, “Optical Fiber Sensor Technology in Portugal,” Fiber and Integrated Optics, 24(3–4), 171–199, 2005, doi:10.1080/01468030590922722.
- W. Du, X.M. Tao, H.Y. Tam, C.L. Choy, “Fundamentals and applications of optical fiber Bragg grating sensors to textile structural composites,” Composite Structures, 42(3), 217–229, 1998, doi:10.1016/S0263-8223(98)00045-2.
- Y. Koike, T. Ishigure, M. Sato, E. Nihei, “Polymer optical fibers,” in 1998 IEEE/LEOS Summer Topical Meeting. Digest. Broadband Optical Networks and Technologies: An Emerging Reality. Optical MEMS. Smart Pixels. Organic Optics and Optoelectronics (Cat. No.98TH8369), IEEE: III/13-III/14, doi:10.1109/LEOSST.1998.690041.
- L. Bilro, N. Alberto, J.L. Pinto, R. Nogueira, “Optical Sensors Based on Plastic Fibers,” Sensors, 12(9), 12184–12207, 2012, doi:10.3390/s120912184.
- W.E. van de Meent, EXPERIMENTAL DEMONSTRATION OF REDUCED BEND LOSSES IN LOW-CONTRAST POLYMER HYBRID WAVEGUIDES, 2015.
- D. Sartiano, S. Sales, “Low Cost Plastic Optical Fiber Pressure Sensor Embedded in Mattress for Vital Signal Monitoring,” Sensors, 17(12), 2900, 2017, doi:10.3390/s17122900.
- T. Eftimov, Sensor Applications of Fiber Bragg and Long Period Gratings, Springer Netherlands, Dordrecht: 1–23, doi:10.1007/978-1-4020-6952-9_1.
- K.O. Hill, B.S. Kawasaki, D.C. Johnson, Y. Fujii, Nonlinear Effects in Optical Fibers: Application to the Fabrication of Active and Passive Devices, Springer US, Boston, MA: 211–240, 1979, doi:10.1007/978-1-4684-3492-7_12.
- K. Kurihara, H. Ohkawa, Y. Iwasaki, O. Niwa, T. Tobita, K. Suzuki, “Fiber-optic conical microsensors for surface plasmon resonance using chemically etched single-mode fiber,” Analytica Chimica Acta, 523(2), 165–170, 2004, doi:10.1016/j.aca.2004.07.045.
- A.D. Kersey, T.A. Berkoff, W.W. Morey, “High-resolution fibre-grating based strain sensor with interferometric wavelength-shift detection,” Electronics Letters, 28(3), 236, 1992, doi:10.1049/el:19920146.
- D.S. Montero, C. Vázquez, “Polymer Optical Fiber Intensity-Based Sensor for Liquid-Level Measurements in Volumetric Flasks for Industrial Application,” ISRN Sensor Networks, 2012, 1–7, 2012, doi:10.5402/2012/618136.
- Polymer Optical Fiber-Based Sensors, EPFL Press: 365–408, 2011, doi:10.1201/b16404-14.
- M. Lomer, J. Zubía, J. Arrue, J.M.L. Higuera, “Principle of functioning of a self-compensated fibre-optical displacement sensor based on diffraction-grating-ended POF,” Measurement Science and Technology, 15(8), 1474–1478, 2004, doi:10.1088/0957-0233/15/8/007.
- L.S. Supian, M.S. Ab-Rahman, N. Arsad, “Polymer optical fiber tapering using chemical solvent and polishing,” EPJ Web of Conferences, 162, 01018, 2017, doi:10.1051/epjconf/201716201018.
- N. Uddin, M.R. M, S. Ali, “Performance Analysis of Different Loss Mechanisms in Optical Fiber Communication,” Computer Applications: An International Journal, 2(2), 1–13, 2015, doi:10.5121/caij.2015.2201.
- S. Savović, A. Djordjevich, I. Savović, “Theoretical investigation of bending loss in step-index plastic optical fibers,” Optics Communications, 475, 126200, 2020, doi:10.1016/j.optcom.2020.126200.
- C.-A. Bunge, R. Kruglov, H. Poisel, “Rayleigh and Mie scattering in polymer optical fibers,” Journal of Lightwave Technology, 24(8), 3137–3146, 2006, doi:10.1109/JLT.2006.878077.
- R.T. Schermer, J.H. Cole, “Improved Bend Loss Formula Verified for Optical Fiber by Simulation and Experiment,” IEEE Journal of Quantum Electronics, 43(10), 899–909, 2007, doi:10.1109/JQE.2007.903364.
- C.A.F. Marques, D.J. Webb, P. Andre, “Polymer optical fiber sensors in human life safety,” Optical Fiber Technology, 36, 144–154, 2017, doi:10.1016/j.yofte.2017.03.010.
- J. Liu, Y. Hou, H. Zhang, P. Jia, S. Su, G. Fang, W. Liu, J. Xiong, “A Wide-Range Displacement Sensor Based on Plastic Fiber Macro-Bend Coupling,” Sensors, 17(12), 196, 2017, doi:10.3390/s17010196.
- A. Vallan, M.L. Casalicchio, M. Olivero, G. Perrone, “Assessment of a Dual-Wavelength Compensation Technique for Displacement Sensors Using Plastic Optical Fibers,” IEEE Transactions on Instrumentation and Measurement, 61(5), 1377–1383, 2012, doi:10.1109/TIM.2011.2180975.