Development and Analysis of Models for Detection of Olive Trees

Adv. Sci. Technol. Eng. Syst. J. 8(2), 87–96 (2023);
 DOI: 10.25046/aj080210
In this paper, an automatic method for detection of olive trees in RGB images acquired by an unmanned aerial vehicle (UAV) is developed. Presented approach is based on the implementation of RetinaNet model and DeepForest Phyton package. Due to fact that original (pretrained) model used in DeepForest package has been built on images of various types of trees but without images of olive trees, original model detection was unsatisfactory. Therefore, a new image dataset of olive trees was created using sets of images chosen from five olive groves. For neural network training, individual olive trees were manually labeled, and new models were generated. Each model has been trained on different set of images from selected olive groves. Pretrained model and new models were compared and evaluated for various test scenarios. Obtained results showed high precision and recall values of proposed approach and great improvement in performance compared to the pretrained model.
1. Introduction
It is predicted that close to 10 billion people will live on Earth by 2050 [1]. At the moment, about 37% of the total land surface is used for food production [2], and it is estimated that the necessary increase in food production between 2010 and 2050 will be between 35% to 56% [3]. Needed increase in production can be achieved by increasing the share of agricultural land and/or increasing productivity on existing agricultural land by applying the so-called precision or smart agriculture [4]. Olive (Olea Europea) is one of the most widespread plants and plantations in the world. Olive oil is a basic ingredient in Mediterranean cuisine, and it is popular all over the world. Worldwide, consumption of olive oil has been constantly increasing [5]. According to the latest reports of the International Olive Council (https://www.internationaloliveoil.org), worldwide olive oil production for 2020/2021 crop year was just above 3.000.000 tons. Spain is the largest producer of olives and olive oil in the world (close to 50% of world production) and EU countries in total produce around 70% of world production. In 2019, the global olive oil market size was above 13 billion US dollars, and it is projected to reach 16.64 billion US dollars by 2027, with annual growth of 3.2% during the forecast period (2020-2027) [6].
Therefore, olive trees and olive oil are economically very important for the producing countries. On the demand side, world consumption of olive oil has also witnessed a substantial growth in the course of the three past decades [7]. This makes olive growing and oil production a good choice for research and implementation of new approaches aiming to respond to the challenges in food production. Complex systems such as those in agriculture should be continuously monitored, measured, and analyzed. The above implies the use of new information and communication technologies [8]. Remote sensing is the process of detecting and monitoring physical characteristics of larger areas [9] using satellites, aircraft, and drones. Therefore, farmers don’t need to physically visit all parts of the land to gather data that can be used to analyze different aspects of the crop and yield. The application of artificial intelligence and machine learning in agriculture is increasingly intensive due to its ability to understand, learn and react to different situations (based on learning) in order to increase the efficiency and quality of production.
Images collected for agricultural applications can be obtained from satellites such as ESA Sentinel-2A. However, these types of images depend on weather conditions (cloudiness) and have a low spatial resolution (Sentinel up to 10 m), which is not satisfactory for certain treatments [10]. It is to be expected that the temporal and spatial resolution will improve over time, but problems with clouds will certainly remain. The use of drones for data collection enables higher spatial resolution, the time of recording images is determined by the user, and data can be collected even in cloudy weather. A greater number of camera types are available (RGB, multispectral, hyperspectral, thermal). The collected data are of significantly higher quality than those collected by satellite [11]. Also, UAV-based imaging implies lower operational costs compared to imaging systems on manned aircraft or satellites, so it can be considered a preferred solution for monitoring smaller regions. The collected images can be used after applying different computer vision algorithms for different types of applications, such as counting and estimating the size of trees [12,13], assessing fruit maturity [14], assessing crops [15], plant diseases [16], etc.
Importance of counting and identification of olive trees in aerial images can be explained by multiple reasons. Perhaps the most obvious reason is that the number of trees is a fundamental criterion for the access to public grants by olive tree farmers. Another reason is the fact that crop yield estimation is based on the number of trees in the orchard (along with other parameters such as number and volume of fruits). Furthermore, irrigation plans and water management are based on inventory and arrangement of the trees in the orchard [17][18]. Also, detection and localization of individual tree is prerequisite for more advanced analysis of plant health and fruit status using remote sensing technology.
Counting of trees by humans is prone to errors but, first of all, it is tiresome and time-consuming. Therefore, automatization of this process is lately in focus of research community [19]. Availability of various sources of aerial images such as high-resolution satellite images, images acquired by unmanned aerial vehicles (UAVs) combined with advanced image processing algorithms, makes this task solvable.
The availability of different sensors has enabled different approaches in the detection of individual trees during the last decade. For example, some authors use hyperspectral and airborne laser scanning (ALS) for tree detection and classification [20]. In contrast to hyperspectral sensors that can use several hundreds of narrow frequency bands (10-20 nm) for detection, multispectral sensors usually use 3 to 15 frequency bands. The width of these bands is usually slightly larger. For example, the multispectral camera used by the popular UAV DJI Phantom 4 has, in addition to the RGB sensor (visible spectrum), 5 more monochrome sensors with a width of 32 or 52 nm. Captured wavelengths are: blue (450 nm ± 16 nm), green (560 nm ± 16 nm), red (650 nm ± 16 nm), red edge (730 nm ± 16 nm), near-infrared (840 nm ± 26 nm). Images obtained from hyperspectral sensors contain much more data than images from multispectral sensors and have a greater potential to detect differences among land and water features. However, multispectral sensors are very popular for precision agriculture because they are much cheaper than hyperspectral sensors. Also, from available multispectral information, various vegetation indexes can be calculated [21]. Vegetation indexes calculated for each image pixel can be used to enhance the presence of green, vegetation features and thus may distinguish plants from the other objects present in the image [22-24]. One of the most frequently used and implemented vegetation indexes calculated from multispectral information as normalized ratio between the red and near infrared bands is the Normalized Difference Vegetation Index (NDVI). NDVI correlates with chlorophyll, which in turn correlates with plant health (Figure 1). Based on calculated NDVI and utilization of red band thresholding, the algorithm for detection of olive trees, resulted in an overall estimation error of 1.3% [22]. Jan Peters et al. proposed an object-based classification method for detection of olive trees from multi-spectral images [23]. This approach was comprised of a four-step model: image segmentation, feature extraction, classification, and result mapping. Obtained overall accuracy was 84.3%.
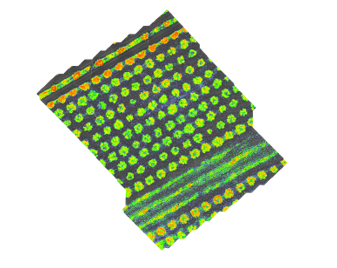
Figure 1: Example of a NDVI olive orchard image obtained with multispectral camera.
Sensor data can be used for more advanced image processing and analysis. The most popular classical methods of image analysis include machine learning (K-means, support vector machines – SVM), wavelet-based filtering, vegetation indices and regression analysis [25, 26]. In the image processing procedure, a preprocessing step is common (image segmentation, contrast enhancement and edge detection, color model selection, noise removal by filtering, feature extraction by various transformations, dimensionality reduction), after which object-based image analysis (OBIA) is performed [27].
An approach that uses classical image methods for the automatic detection and recognition of a single tree and labelling is presented in [28]. Authors pre-processed the images with the unsharp masking followed by improved multi-level thresholding-based segmentation. The circular Hough transform was applied for the identification of the circular blobs that presented single trees. Another study presented an algorithm that used RGB satellite images for a classification system. The system consists of several steps: it includes image pre-processing, image segmentation, feature extraction and classification [29]. All images were preprocessed to suppress the additive noise. Next, the region of interest was segmented from the pre-processed images using K-Means segmentation, through which statistical features were extracted and classified. The best classification results reported in that paper were achieved with Random Forest that outperformed other tested algorithms by an overall accuracy of 97.5%.
As in many other areas, deep learning has played an increasingly important role in the field of image processing in agriculture in recent years [30]. Changes in lighting, camera position and camera distance (height) to the ground significantly affect the performance of classical methods compared to methods that use deep learning. Compared to classical methods, the approach using deep learning requires larger computing resources and larger databases of labeled images for learning. The aforementioned limitations have been overcome or largely removed in recent years due to the availability of advanced graphics processors and tools for easy labeling of learning images. Also, publicly available image databases such as PASCAL Visual Object Classes (PASCAL VOC), Microsoft Common Objects in COntext (COCO) and ImageNet, which contain thousands of object classes and millions of images and are available to researchers for model training, are also useful in this area. Deep learning models can be tuned and trained to detect fruits on these bases using transfer learning. However, it can be noted that the mentioned bases do not contain images of orchards [31].
One recent example of implementation of deep learning for identification and mapping of trees can be found in [32]. In the presented approach, the UAV RGB photograph of the forest was automatically segmented into several tree crown objects using color and 3D information and the slope model. After that, an object-based CNN classification was applied for each crown image. Classification results of the presented system showed good results in classifying seven tree classes, including several tree species with more than 90% accuracy. Another recent paper presents deep learning-based approach for estimating the biovolume of individual trees [33]. In this paper, authors used Mask R-CNN and UAV images for olive tree crown and shadow segmentation.
DeepForest is an open-source (MIT license) Python package that uses deep learning object detection networks to predict bounding boxes corresponding to individual trees in RGB imagery [34]. In order to make training models for tree detection simpler, DeepForest use the RetinaNet model [35, 36] from the TorchVision package [37]. More precisely, the model was trained on images from 40m x 40m windows obtained from 1km x 1km maps downloaded from National networks of ecological observatories (NEON) using a semi-supervised LiDAR-based algorithm to generate millions of moderate-quality annotations for model pretraining. In the next step, the pretrained model was retrained on over 10,000 hand annotations of RGB imagery from six NEON sites which further improved generalization abilities. Obtained model can be used directly to make predictions for new data or used as a foundation for retraining the model using labelled data from a new application.
Individual tree detection may not seem particularly difficult computer vision task at first, but it can be a demanding task for various reasons. Perhaps the biggest problem are closely planted trees forming joint crowns. In olive growing, this type of problems is related to extensive types of orchards (orchards with lower productivity per hectare, low mechanization level, small amount of labor relative to the area under cultivation) which is not usual for larger plantations with larger production of olive fruits and oil. Other challenges are related to varying sizes of trees in an orchard, misaligned plantation of trees, different types of soil and vegetation under trees, etc. As a result, there is quite vivid research activity in this field.
Although the use of other types of sensors, such as multispectral ones, could make the detection and labeling of individual trees simpler (as could be assumed by analyzing Figure 1), in this work we are focused on the use of RGB sensors as the most widespread and cheapest. In order to simplify and speed-up the process, only 2D information from the obtained terrain maps was used. Our approach is based on the implementation of deep neural networks for detection, more precisely on adaptation of the DeepForest package. Due to fact that original (prebuilt) model used in DeepForest package has been built on images from various types of trees but without images of olive trees, it was expected that results obtained on that model would not be good enough for implementation on olive groves. Therefore, a new image dataset of olive trees was created, individual olive trees were labeled, and new models were created. New models were built using different sets of images chosen from five olive groves. Since those olive groves had different characteristics, choice of olive groves used for model creation was important for detection results. This paper is an extension of work originally presented in conference 2022 International Conference on Software, Telecommunications and Computer Networks [38]. In this work, comparing to conference paper, a more detailed explanation of multiple models creation will be given. Also, in addition to detailed comparison of various models, analysis of the detection results for one olive orchard monitored in different seasons of year will be done.
Contributions of this paper are following: we propose a methodology for automatic olive trees detection based on adaptation of publicly available open source DeepForest package. Image dataset of five olive orchards were annotated and used for further research. Also, we present analysis on the variability of the olive trees detection results with the same neural network model in the case of olive grove surveillance at different times of year.
The remainder of the paper is organized as follows: in Section 2 the proposed methodology is described, along with the test sites description and used software tools. In Section 3, a detailed description of used procedure is given. Section 4 presents the results of the tree detection based on implementation of our models. The discussion and conclusion are then presented in Section 5.
2. Materials and Methods
2.1. Study Sites
For this study, five olive orchards were surveyed (Figure 2). Two orchards were in Mravinci, north of Split, Croatia (Mravinci01: 43°31’40.7” N, 16°30’57.8” E and Mravinci02: 43°31’37.4” N, 16°30’57.8” E). Both olive orchards at this location can be classified as extensive. They are characterized with irregular pruning and non-uniform shaping of trees. Most of the trees are free vise shaped while smaller number of trees have monoconical and globe shaped plants. Other three orchards were located in Tinj, south-west of city of Benkovac in Zadar County, Croatia (Tinj01: 44°00’49” N, 15°28’13.2” E, Tinj02: 44°01’10.6” N, 15°28’19.5” E and Tinj03: 44°00’26” N, 15°29’31.0” E). All olive trees at this location were vise shaped and rather heavy pruned. Since olive orchard at Tinj03 location is quite large (12.000 olive trees), surveillance with UAV did not cover all plants. In four separate flights (Flight01, Flight02, Flight03, Flight04), around 5% of total area was covered (around 600 olive plants detected and annotated). Each flight for this olive grove was used for generating separate map and, in this paper, each is treated individually for the analysis.
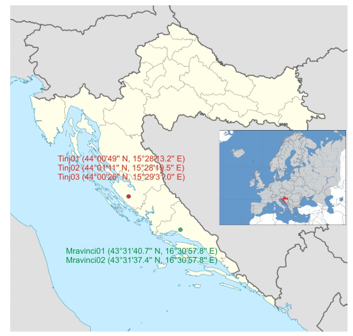
Figure 2: Locations of surveyed olive groves (Dalmatia region, Croatia). Three olive orchards in Tinj and two in Mravinci.
Also, one of the orchards (Tinj02) has been mapped in two different seasons of year (May and December) in order to analyze differences in detection performance not only for different orchards but also for the same orchard surveilled at different seasons and times of day.
Both observed regions have a Mediterranean climate characterized by dry summers and mild, wet winters. The UAV flights were performed on five dates: 10 May 2021 (Mravinci01), 11 May 2021 (Tinj01 and Tinj02), 20 December 2021 (Tinj02), 18 January 2022 (Mravinci02) and 5 April 2022 (Tinj03).
2.2. UAV for Images Acquisition
Nine image datasets were acquired using high resolution sensors onboard UAV platform to monitor the olive groves. RGB and multispectral images were collected using the camera on DJI Phantom 4 Multispectral drone. DJI Phantom 4 Multispectral drone is equipped with camera with six 1/2.9” CMOS (Complementary metal–oxide–semiconductor) image sensors. One CMOS sensor is RGB sensor for visible light imaging while other five sensors are used for multispectral imaging. Each sensor has 2.08 megapixels (MP).
For this research, we used only information from RGB sensor. In order to collect images needed for making the map of an olive orchard, UAV was programmed to fly at 35 m above ground altitude (AGL) with airspeed of 5 m/s. The forward and sideway image overlaps were 75%. Ground sampling distance (GSD) was 2 cm.
2.3. Software Tools
DJI Terra (https://www.dji.com/hr/dji-terra) was used as a flight planner software. Also, this software was used for stitching of the collected multispectral and RGB images and production of 2D terrain maps of monitored olive orchards (Figure 3). Since maps generation is a compute-intensive process, minimum hardware configuration for map reconstruction using DJI Terra is 16GB RAM and a NVIDIA graphics card with at least 4GB VRAM. For this purpose, one NVIDIA GForce RTX 3060 GPU with 12 Gb VRAM was used.
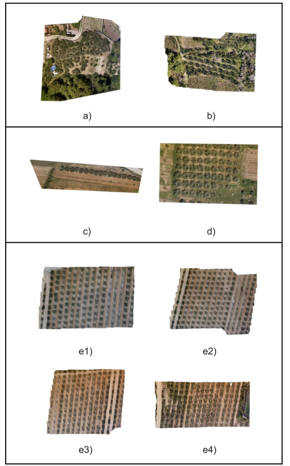
Figure 3: Maps of olive groves. a) Mravinci01, b) Mravinci02, c) Tinj01, d) Tinj02, e1) Tinj03 – Flight01, e2) Tinj03 – Flight02, e3) Tinj03 – Flight03, e4) Tinj03 – Flight04.
Labeling of individual olive trees on generated olive orchard maps was done using Computer Vision Annotation Tool (https://www.cvat.ai/). It is a free (for individual data scientists and small teams) web-based image and video annotation tool used for labeling data for computer vision algorithms. Labeled annotations for object detections was done in Pascal VOC format [39]. Each label is defined with four values (xmin, ymin, xmax, ymax): where xmin and ymin are coordinates of the upper left corner of the rectangle label and xmax and ymax are coordinates of the lower right corner of the rectangle label.
Implementation and evaluation of object (olive tree) detectors and image processing was done using Python 3.10.4. programming language with the DeepForest package that comes with the prebuilt RetinaNet model from the torchvision package. Proposed implementation has been done on Windows operating system although the package has been tested also on MacOS, and Linux.
2.4. RetinaNet Detector
Popular object detection models can be broadly classified into two categories: two-stage and single-stage detectors. Two-stage detectors are using one model to extract regions of objects (first stage), and a second model is used to classify and further refine the localization of the object (second stage). Single-stage detectors have only one model which skip the region proposal stage of two-stage models and run detection directly over a dense sampling of locations. Comparing to two-stage detectors, these types of models usually have faster inference (possibly at the cost of performance) [40]. RetinaNet is a single-stage detector which is fast and has accuracy comparable to two-stage detectors. RetinaNet uses a feature pyramid network (FPN) [41] which enables the detection of objects at multiple scales and introduces a new loss, the Focal loss function [35], to alleviate the problem of the extreme foreground-background class imbalance. Focal Loss function approach addresses this problem that occurs in single-stage detectors by assigning less weight to easily classified examples and focusing on correcting misclassified ones. RetinaNet’s network architecture FPN backbone is on top of a feedforward ResNet architecture [42] with the goal of generating rich, multi-scale convolutional feature pyramid. RetinaNet attaches two subnetworks to this backbone, one for classifying anchor boxes and one for regressing from anchor boxes to ground-truth object boxes (Figure 4).
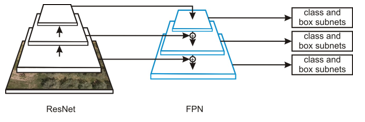
Figure 4: ResNet network architecture.
3. Procedure
After collecting sets of images for five olive orchards (parameters described in Section 2.2.), maps of olive groves for each flight were obtained with DJI Terra software. Each map was annotated using CVAT i.e. individual olive trees were labeled as a ground truth. However, generated maps have higher resolution than the images used for training the prebuilt RetinaNet model from the DeepForest package. Furthermore, their resolution may, generally, vary depending on the flight parameters and used sensor.
In order to get better predictions, it is necessary to divide each map into smaller windows that are more similar to the data on which the DeepForest model was trained. When forecasting, the input map is divided into smaller overlapping windows and then the model in each window tries to detect trees. Detections from all windows are then collapsed into detections (predictions) on the entire map, while redundant filtering is carried out frame by the non-max suppression method. This method keeps only the highest reliability frame from all detections whose predicted limit frames match more than the default intersection over union (IoU) threshold (Figure 5).
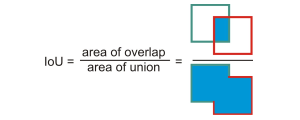
Figure 5: IoU illustration.
First detection results were obtained using the pretrained DeepForest model. Different window sizes (ranging from 600 x 600 to 1000 x 1000 pixels with a step of 50) with different “overlaps” (10-40% with a step of 5%) were tested and evaluated on maps Tinj1 and Tinj2 (Figure 3). During inference, the model tries to detect olive trees on each window, and afterwards, detections from all windows are compressed into detections on the whole map.
Finally, the windows size of 750 x 750 pixels was chosen with an overlap of 20%. For the pretrained model, the best predictions were obtained using confidence limit (τ) of 0.3.
Table 1: Models trained, N – total number of trees in maps (ground truth objects)
| Model | Trained on maps | N |
| M1 | Tinj02 | 69 |
| M2 | Tinj03 – Flight01 | 133 |
| M3 | Tinj02, Tinj03 – Flight01 | 202 |
| M4 | Tinj02, Tinj03 – Flight01, Tinj03 – Flight04 | 356 |
| M5 | Tinj03 – Flight01, Tinj03 – Flight04 | 287 |
| M6 | Tinj02, Tinj03 – Flight01, Mravinci02 | 277 |
| M7 | Tinj02, Tinj03 – Flight01, Tinj03 – Flight04, Mravinci02 | 431 |
| M8 | Tinj01, Tinj03 – Flight01, Tinj03 – Flight04, Mravinci02 | 381 |
Since the prebuilt model had been trained on various types of trees and not olives, further steps were needed in order to improve predictions and reduce the number of other trees being detected as olive trees. Therefore, an adaptation of the pretrained RetinaNet model to the local data using transfer learning was done. During this step, eight new models were trained. For each model, different labeled maps were used for training (Table 1).
Again, for new models, various windows sizes with different “overlaps” were tested. After tests, an image size of 1000 × 1000 pixels with 40% overlap was chosen.
Each network was trained for five epochs with stochastic gradient descent with a momentum of 0.9, a learning rate equal to 0.001 and a confidence threshold of 0.7. All trained models used a confidence threshold of 0.5 at inference time. As already written, a confidence threshold of 0.3 was chosen for the pretrained model because, in this case, all predicted bounding boxes had low confidence scores.
4. Results
4.1. Performance Evaluation
In order to evaluate the proposed methodology, exact number of olive trees in the evaluation areas was determined by a human observer (ground truth). The performance assessment of the methodology was approached by comparing the actual number of plants, and their distribution with the results of detection of a deep neural network for eight created models (and pretrained model).
A number of metrics defined below are proposed for quantitative assessment.
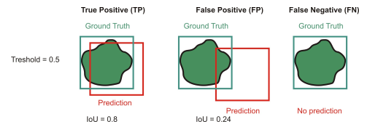
Figure 6: Examples of TP, FP and FN bounding boxes when default IoU = 0.5.
Using the calculated IoU value each predicted bounding box is classified into one of the following categories (illustrated in Figure 6):
- True Positive (TP): detection is correct (predicted frame matches with correct) if valid IoU >= threshold,
- False Positive (FP): the detection is wrong (a frame is provided for the object which is not in the picture, or the intended frame does not match the correct one) if IoU < threshold,
- False Negative (FN): the object in the image is not detected.
Precision: presents the hit ratio for the trees found by the algorithm.
![]()
where TP (true positives) is the number of olive trees correctly identified by the algorithm, and FP (false positives) is the number of instances wrongly proposed by the algorithm as potential olive trees.
Recall: presents the proportion of the trees correctly found by the algorithm.
![]()
where FN (false negatives) is the number of olive trees that were not identified.
F1 score: the harmonic mean of precision and recall,
![]()
For the calculation of previous metrics, IoU value of 0.5 was used (the most commonly used values for IoU are 0.5 and 0.75 [43]).
Average precision (AP): summarizes the precision recall curve into one number, it can be interpreted as the area under the precision-recall (PR) curve.
![]()
where p(r) is Precision for particular Recall value.
Precision – Recall (PR) curve is obtained by plotting points (r(τ), p(τ)) where r(τ) and p(τ) denote precision and recall at confidence threshold τ. In practice, the area is calculated under interpolated monotone curve instead of the actual ”zig-zag” PR curve. Average precision is calculated according to MS COCO [44]. For AP calculation, 101 recall points on the PR curve are used (0 to 1 with a step size of 0.01). More precisely, AP@0.5 calculated with a fixed IoU threshold of 0.5 is used, while AP is obtained by averaging AP@α for IoU thresholds α from 0.5 to 0.95 with a step size of 0.05.
4.2. Evaluation Results
In this section, the evaluation results for the trained olive tree detectors will be presented. Tables 2 and 3 show evaluation results of all 9 models on maps Tinj03 – Flight02 and Tinj03 – Flight03. As it can be seen from Table 1, these maps weren’t used for any model’s training.
Combined results for both maps (Tinj03 – Flight02 and Tinj03 – Flight03) are presented in Table 4.
This maps present parts of a large orchard (each map corresponds to one drone flight). Since the implementation of computer-based tree counting and labeling is particularly interesting for large orchards (small orchards are economically less significant), results for that type of orchards are the focus of our interest and basis for a future applications.
As expected, model (M5) for which training phase used only other parts (maps) of the same orchard (Tinj03), showed slightly better results than others but differences were not significant, moreover, two models have higher precision (M2 and M8) and one (M8) has higher AP. Recall and F1 measure, as can be seen, of the pretrained model lags significantly behind models trained on images of olive groves obtained by drone.
Table 2: Results for map Tinj03 – Flight02
| Model | Precision | Recall | F1 | AP@0.5 | AP |
| pretrained | 0.1212 | 0.0258 | 0.0426 | 0.0069 | 0.0044 |
| M1 | 0.3333 | 0.1935 | 0.2449 | 0.1034 | 0.0354 |
| M2 | 0.9434 | 0.9677 | 0.9554 | 0.9585 | 0.6484 |
| M3 | 0.9212 | 0.9806 | 0.9500 | 0.9754 | 0.6652 |
| M4 | 0.9375 | 0.9677 | 0.9524 | 0.9567 | 0.6037 |
| M5 | 0.9500 | 0.9806 | 0.9651 | 0.9750 | 0.6441 |
| M6 | 0.9379 | 0.9742 | 0.9557 | 0.9632 | 0.6408 |
| M7 | 0.9157 | 0.9806 | 0.9470 | 0.9645 | 0.6367 |
| M8 | 0.9487 | 0.9548 | 0.9518 | 0.9479 | 0.6512 |
Table 3: Results for map Tinj03 – Flight03
| Model | Precision | Recall | F1 | AP@0.5 | AP |
| pretrained | 0.2667 | 0.0500 | 0.0842 | 0.0194 | 0.0092 |
| M1 | 0.4545 | 0.2188 | 0.2954 | 0.1565 | 0.0352 |
| M2 | 1.0000 | 0.8875 | 0.9404 | 0.8812 | 0.5256 |
| M3 | 0.9605 | 0.9125 | 0.9359 | 0.9094 | 0.5650 |
| M4 | 0.9813 | 0.9813 | 0.9813 | 0.9787 | 0.6016 |
| M5 | 0.9691 | 0.9813 | 0.9752 | 0.9799 | 0.6514 |
| M6 | 0.9419 | 0.9125 | 0.9270 | 0.8968 | 0.5034 |
| M7 | 0.9398 | 0.9750 | 0.9571 | 0.9604 | 0.5981 |
| M8 | 0.9810 | 0.9688 | 0.9748 | 0.9601 | 0.6474 |
Table 4: Mean metrics value on maps Tinj03 – Flight02 and Tinj03 – Flight03
| Model | Precision | Recall | F1 | AP@0.5 | AP |
| pretrained | 0.1939 | 0.0379 | 0.0634 | 0.0131 | 0.0068 |
| M1 | 0.3939 | 0.2061 | 0.2701 | 0.1300 | 0.0353 |
| M2 | 0.9717 | 0.9276 | 0.9479 | 0.9199 | 0.5870 |
| M3 | 0.9409 | 0.9466 | 0.9429 | 0.9424 | 0.6151 |
| M4 | 0.9594 | 0.9745 | 0.9668 | 0.9677 | 0.6026 |
| M5 | 0.9596 | 0.9809 | 0.9701 | 0.9774 | 0.6478 |
| M6 | 0.9399 | 0.9433 | 0.9413 | 0.9300 | 0.5721 |
| M7 | 0.9277 | 0.9778 | 0.9520 | 0.9625 | 0.6174 |
| M8 | 0.9649 | 0.9618 | 0.9633 | 0.9540 | 0.6493 |
According to the results from table 4, it can be commented that models M5 and M8 stand out as the best possible options in this case.
Since majority of models used some maps from Tinj03 orchard (7 out of 9), more objective detection results may be the ones obtained for Tinj02 orchard (5 out of 9). Results for Tinj02 are presented in Table 5.
Again, the best model (M4) in this case, used map of the orchard in the training phase. The best model for previous case (M5) showed rather low precision result (0.7941) while one of the best models for detections on Tinj03 maps – M8 showed rather high precision (0.9552) and recall (0.9275) values on this map, also. Both models, M5 and M8 have not used Tinj02 maps in training phase. Detections obtained by applying these two models to two evaluation maps and the Tinj02 map (neither of these models used Tinj02 map for the training) compared to detections of the pretrained model are presented in Figure 7.
Table 5: Results for map Tinj02 (flight from May 2021).
| Model | Precision | Recall | F1 | AP@0.5 | AP |
| pretrained | 0.6585 | 0.7826 | 0.7152 | 0.669 | 0.2795 |
| M1 | 0.9296 | 0.9565 | 0.9429 | 0.9465 | 0.5526 |
| M2 | 0.873 | 0.7971 | 0.8333 | 0.7472 | 0.2496 |
| M3 | 0.8481 | 0.971 | 0.9054 | 0.9669 | 0.5378 |
| M4 | 0.9571 | 0.971 | 0.964 | 0.9661 | 0.5688 |
| M5 | 0.7941 | 0.7826 | 0.7883 | 0.7358 | 0.1567 |
| M6 | 0.9286 | 0.942 | 0.9353 | 0.9374 | 0.5684 |
| M7 | 0.9167 | 0.9565 | 0.9362 | 0.9291 | 0.512 |
| M8 | 0.9552 | 0.9275 | 0.9412 | 0.9146 | 0.4582 |
Corresponding to this, Table 6 presents the exact number of detected olive trees, ground-truth labels, TP, FP, and FN. It can be noted that, on map Tinj03 – Flight 02 (Figure 7), in both models (M5 and M8), some of the fig trees planted between olives were mistaken for olive trees.
Next evaluation was done on the detection results for an extensive orchard that has not been used for training of any model (Mravinci01 – Figure 3.a.). Mravinci01 can be seen as a special case of the olive grove because it is characterized by irregular pruning, overlapping tree crowns, and the non-uniform shaping of trees. Moreover, in this aerial image, various types of trees are also present, apart from olives. In the case of the map Mravinci01, even human annotators have a hard time labeling olive trees. Precision and recall values are significantly lower than in previous cases.
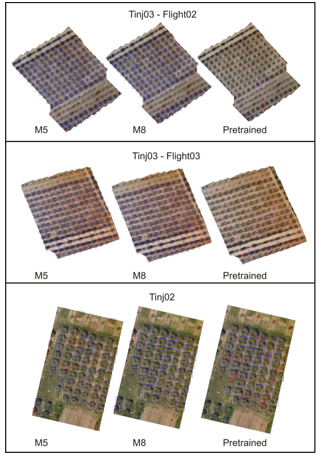
Figure 7: Detections made by model M5, model M8 and pretrained models. True positive (TP) detections are shown in blue, false positive (FP) detections are shown in red.
Table 6: Model M5, model M8 and pretrained model detections on maps Tinj03 – Flight02, Tinj03 – Flight03 and Tinj02
| map | true boxes | model | detections | TP | FP | FN |
| Tinj03 – Flight02 | 155 | M5 | 160 | 152 | 8 | 3 |
| M8 | 156 | 148 | 8 | 7 | ||
| pretrained | 33 | 4 | 29 | 151 | ||
| Tinj03 – Flight03 | 160 | M5 | 162 | 157 | 5 | 3 |
| M8 | 158 | 155 | 3 | 5 | ||
| pretrained | 30 | 8 | 22 | 152 | ||
| Tinj02 | 69 | M5 | 68 | 54 | 14 | 15 |
| M8 | 67 | 64 | 3 | 5 | ||
| pretrained | 82 | 54 | 28 | 15 |
Best precision was achieved with model M6 (0.5068) and highest recall was achieved with model M3 (0.6138). This is expected due to aforementioned reasons, as well as lack of proper training examples for model generation (only Mravinci02 map can be considered as extensive orchard but with larger distances between trees). However, even here, significant improvement of generated models over pretrained model can be confirmed – precision for pretrained model was 0.1205 and recall 0.0516. The pretrained model produced drastically more false positives, especially on the part of the map with the pine trees (Figure 8).
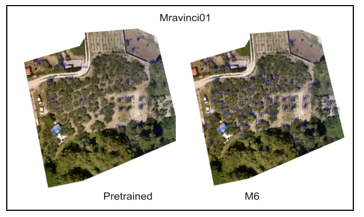
Figure 8: Special case: M6 vs Pretrained model comparison for olive grove Mravinci01.
Finally, we present analysis results of differences in detection performance for the same orchard surveilled at different seasons and times of day. One of the test orchards (Tinj02) has been mapped in May (and used for generating some of models presented in Table 1) and later in December of the same year (2021). Detection results for second flight (map) are given in Table 7.
Table 7: Results for map Tinj02 (flight from December 2021).
| Model | Precision | Recall | F1 | AP@0.5 | AP |
| pretrained | 0.6706 | 0.7215 | 0.6951 | 0.5425 | 0.1995 |
| M1 | 0.8462 | 0.8354 | 0.8408 | 0.8217 | 0.367 |
| M2 | 0.75 | 0.6456 | 0.6939 | 0.4926 | 0.1676 |
| M3 | 0.8222 | 0.9367 | 0.8757 | 0.9039 | 0.4976 |
| M4 | 0.9605 | 0.9241 | 0.9419 | 0.92 | 0.5043 |
| M5 | 0.9016 | 0.6962 | 0.7857 | 0.6863 | 0.2983 |
| M6 | 0.9737 | 0.9367 | 0.9548 | 0.9302 | 0.5083 |
| M7 | 0.9012 | 0.9241 | 0.9125 | 0.9124 | 0.4457 |
| M8 | 0.9733 | 0.9241 | 0.9481 | 0.9196 | 0.4576 |
As opposite to results presented in Table 5, for the second flight, the best performance has been achieved with model M6. Interesting, performance of some models was better for December flight than for May flight (M6, M8). Precision and recall comparison for all models is presented in Figures 9 and 10.
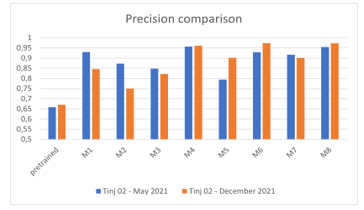
Figure 9: Precision comparison for Tinj02 maps.
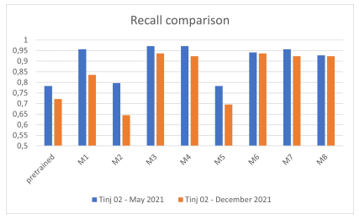
Figure 10: Recall comparison for Tinj02 maps.
When compared to variations (absolute differences) in results for all models between two similar maps taken the same day in the same large orchard, absolute differences were similar. For instance, average absolute difference for precision results between maps generated for Tinj02 flights is 0.048 while the average absolute difference for precision results between maps generated for Tinj03-Flight02 and Tinj03-Flight03 is 0.054. This implies that detection results for the same olive orchard are not to be significantly degraded during period of several months. However, this should be confirmed on a larger number of test cases.
5. Discussion and conclusion
Automatic olive tree detection is a task with many challenges. Acquired images of the olive groves can vary significantly due to different types of soil and vegetation in orchards, changes in vegetation during seasons, the age of the orchard and tree sizes, irregular pruning and pruning types, the non-uniform shaping of trees, changes in weather conditions and illumination. Also, trees in the orchard can be planted very closely, forming joint crowns, and making it very difficult, even for human annotator, to label individual tree. In this paper, we presented a procedure for development of a deep learning object detector for detecting individual olive trees from aerial RGB images by fine-tuning the prebuilt RetinaNet model on local data.
During development of the olive trees object detector, several models were trained using a different training set of images – different olive grove maps. Maps of five diverse olive groves (small and large) were generated but the focus was on automatization of monitoring a large olive grove such as Tinj03. Comparison of model performance for the olive tree detection in different times of the year was presented. As it can be seen from the obtained results, there was generally no degradation in detection. For some particular tests such as evaluation of detections from diverse parts of the orchard in Tinj03, the best performing models were the model M5 which uses only other parts of the same orchard as the training data, and model M8, which expands that data with images from two other olive groves (Tinj01 and Mravinci02). As already said, even though the olive groves such as Tinj03 will be the focus of future research, a trained detector should be generalizable to orchards with diverse vegetations and various-sized olive trees. In this context, for further use, we propose the model M4 and, alternatively, M8. Although there is no clear winner between tested models, perhaps M4 could be considered as the most reliable. Proposed model (M4) has been trained on 356 ground truth olive trees while the runner-up (M8) has been trained on 381 ground truth olive trees which classifies them in top 3 models according to the number of trees used for training. This indicates that further improvements can be expected with additional training examples.
Comparing to the prebuilt model that showed very poor performance in olive trees detection, experimental results have shown the dominance in performance of fine-tuned models. Achieved precision and recall even with the relatively small training dataset (generally > 95% for heavy pruned orchards) makes this approach useful for the implementation.
Findings related to the fairly stable detection results of the same olive orchard taken several months apart are certainly interesting because, to the best of our knowledge, there has been no such analysis in the literature so far.
There are several directions for future research. The most imminent one should be utilizing the olive-tree detector for olive groves analysis, such as crop yield estimation and monitoring plant health and fruit status using vegetation indices. Automated collection of images of individual olive trees will greatly speed up and facilitate the analysis process. Image processing procedures aimed at obtaining information about plant health (e.g. from NDVI index values) or plant water status (e.g. from thermal camera data) will be able to be automated, because in this way only the part of the image related to an individual tree (output from the detector) will be brought to the input.
Moreover, as noted, there is still room for further improvement of the obtained detection model(s) by expanding the existing training datasets with more aerial images of olive trees from different localities, types of pruning and in different seasons to obtain more robust olive detectors.
Conflict of Interest
The authors declare no conflict of interest.
- National Research Council, Division on Earth and Life Studies, Board on Earth Sciences and Resources, Committee on Strategic Directions for the Geographical Sciences in the Next Decade, Understanding the Changing Planet: Strategic Directions for the Geographical Sciences, National Academies Press, 2010.
- C.I. Gan, R. Soukoutou, D.M. Conroy, Sustainability Framing of Controlled Environment Agriculture and Consumer Perceptions: A Review. Sustainability 2023, 15(1), 304. https://doi.org/10.3390/su15010304.
- M. Dijk, T. Morley, M.L. Rau, S. Yashar, A meta-analysis of projected global food demand and population at risk of hunger for the period 2010–2050, Nature Food, 2, 2021, 494–501, https://doi.org/10.1038/s43016-021-00322-9.
- M. Elferink, F. Schierhorn, Global Demand for Food is Rising. Harvard Business Review April 07, 2016.
- D. Niklis, G. Baourakis, B. Thabet, G. Manthoulis, “Trade and logistics: the case of the olive oil sector,” in MediTERRA 2014. Presses de Sciences Po, 203–226, 2014, doi : 10.3917/scpo.cihea.2014.02.0203.
- F. B. Insights, “Olive oil market size, share & covid-19 impact analysis, by type (refined olive oil, virgin olive oil, olive pomace oil, and others), end-user (household/retail, food service/horeca, food manufacturing, and others), and regional forecast, 2020–2027”, 2021.
- S. Mili, M. Bouhaddane, “Forecasting Global Developments and Challenges in Olive Oil Supply and Demand: A Delphi Survey from Spain”. Agriculture, 2021, 11(3), 191. https://doi.org/10.3390/agriculture11030191.
- Kamilaris, A., Gao, F., Prenafeta-Boldú, F.X., Ali, M.I., “Agri-IoT: A Semantic Framework for Internet of Things-Enabled Smart Farming Applications“. 3rd World Forum on Internet of Things (WF-IoT) IEEE, Reston, VA, USA, 442–447, 2016, doi: 10.1109/WF-IoT.2016.7845467.
- W. Bastiaanssen, D. Molden, I. Makin, “Remote sensing for irrigated agriculture: examples from research and possible applications“. Agric. Water Manag. 46 (2), 137–155, 2000, doi: 10.1016/S0378-3774(00)00080-9.
- P. Nevavuori, N. Narra, T. Lipping, “Crop yield prediction with deep convolutional neural networks“, Computers and Electronics in Agriculture, vol. 163, 2019, https://doi.org/10.1016/j.compag.2019.104859.
- A. Matese, P. Toscano, S. F. Di Gennaro, L. Genesio, F. P. Vaccari, J. Primicerio, C. Belli, A. Zaldei, R. Bianconi, B. Gioli, “Intercomparison of UAV, aircraft and satellite remote sensing platforms for precision viticulture“. Remote Sensing, 7(3):2971-2990, 2015, https://doi.org/10.3390/rs70302971.
- M. Waleed, T. -W. Um, A. Khan and Z. Ahmad, “An Automated Method for Detection and Enumeration of Olive Trees Through Remote Sensing,” in IEEE Access, vol. 8, 108592-108601, 2020, doi: 10.1109/ACCESS.2020.2999078.
- J. M. Ponce, A. Aquino, B. Millan, J. M. Andújar, “Automatic Counting and Individual Size and Mass Estimation of Olive-Fruits Through Computer Vision Techniques,” in IEEE Access, vol. 7, pp. 59451-59465, 2019, doi: 10.1109/ACCESS.2019.2915169.
- S. Benalia, B. Bernardi, J. Blasco, A. Fazari, G. Zimbalatti, “Assessment of the Ripening of Olives Using Computer Vision”, Chemical Engineering Transactions. 58, 355-360, 2017, https://doi.org/10.3303/CET1758060.
- Petteri Nevavuori, Nathaniel Narra, Tarmo Lipping, “Crop yield prediction with deep convolutional neural networks”, Computers and Electronics in Agriculture, vol. 163, 2019, https://doi.org/10.1016/j.compag.2019.104859.
- X. Liu, W. Min, S. Mei, L. Wang, S. Jiang, “Plant Disease Recognition: A Large-Scale Benchmark Dataset and a Visual Region and Loss Reweighting Approach”, IEEE Transactions on Image Processing, vol. 30, 2003-2015, 2021, doi: 10.1109/TIP.2021.3049334.
- N. T. Waskitho, “Unmanned aerial vehicle technology in irrigation monitoring”, Advances in Environmental Biology, vol. 9, no. 23, pp. 7–10, 2015.
- C. Albornoz, L. F. Giraldo, “Trajectory design for efficient crop irrigation with a UAV,” 2017 IEEE 3rd Colombian Conference on Automatic Control (CCAC), 2017, 1-6, doi: 10.1109/CCAC.2017.8276401.
- Z. Zhen, L. J. Quackenbush, and L. Zhang, “Trends in automatic individual tree crown detection and delineation—evolution of lidar data,” Remote Sensing, vol. 8(4): 333. https://doi.org/10.3390/rs8040333.
- M. Dalponte, H. O. Orka, L. T. Ene, T. Gobakken, and E. Nasset, “Tree crown delineation and tree species classification in boreal forests using hyperspectral and als data”, Remote Sensing of Environment, 140, 306–317, 2014. https:// doi.org/10.1016/j.rse.2013.09.006.
- G. Avola, S.F. Di Gennaro, C. Cantini, E. Riggi, F. Muratore, C. Tornambè, and A. Matese, “Remotely Sensed Vegetation Indices to Discriminate Field-Grown Olive Cultivars”, Remote Sensing, 11, 1242, 2019, https://doi.org/10.3390/rs11101242.
- I. N. Daliakopoulos, E. G. Grillakis, A. G. Koutroulis, I. K. Tsanis, “Tree crown detection on multispectral vhr satellite imagery”, Photogrammetric Engineering & Remote Sensing, 75(10), 1201–1211, 2009, DOI: 10.14358/PERS.75.10.1201.
- J. Peters, F. Van Coillie, T. Westra, R. De Wulf, “Synergy of very high resolution optical and radar data for object-based olive grove mapping”, International Journal of Geographical Information Science, 25(6), 971–989, 2011, https://doi.org/10.1080/13658816.2010.515946.
- R. Sarabia, A. Aquino, J. M. Ponce, G. Lopez, J. M. Andújar, “Automated identification of crop tree crowns from uav multispectral imagery by means of morphological image analysis”, Remote Sensing, 12(5), 748, 2020, https://doi.org/10.3390/rs12050748.
- L. Saxena, L. Armstrong, “A survey of image processing techniques for agriculture”. Proceedings of Asian Federation for Information Technology in Agriculture, Australian Society of Information and Communication Technologies in Agriculture. Perth, Australia, 401-413, 2014.
- E. Hamuda, M. Glavin, E. Jones, “A survey of image processing techniques for plant extraction and segmentation in the field”, Computers and Electronics in Agriculture, 125, 184–199, 2016, doi:10.1016/j.compag.2016.04.024.
- A. Singh, B. Ganapathysubramanian, A.K. Singh, S. Sarkar, “Machine learning for high-throughput stress phenotyping in plants”, Trends Plant Sci. 21 (2), 110–124, 2016, DOI:https://doi.org/10.1016/j.tplants.2015.10.015.
- A. Khan, U. Khan, M. Waleed, A. Khan, T. Kamal, S. N. K. Marwat, M. Maqsood, F. Aadil, “Remote sensing: An automated methodology for olive tree detection and counting in satellite images,” IEEE Access, 6, 77 816–77 828, 2018, doi: 10.1109/ACCESS.2018.2884199.
- M. Waleed, T.-W. Um, A. Khan, and U. Khan, “Automatic detection system of olive trees using improved k-means algorithm”, Remote Sensing, 12,(5), 2020, https://doi.org/10.3390/rs12050760.
- A. Kamilaris, F.X. Prenafeta-Boldú, “Deep learning in agriculture: a survey”, Computers and Electronics in Agriculture, 147, 70–90, 2018, https://doi.org/10.1016/j.compag.2018.02.016.
- I. Sa, Z. Ge, F. Dayoub, B. Upcroft, T. Perez, T., C. McCool, “Deepfruits: a fruit detection system using deep neural networks”. Sensors, 16(8) , 2016, https://doi.org/10.3390/s16081222.
- M. Onishi, T. Ise, “Explainable identification and mapping of trees using UAV RGB image and deep learning”, Scientific reports, 11(1), 903, 2021, https://doi.org/10.1038/s41598-020-79653-9.
- A. Safonova, E. Guirado, Y. Maglinets, D. Alcaraz-Segura, S. Tabik, “Olive tree biovolume from uav multi-resolution image segmentation with mask r-cnn”, Sensors, 21(5), 2021, https://doi.org/10.3390/s21051617.
- B. G. Weinstein, S. Marconi, M. Aubry-Kientz, G. Vincent, H. Senyondo, E. P. White, “Deepforest: A python package for RGB deep learning tree crown delineation”, Methods in Ecology and Evolution, 11(12), 1743–1751, 2020, https://doi.org/10.1111/2041-210X.13472.
- T.-Y. Lin, P. Goyal, R. Girshick, K. He, P. Dollar, “Focal loss for dense object detection”, 2017 IEEE International Conference on Computer Vision (ICCV), 2999–3007, 2017, doi: 10.1109/ICCV.2017.324.
- T. -Y. Lin, P. Goyal, R. Girshick, K. He and P. Dollár, “Focal Loss for Dense Object Detection,” in IEEE Transactions on Pattern Analysis and Machine Intelligence, vol. 42, no. 2, pp. 318-327, 1 Feb. 2020, doi: 10.1109/TPAMI.2018.2858826.
- S. Marcel, Y. Rodriguez, „Torchvision the machine-vision package of torch“, Proceedings of the 18th International Conference on Multimedea 2010, Firenze, Italy, October 25-29, 2010, DOI: 10.1145/1873951.1874254.
- I. Marin, S. Gotovac, V. Papić, “Individual Olive Tree Detection in RGB Images,” 2022 International Conference on Software, Telecommunications and Computer Networks (SoftCOM), 2022, 1-6, doi: 10.23919/SoftCOM55329.2022.9911397.
- M. Everingham, L. Van Gool, C. K. Williams, J. Winn, and A. Zisserman, “The pascal visual object classes (VOC) challenge”, International Journal of Computer Vision, 88 (2), 303-338 2010, https://doi.org/10.1007/s11263-009-0275-4.
- C. Coelho, M. F. P. Costa, L. L. Ferras, A. J. Soares, “Object detection with retinanet on aerial imagery: The algarve landscape”, International Conference on Computational Science and Its Applications. Springer, 2021, 501–516, DOI: 10.1007/978-3-030-86960-1_35.
- T.-Y. Lin, P. Doll´ar, R. Girshick, K. He, B. Hariharan, S. Belongie, “Feature pyramid networks for object detection”, 2017 IEEE Conference on Computer Vision and Pattern Recognition (CVPR) 936-944, 2017, DOI: 10.1109/CVPR.2017.106.
- K. He, X. Zhang, S. Ren, J. Sun, “Deep residual learning for image recognition”, 2016 IEEE Conference on Computer Vision and Pattern Recognition (CVPR), Las Vegas, NV, USA, 2016, pp. 770-778, doi: 10.1109/CVPR.2016.90.
- R. Padilla, W. L. Passos, T. L. B. Dias, S. L. Netto, E. A. B. da Silva, “A comparative analysis of object detection metrics with a companion open-source toolkit”, Electronics,, 2021, 10(3), 279, https://doi.org/10.3390/electronics10030279.
- T.-Y. Lin, M. Maire, S. Belongie, L. Bourdev, R. Girshick, J. Hays, P. Perona, D. Ramanan, C. L. Zitnick, P. Dollar, „Microsoft COCO: Common objects in context,”, Computer Vision – ECCV 2014. ECCV 2014, Lecture Notes in Computer Science, 8693. Springer, Cham, https://doi.org/10.1007/978-3-319-10602-1_48.