Metaheuristic Optimization Algorithm Performance Comparison for Optimal Allocation of Static Synchronous Compensator
 , Emmanuel Idowu Ogunwole 3, Dolapo Eniola Owolabi 4, Abdulsamad Bolakale Jimoh 5, Fatina Mosunmola Aremu 6
Adv. Sci. Technol. Eng. Syst. J. 8(1), 116–124 (2023);
 DOI: 10.25046/aj080114
The relevance of static synchronous compensator (STATCOM) controllers in controlling power network parameters is causing them to be included in contemporary networks. But for the intended objectives to be attained, the best device positioning and parameter settings are essential. This work compares the performance of the particle swarm optimization (PSO) and firefly algorithm (FA) in sizing and placing a STATCOM device for the dual objectives of loss reduction and voltage deviation abasement. The effective mitigation of network loss and voltage fluctuations in the network will be achieved by the deployment of the efficient method during device allocation. While PSO and FA were taken into consideration due to their computational efficiency among other metaheuristic algorithms, STATCOM was chosen from among the Flexible Alternating Current Transmission System (FACTS) controllers as a consequence of its reactive power compensation capability. The MATLAB software was used to implement the simulations on an IEEE 14-bus system. When STATCOM was optimized with PSO and FA, it resulted in active power loss reductions of 432 and 733 kW, respectively, and reactive power loss reductions of 1622 and 2100 kVAr, respectively. As a result, the reductions in voltage variation and power losses in this instance show some benefits of FA over PSO. Additionally, this work has shown that metaheuristic algorithms are beneficial for allocating FACTS devices.
1. Introduction
In current use, a power system is a system made up of a large number of power plants, transmission lines, loads, and transformers [1–2]. Increased power consumption causes transmission lines to become overloaded, which makes the power systems unstable. The system must thus operate very near its stability limit. This typically leads to a poor voltage profile and considerable network power loss [3–4].
The deployment of Flexible Alternating Current Transmission System (FACTS) devices and the building of new transmission lines are two options for addressing the problem of the power system overloading [5]. The construction of new power generation and the upgrading of transmission lines to reduce line congestion are both fraught with challenges. Increased load demands, constraints on the economy and the environment, and power networks operating nearer to their stability limits are all implications of the reorganization of the electrical sector [6]. For the aforementioned reasons, the power networks frequently encounter losses and voltage instability, which can result in voltage collapse. Sustaining the system’s stability and safety is therefore a crucial and challenging problem.
To improve system stability and security, several strategies, including reactive power compensation (RPC) and phase shifting, are used [7]. The RPC is the strategy that is most frequently employed and well-liked among them since power networks are mostly reactive. Reactive power is required to maintain voltage magnitudes for transmitting active power across transmission lines. The primary source of power losses is the use of reactive power above the threshold set by the generators. By utilizing compensators, power losses may be reduced to a minimum. Different types of RPCs are employed in power networks to compensate for reactive power [8].
Power electronics and FACTS device advancements have made it possible to manage line flows, reduce overall system loss, and keep the voltage profile within permissible bounds in a power system [9]. FACTS are regulators that may alter several features of a transmission network. Through system parameter management, they also possess the capacity to swiftly and seamlessly consume or provide reactive power to the networks. These allow for voltage control on a specific bus.
Different categories have been established for FACTS devices. The work by [10] demonstrated the modeling of the FACTS device and its integration into power flow investigations. The position of the STATCOM, a shunt-type FACTS regulator, in the grid significantly affects losses and voltages and is primarily employed by power engineers for reactive power adjustment. The objective of STATCOM placement, an optimization issue, is to minimize power loss while respecting system constraints [11]. Power flow equations are utilized to demonstrate equality limitations, while upper and lower voltage limits are employed to represent inequality constraints. Swarm intelligence and population-based optimization techniques are frequently used to determine the ideal sizes for the devices, while load flow approaches continue to be a viable tool for determining the precise position for placement of these regulators.
FACTS allocation problems have been addressed using a variety of metaheuristic techniques, including Tabu Search (TS), Bat Algorithms (BAT), Whale Optimization Algorithm (WOA), Ant Lion Optimization (ALO) Algorithm, Simulated Annealing (SA), Artificial Bee Colony (ABC), etc. To boost network transfer performance, ABC was utilized by [12] to deploy FACTS regulators in the best possible way. To enhance the loadability of a power system, GA was utilized to efficiently deploy FACTS regulators in a power network. To minimize voltage magnitude changes and losses, BFOA was used by [13] to determine the best location for UPFC devices. However, there has not been much research done to date to compare the effectiveness of these techniques in FACTS regulator optimization for transmission network capability improvement. Among all the metaheuristic optimization methods, the FA and PSO are two of the most efficacious. The FA was developed based on the distinctive ways that fireflies attract one another. On the other hand, the PSO took inspiration from how insects behave while searching for food. Both the FA and PSO have been demonstrated to be reliable methods for resolving optimization problems, particularly in power systems. Thus, the efficacies of the FA and PSO in solving optimization problems in power systems cannot be overemphasized.
In this study, the STATCOM controller’s allocation to enhance network voltage and diminish active and reactive losses is discussed. The implementations of PSO and FA for locating this regulator were described and applied to the IEEE 14-bus system because of their quick convergence and precision compared to other techniques. Two stages of the research were carried out: To begin with, a load flow study was done to find the buses that were over the typical range of permissible voltages. Second, PSO and FA methods were used for sizing the device needed for loss minimization. This study makes a contribution by contrasting the effectiveness of PSO and FA for deploying STATCOM controllers to enhance network functionality. Also, this study is novel in that it implements two separate metaheuristic optimization approaches to allocate STATCOM in the best way possible and determines which methodology is more effective; as a result, it assists power system engineers in society in adopting the quickest and most effective technique for resolving power system issues encountered in society to boost the general standard of living.
2. Model of STATCOM Controller
This controller is a regulator used for reducing transmission losses and alleviating voltage magnitude violation problems. It is made up of a parallel-connected controller and a static VAR generator, which uses different switching patterns within its converter to generate or absorb reactive power. To provide a sufficient supply of electricity, STATCOM corrects for reactive power in the electricity grids. When deployed, it moves more quickly between supplying and consuming reactive power, minimizing power losses and voltage fluctuations.
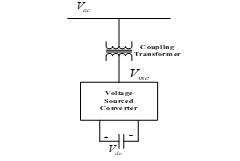
Figure 1: STATCOM controller configuration [15]
2.1. Mode of Operation
A simple STATCOM arrangement is shown in Fig. 1. It comprises a connecting transformer, a capacitor, and a voltage source converter (VSC). A series of three-phase voltages are created from the DC voltage by the VSC. The coupling transformer’s functions include connecting the VSC to the high voltage side and preventing short circuits in the DC capacitor [14]. A change in 3-phase converter voltage Vvsc varies the reactive supply to the network. If the STATCOM output voltage Vvsc more than the network’s voltage Vac (i.e., Vvsc > Vac), the controller injects reactive power to the grid. Furthermore, if Vvsc does not exceed Vac (i.e., Vvsc < Vac), the STATCOM consumes reactive power from the grid. However, when Vvsc and Vac the same (i.e., Vvsc = Vac), the STATCOM is in standby mode.
2.2. STATCOM Power Flow Model
To control voltage, STATCOM either absorbs or provides reactive power to the network. The STATCOM connection at bus m is shown in Fig. 2.
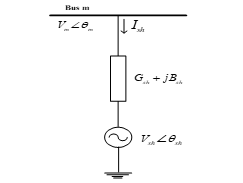
Figure 2: STATCOM Controller Equivalent
Bus m load flow equations following STATCOM deployment are stated as (1)–(4).
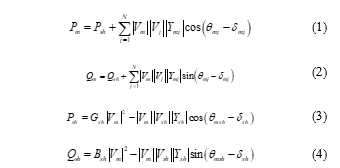
where, , = voltage at bus m and at STATCOM, respectively, Pm, Qm and Psh, Qsh = bus m active and reactive power, and STATCOM, Ysh, Gsh and Bsh = STATCOM’s admittance, conductance, and susceptance, = admittance of the line, N = number of buses.
3. Formulation of Problem
The optimum location of FACTS controllers to reduce losses is written as [16]:
Minimize f(x, σ)
subject to
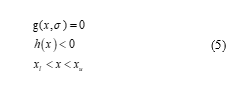
where, g(x), h(x) = equality and inequality constraints, f(x) = total branch loss, σ = system load data, xl and xu = the minimum and maximum range.
The solution approach entails optimizing the objective function while satisfying the network restrictions, which include the load flow equations, voltage restrictions, and control parameter bounds [17].
3.1. Objective Function
This is done primarily to reduce overall active loss while remaining within the constraints [18].
![]()
where, gk = conductance in p.u., is the bus number, Vi and Vj = voltage magnitudes in p.u., = bus number adjusted to bus i.
3.2. Equality Constraints
Each particle power flow equation is represented by (7)–(8). The load flow solution employs the Newton-Raphson approach.
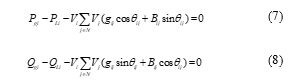
where, Bij= susceptance of the branch.
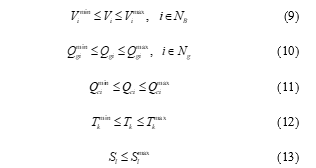
3.3. Inequality Constraints
The load and generator voltages, capacitive reactive power and transformer-tap settings, active and reactive line flow restriction, and power injection are all written as
3.4. Fitness Function Formulation
It is written as
![]()
The PF, which is the penalty function, is written as in (15).
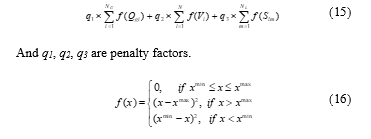
where, xmin and xmax = control parameters.
4. Particle Swarm Optimization
PSO, an algorithm influenced by nature, was created in 1995 by Drs. James Kennedy and Russell Eberhart [19]. This algorithm uses particle populations to identify the optimum solution. Each particle is taken into account as a potential solution throughout the search process.
The phrases “particle,” “swarm,” “position,” “swarm fitness,” “Pbest,” “gbest,” and the maximum and minimum permitted velocity values are all related to PSO.
Particles are generated at random by the method inside the scope of the function domain. The optimum position that individual particle i has found in the search space is shown by its current velocity (v), personal best position (yi), and current position (x). Every particle in a d-dimensional area tracks them according to: xi = (xi1, xi2,…,xid), vi = (vi1, vi2,…,vid), and Pbest = (Pbesti,1, Pbesti,2,…,Pbesti,d).
If there are s particles in the swarm.
Then, i ϵ 1, …, s.
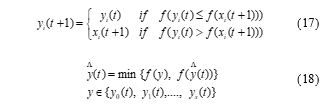
At each iteration, (17) and (18) update each particle. For each dimension if xij, yij, and vij be the jth dimension present position, personal best position and velocity of the ith particle. The new velocity is given by (19).
![]()
To determine the particle’s new position, the new velocity is added to its present position.
![]()
To reduce the likelihood of the particle exiting the search space, all dimensional values of vi are restricted to [-vmax, vmax]. The vmax is determined by (21).
![]()
where, xmax = domain space search, c1 and c2 = coefficients of acceleration.
The PSO convergence behavior is controlled by the inertial weight, which is obtained using (22).
![]()
where, iteramax = maximum number of iteration, itera = number of iteration, wmax and wmin = maximum and minimum weighting factor.
4.1. PSO Implementation Algorithm for STATCOM Allocation
The IEEE 14-bus system was utilized to implement PSO. The particle placements were influenced by the initial control variable limitations. Computing the fitness value represented by (14), with the intention of reaching the reduced global best, yielded evaluations of the control variables. The steps for implementing the technique are as follows:
- The population size, total number of iterations, and all control parameters are specified.
- Set iteration number = 0.
- Create the populations and velocities of the particles.
- For loss calculations, run the Newton-Raphson power flow for each individual particle.
- Determine the fitness value for each particle by (14).
- Determine the Pbest and gbest for each particle.
- Let iteration=iteration + 1.
- If there is a voltage restriction breach, the velocity and displacement of each individual particle are calculated using (19).
- Find the new location of each particle by (20).
- To calculate the power, run the Newton-Raphson power flow for each particle.
- Using (14), find the fitness value for each particle.
- If the particle’s current fitness P is higher than Pbest, set Pbest to equal P.
- Set gbest to Pbest.
- Up until the allotted iteration’s number is reached, continue from step 7.
The smallest loss values from the relevant fitness value are used to calculate the parameters of gbest and the optimum values for the control parameters.
5. Firefly Algorithm
Yang created this algorithm, which is a method for tackling challenging optimization issues quickly [20, 21].
5.1. Firefly Behavior
According to the inverse-square law, the relationship between the intensity of light, I, and distance, r, is inverse. Due to this, the majority of fireflies may be seen at night for a brief period of time, such as a few hundred meters, which is sufficient for flies to converse. A potentially optimizable objective function is used to simulate the flashing light.
5.2. Implementation of Firefly Algorithm
There are three fundamental presumptions that should be taken into account and are stated below [22] for simplicity in the FA description:
- Fireflies have no gender.
- As the distance between fireflies grows, both attractiveness and brightness decrease.
- The objective function’s terrain influences the firefly brightness.
The objective functions used in FA for the optimization problem are brightness and light intensity. Finding the optimal solution is similar to being drawn to and moving toward the firefly that is brighter [23].
5.3. Light Intensity and Attractiveness
FA is influenced by two variables: light intensity fluctuation and attractiveness formation.
The brightness of the firefly i and the distance between the two fireflies are both factors in the attractiveness, I, of the firefly i to the firefly j [24]. The expression for light’s intensity, which changes with distance, is stated as (23).
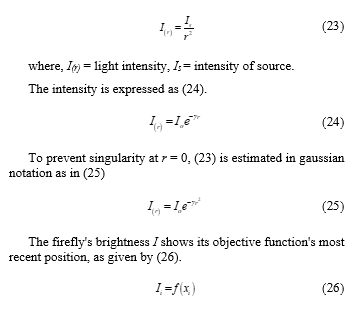
Each firefly has an attractiveness value represented by β, and the less-bright firefly is drawn to the more-bright firefly. The formula for the variation of β with the distance, r, is stated in (27).
![]()
where, γ = absorption coefficient of the media light, β0 = attractiveness value of firefly at r = 0.
5.4. Distance and Movement
The formula for the distance rij between the ith and jth fireflies, respectively located at xi and xj, is given by (28).
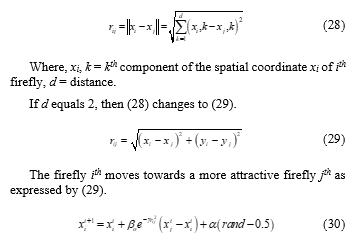
Where, rand = random number within [0, 1], t = current iteration number, α = value randomly selected often inside [0, 1], xj = brighter firefly location, xi = less bright firefly, γ = absorption coefficient and it lies in the range of 0.01 and 10.
The algorithm compares the new firefly attractiveness position value to the previous value. If the new site has a higher attraction rating than the old one, the firefly moves there; otherwise, it stays put. A predetermined fitness value determines the FA termination criterion. The brightest firefly will travel at random, according to (31).
![]()
The firefly will move randomly if there are no other fireflies around that are brighter. Up until the stopping condition is satisfied, the aforementioned procedures are repeated. The largest and best-predicted position and capacity are represented by the brightest firefly [25].
5.5. FA Implementation Algorithm for STATCOM Allocation
The following are the procedures in the Firefly algorithm for power flow incorporating a STATCOM controller.
- Enter the network data (independent parameters such as active power of all generators except the swing bus, generators’ voltages, regulating transformer-tap setting, reactive power injection) while meeting different equality and inequality constraints.
- Initiate the firefly algorithm’s parameters and constants, such as α, β0 and γ.
- Set the iteration count to 1 and generate ‘n’ fireflies at random.
- Execute the base case load
- Use the mathematical formulation of the objective function in (14), to calculate the fitness function of each firefly for loss minimization.
- The fitness values are used to generate Pbest values for all of the fireflies, with gbest being the best of the Pbest
- Calculate each firefly’s attraction distance by utilizing (29).
- For each firefly, new values are computed.
- Firefly’s position is updated using (30).
- For each of the fireflies’ new places, new fitness values are calculated. If a firefly’s new fitness value is higher than its old Pbest value, it is set to its current fitness value. Gbest is calculated using the most recent Pbest data.
- The iteration number is increased, and if it has not attained its maximum, the process proceeds to step 3 unless convergence is obtained.
- Sort the fireflies into categories based on the current global best. The optimal STATCOM capacities in ‘n’ candidates are determined by Gbest firefly, with the position denoting the location and the results presented.
6. Results and Discussion
The load flow study findings, in addition to the applicability of the suggested PSO and FA for STATCOM controller optimum allocation to minimize losses and voltage violations of the IEEE 14-bus network, are shown. The control variables that were tuned include the voltage magnitude, tap parameters of the transformer, and STATCOM output. Table 1 shows these data for these control variables.
Accounting for the STATCOM power injection concept, MATLAB codes for a load flow study were written. These were employed for the load flow study in both cases—without and with the STATCOM controller. During the implementation and evaluation of both approaches on the IEEE 14-bus system, voltage profile augmentation and real as well as reactive power losses were employed as performance metrics.
Table 1: Restrictions on Control Parameters
| S/N | Parameters | Limits |
| 1 | Voltage Magnitude | 0.95 – 1.05 p.u |
| 2 | Tap Settings of the Transformer | 0.90 – 1.10 p.u |
| 3 | Static Compensator MVAr | 0.00 – 100 MVAr |
6.1. Voltage Profile
The magnitudes of the network voltages are shown in Fig. 3. This implies that the bus voltage magnitudes were greatly enhanced following STATCOM regulator optimization using FA as opposed to when the PSO approach was used for the identical device setup. Bus voltage magnitudes across the entire test network are all within the permissible limits of 0.95 to 1.05 p.u., culminating in dependable network operation. The discrepancy was lessened by these two methods. FA did, however, provide the greatest voltage deviation minimization results in this circumstance.
Buses 2 and 3 offer a compelling justification for this performance. When optimizing with PSO, the bus 2 voltage was 1.048 p.u., and it was 1.046 p.u. after the controller was deployed with FA. The voltage magnitude at bus 3 increased from 0.96 to 0.98 p.u. and then to 0.99 p.u. as a result of optimization utilizing PSO and FA. Given that the anticipated voltage is 1.00 p.u., the best suitable method is one in which network influences attempt to return the voltage to that value.
6.2. Minimization of Active Power Loss
Utilizing optimization techniques for placement strategies, the FACTS controller decreased the active power loss. Fig. 4 depicts the active power loss data for both the PSO and FA-placed STATCOM controllers, as well as the base case. The overall active loss for the base case was recorded at 6.251 MW. Applying PSO and FA to integrate the device reduced the loss to 5.819 and 5.518 MW. The overall loss was minimized by 0.733 MW following the device’s incorporation using FA as opposed to 0.432 MW when PSO was employed.
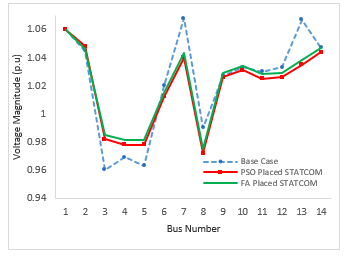
Figure 3: Voltage profile comparison
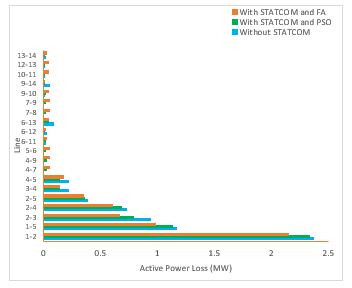
Figure 4: Active power loss minimization for all the cases
By rerouting the system load flow, the loss was reduced. PSO had a loss reduction of 6.9%, whereas FA had a loss reduction of 11.73%. This indicates that FA fared better than PSO in the active loss reduction of the system under study. A more thorough evaluation of the effectiveness of the two techniques in terms of loss reduction is also illustrated in Fig. 4. All of the lines displaying loss decreased following the controller installation utilizing the FA and PSO techniques. The degree of loss reduction does, however, differ between the two strategies. The green bars (loss with the PSO technique) have a substantially higher magnitude than the red bars (FA-placed STATCOM). As seen in the red illustration, these reductions with FA-placed STATCOM substantially outweigh those with PSO placement. The overall loss minimization is shown in Fig. 5 to help understand how well PSO and FA may be used to optimize STATCOM controllers. It is impossible to exaggerate the advantages of FA over the PSO algorithm. Cost reductions were achieved as a consequence of FA’s better minimization findings for active loss and voltage profile augmentation. The STATCOM controller’s presence led to a redistribution of network power that improved network operation.
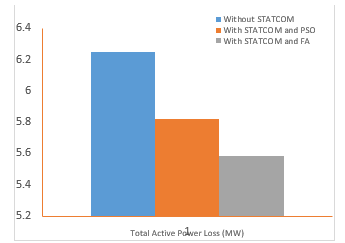
Figure 5: Overall active power losses
The controller offered a different flow path, allowing electricity to flow through less-loaded lines and reducing loss on the original lines as a consequence. The active power flows for the base case, which were 69.9246, 68.7359, 51.8444, 38.2318, 7.5796, 17.2293, 3.6629, and 5.4713 MW for transmission lines 1–5, 2-3, 4, 2, 5, 6, 12, 6, 13, and 14, were modified to 69.8589, 68.7203, 52.1509, 38.5039, 7.5424, 17.1875, and 3.5072 MW. On the other hand, the line flow was improved by 1.40, 1.04, 0.43, 0.08, 0.02, 0.09, 0.20, and 0.03 MW compared to the flow recorded with the PSO technique application.
The system’s overall active power flow is therefore increased by utilizing these algorithms, from 621.5 to 623.4 MW with the PSO-placed STATCOM and to 626.64 MW with the FA-placed STATCOM.
6.3. Reduction of Reactive Power Loss
The findings of the network branch losses for the system under study, before and following STATCOM installation, are shown in Fig. 6. The overall power loss without the device was 14.256 MVAr; nevertheless, when STATCOM’s optimum configuration was attained with PSO, this decreased to 12.59 MVAr. Following appropriate STATCOM integration using FA, this loss was further reduced to 12.16 MVAr. The STATCOM device’s integration with PSO and FA resulted in achievements of 1.62 and 2.10 MVAr, or 11.37 and 14.73%, respectively, in overall reduction. When the two optimization techniques are compared for effectiveness, FA outperforms PSO in minimizing reactive power loss.
As illustrated in Fig. 6, all transmission lines—aside from lines 3–4—were loss-minimized utilizing FA-placed STATCOM. The disparities in reactive loss magnitude for appropriately located STATCOM with PSO and FA show that FA has a loss reduction boost over PSO. The reduction of the system’s overall reactive loss with and without correctly positioned STATCOM is illustrated in Fig. 7.
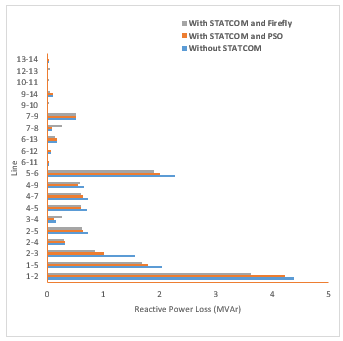
Figure 6: Reduction of reactive loss for all the cases
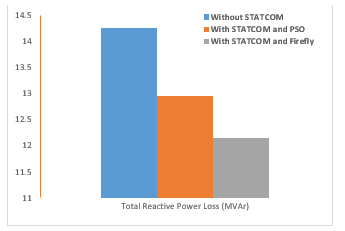
Figure 7: Overall reactive losses
This considerably decreased reactive loss on the network and outperformed the PSO technique. This reduction greatly aided in reducing the bus voltage magnitude deviation, which increased network stability and security. The test system’s active and reactive loss information is shown in Table 2. Columns three and four, respectively, reflect the active and reactive power losses experienced by the network during the base case study. With PSO-placed STATCOM, the active power loss is recorded in column 5, while with FA-placed SATCOM, it is recorded in column 7. Columns six and eight of the table contain their related reactive power losses. As a consequence of the device using these two techniques, there is an overall line-by-line decrease for the active and reactive power.
Table 2: The IEEE 14-Bus Network Line Losses
| Bus Number | Steady State
(Base case) |
STATCOM
(PSO-placed) |
STATCOM
(Firefly-placed) |
||||
| From | To | (MW) | (MVAr) | (MW) | (MVAr) | (MW) | (MVAr) |
| 1
1 2 2 2 3 4 4 4 5 6 6 6 7 7 9 9 10 12 13 |
2
5 3 4 5 4 5 7 9 6 11 12 13 8 9 10 14 11 13 14 |
2.366
1.165 0.942 0.729 0.388 0.221 0.222 0.000 0.000 0.000 0.019 0.029 0.086 0.000 0.000 0.007 0.052 0.004 0.002 0.019 |
4.390
2.049 1.565 0.313 0.736 0.158 0.703 0.731 0.651 1.898 0.041 0.062 0.170 0.087 0.522 0.019 0.111 0.009 0.001 0.039 |
2.346
1.129 0.819 0.726 0.372 0.161 0.200 0.030 0.030 0.030 0.004 0.002 0.065 0.030 0.030 0.024 0.020 0.024 0.027 0.006 |
4.370
1.787 0.947 0.415 0.676 0.247 0.698 0.671 0.601 2.265 0.023 0.038 0.158 0.281 0.530 0.014 0.077 0.016 0.027 0.017 |
2.146
0.982 0.672 0.706 0.352 0.141 0.180 0.050 0.050 0.050 0.024 0.017 0.045 0.050 0.050 0.044 0.005 0.044 0.047 0.026 |
3.628
1.692 0.952 0.395 0.696 0.267 0.678 0.651 0.581 2.245 0.003 0.018 0.138 0.261 0.510 0.034 0.057 0.036 0.047 0.002 |
| Total | 6.251 | 14.256 | 5.819 | 12.954 | 5.681 | 12.891 | |
Comparing with the PSO technique, FA’s efficacy cannot be highlighted enough. With this performance, FA was able to minimize active and reactive power losses as well as voltage fluctuations more effectively, which reduced costs.
For better comprehension, Table 3 shows the entire system power flows and the corresponding total loss projections. Without a STATCOM device, Table 3 shows that the network is capable of handling an apparent power of 653.38 MVA. But with the PSO and FA installed STATCOM controllers, the apparent power increased to 671.9 and 676.1 MVA, respectively. The system loss decreased from 15.57 to 14.20 and 13.81 MVA, respectively, as a result of this rise in total network power, as depicted in Table 3, when the device was strategically placed with PSO and FA, respectively.
Following the utilization of PSO and FA algorithms, the STATCOM allocation resulted in an improvement in overall flow of 2.8 and 3.5%, respectively. Deploying this device and employing the PSO and FA algorithms led to a reduction of the overall network loss of 8.78 and 11.26%, respectively. The stated FA performance in loss reduction and total network flow clearly demonstrates that FA is superior to PSO in the deployment of STATCOM device controllers. Table 3 indicates the differences in STATCOM device capacities.
Reactive power injection is represented by column 5, while STATCOM controller voltages and angles are shown in columns 3 and 4, respectively. Column 2 displays the device location that was selected. Table 4 shows the comparison of the total parameter settings and STATCOM controller location that led to the network performance for FA and PSO that was previously described. The table makes it evident that both algorithms’ shunt reactances fall within the same range. As a consequence, the final device rating—which depends on the controller capacity and potential costs for the two techniques—is rather similar. Due to this, FA outperforms PSO in terms of cost.
Table 3: The IEEE 14-Bus Network Line Losses Network Overall Power Flows and Losses
| Active and Reactive Power Flows | Active and Reactive Power Losses | |||||
| Base Case | PSO-placed STATCOM | FA-placed STATCOM | Base Case | PSO-placed STATCOM | FA-placed STATCOM | |
| Active (MW) | 621.5 | 623.4 | 626.6 | 6.3 | 5.8 | 5.7 |
| Reactive (MVAr) | 201.7 | 250.8 | 253.9 | 14.3 | 12.9 | 12.9 |
| Apparent (MVA) | 653.4 | 671.9 | 676.1 | 15.6 | 14.2 | 14.1 |
Table 4: STATCOM Parameters Settings and Location
| Technique | Location | Voltage Value (p.u) | Angle (deg.) | STATCOM Size (MVAr) |
| FA | 9 | 1.029 | 0.926 | 9.54 |
| PSO | 11 | 1.025 | 3.769 | 8.96 |
7. Conclusion
This study looked into and proved the efficacy of the FA algorithm over the PSO method for placing STATCOM devices optimally. In this research study, the ideal STATCOM controller placement and parameter settings were made with the goals of reducing voltage magnitude variations and active and reactive power losses. The outcomes produced utilizing the IEEE 14-bus network show how appropriate these optimization strategies are. The capacity of the STATCOM controller to produce the best results for the specified objectives served as evidence of the applicability of PSO and FA for the best STATCOM controller position. According to the research, the STATCOM controller’s performance with FA placement is superior to the PSO’s. This means that FA performance in the optimum STATCOM controller configuration outperforms PSO in voltage profile augmentation and loss mitigation situations. Future research may be carried out to compare the effectiveness of the FA with other recently developed metaheuristic optimization algorithms that deliver superior performance at a reduced cost of STATCOM allocations on the power transmission and sub-transmission networks.
Conflict of Interest
The authors declare no conflict of interest.
- E. I. Ogunwole, S. O. Ayanlade, D. E. Owolabi, A. Jimoh, A. B. Jimoh and F. M. Aremu, “Performance Comparative Evaluation of Metaheuristic Optimization Algorithms for Optimal Placement of Flexible Alternating Current Transmission System Device,” in 2022 International Conference on Electrical, Computer and Energy Technologies (ICECET), 2022, 1-8, doi: 10.1109/ICECET55527.2022.9872866.
- B. Behera and K. C. Rout, “Comparative performance analysis of SVC, STATCOM UPFC during three phase symmetrical fault,” Proc. Int. Conf. Inven. Commun. Comput. Technol. ICICCT 2018, 2, 1695–1700, 2018, doi: 10.1109/ICICCT.2018.8473226.
- K. G. Damor, D. M. Patel, V. Agrawal, and H. G. Patel, “Comparison of different FACT devices,” Int. J. Sci. Eng., 1(1), 372–375, 2014, doi: 10.1109/APCC.2016.7581484.
- Jimoh, A., Ayanlade, S. O., Ariyo, F. K. and Jimoh, A. B., “Variations in phase conductor size and spacing on power losses on the Nigerian distribution network. Bulletin of Electrical Engineering and Informatics,” 11(3), 1222 – 1233, 2022, doi: https://doi.org/10.11591/eei.v11i3.3753.
- E. I. Ogunwole, “Optimal placement of statcom controllers with metaheuristic algorithms for network power loss reduction and voltage profile deviation minimization,” M.Tech Dissatation, Kwa Zulu Natal University, 2020.
- B. O. Adewolu and A. K. Saha, “FACTS devices loss consideration in placement approach for available transfer capability enhancement,” Int. J. Eng. Res. Africa, 49, 104–129, 2020, doi: 10.4028/www.scientific.net/JERA.49.104.
- S. O. Ayanlade and O. A. Komolafe, “Distribution system voltage profile improvement based on network structural characteristics,” in OAU Faculty of Technology Conference (OAUTEKConF2019), 2019, 75–80.
- A. K. Rawat et al., “Design of microcontroller based static VAR compensator,” 2015 17th Eur. Conf. Power Electron. Appl. EPE-ECCE Eur. 2015, 4(1), 1–6, 2017, doi: 10.1515/ijeeps-2017-0145.
- A. Gupta and P. R. Sharma, “Optimal placement of FACTS devices for voltage stability using line indicators,” in 2012 IEEE 5th Power India Conf. PICONF 2012, 4–6, 2012, doi: 10.1109/PowerI.2012.6479518.
- S. T. Fadhil and A. M. Vural, “Comparison of dynamic performances of TCSC, STATCOM, SSSC on inter-area oscillations,” in 2018 5th Int. Conf. Electr. Electron. Eng. ICEEE, 138–142, 2018, doi: 10.1109/ICEEE2.2018.8391317.
- Y. Zhang, Y. Zhang, B. Wu, and J. Zhou, “Power injection model of STATCOM with control and operating limit for power flow and voltage stability analysis,” Electr. Power Syst. Res., 76(12), 1003–1010, 2006, doi: 10.1016/j.epsr.2005.12.005.
- D. Karaboga and B. Akay, “A comparative study of artificial bee colony algorithm,” Appl. Math. Comput., 214(1), 108–132, 2009, doi: 10.1016/j.amc.2009.03.090.
- M. Sankaramoorthy and M. Veluchamy, “A hybrid MACO and BFOA algorithm for power loss minimization and total cost reduction in distribution systems,” Turkish J. Electr. Eng. Comput. Sci., 25(1), 337–351, 2017, doi: 10.3906/elk-1410-191.
- A. Elansari, J. Burr, S. Finney, and M. Edrah, “Optimal location for shunt connected reactive power compensation,” in Proc. Univ. Power Eng. Conf., 1–6, 2014, doi: 10.1109/UPEC.2014.6934743.
- M. O. Okelola, S. A. Salimon, O. A. Adegbola, E. I. Ogunwole, S. O. Ayanlade, and B. A. Aderemi, “Optimal siting and sizing of D-STATCOM in distribution system using new voltage stability index and bat algorithm,” 2(2), 2–6, 2021.
- S. Majumdar, A. K. Chakraborty, and P. K. Chattopadhyay, “Active power loss minimization with FACTS devices using SA/PSO techniques,” in 2009 Int. Conf. Power Syst. ICPS ’09, 1–5, 2009, doi: 10.1109/ICPWS.2009.5442726.
- A. A. A. Esmin and G. Lambert-Torres, “Loss power minimization using particle swarm optimization,” in IEEE Int. Conf. Neural Networks – Conf. Proc., 1988–1992, 2006, doi: 10.1109/ijcnn.2006.246945.
- S. O. Ayanlade, E. I. Ogunwole, S. A. Salimon, and S. O. Ezekiel, “Effect of optimal placement of shunt facts devices on transmission network using firefly algorithm for voltage profile improvement and loss minimization,” Advances on Intelligent Informatics and Computing: Health Informatics, Intelligent Systems, Data Science and Smart Computing, 127, 385-396, 2022.
- M. O. Okelola, S. O. Ayanlade, and E. I. Ogunwole, “Particle swarm optimisation for optimal allocation of STATCOM on transmission network,” in Journal of Physics: Conference Series, 2021.
- X. S. Yang and X. He, “Firefly algorithm: recent advances and applications,” Int. J. Swarm Intell., 1(1), 36, 2013, doi: 10.1504/ijsi.2013.055801.
- X. S. Yang, “Firefly algorithms for multimodal optimization,” Lect. Notes Comput. Sci. (including Subser. Lect. Notes Artif. Intell. Lect. Notes Bioinformatics), vol. 5792 LNCS, 169–178, 2009, doi: 10.1007/978-3-642-04944-6_14.
- A. Ritthipakdee, A. Thammano, N. Premasathian, and D. Jitkongchuen, “Firefly mating algorithm for continuous optimization problems,” Comput. Intell. Neurosci., 2017, 2017, doi: 10.1155/2017/8034573.
- F. S. Moustafa, N. M. Badra, and A. Y. Abdelaziz, “Evaluation of the performance of different firefly algorithms to the economic load dispatch problem in electrical power systems,” Int. J. Eng. Sci. Technol., 9(2), 1, 2017, doi: 10.4314/ijest.v9i2.1.
- N. F. Johari, A. M. Zain, N. H. Mustaffa, and A. Udin, “Firefly algorithm for optimization problem,” Appl. Mech. Mater., 421, 512–517, 2013, doi: 10.4028/www.scientific.net/AMM.421.512.
- S. O. Ayanlade, E. I. Ogunwole, A. Jimoh, S. O. Ezekiel, D. E. Owolabi, and A. B. Jimoh, “STATCOM Allocation Using Firefly Algorithm for Loss Minimization and Voltage Profile Enhancement,” in 2022 International Conference on Electrical, Computer, Communications and Mechatronics Engineering (ICECCME), 2022, 1-6, doi: 10.1109/ICECCME55909.2022.9988475.