Conception and Simulation of an Electronic Nose Prototype for Olfactory Acquisition

Adv. Sci. Technol. Eng. Syst. J. 8(1), 101–107 (2023);
 DOI: 10.25046/aj080112
The “Electronic Nose” approach, which is exclusive to gas measurement systems, uses gas sensors as odor detectors. Design faults exist in the existing electronic nose (e-nose) chamber, such as its large volume, difficult construction, etc. In order to obtain measurements in a satisfactory state, we want to create a gas chamber that can provide favorable conditions for the sensor array, taking into account the ideal gas flow morphology and detector placement. To describe and identify the design capable of offering the best performance for a genuine idea, the e-nose chamber was created using ParaVIEW simulation and FreeCAD conception. According to the results, the spherical sensing container with connections from both pipes in a tangential arc style gives the highest performance in terms of turbulence reduction, in that case, we are printing this chamber and put it in a gas flow prototype to see the performance of the quality measurement of the sensors inside it, and the result shows that these sensors have good acquisition responses by testing the homogeneity distribution inside the chamber.
1. Introduction
The human olfactory system, which consists of the region from the olfactory epithelium to the olfactory brain, is a sensory system for the detection of odor molecules. Olfaction is the term for the sensory function of smell that allows humans to detect and identify a wide range of odorants. Odorants enter the mucus-covered olfactory epithelium in the nasal cavity, bind to the olfactory receptors present in the cilia of the olfactory sensory neurons, and then send odorant information to the brain [1].
Odorants are volatile, hydrophobic compounds that have molecular weights of less than 300 Daltons. The largest known odorant to date is labdane that has a molecular weight of 296 [2].
The sense of smell is a very sensitive organ that can detect even the smallest amounts of substances. It is estimated that only 2 % of the volatile compounds available in a single sniff will reach the olfactory receptors, and as few as 40 molecules of some mercaptans are sufficient to perceive an odor [3].
Instead than being caused by a single chemical, most odors are created by combining hundreds of different odorants. Perceptual fusion results from the tendency of individual components to harmonize or blend together in mixes. The maximum number of components that humans can detect in a combination of odors is three to four [3].
A system that addresses the demand for increasing production or quality control against adulterations is crucial in the fields of food and agricultural product quality control [4]. The most crucial component of the overall e-nose system is the sensor array, which responds differently to different gas molecules [5]. The detecting system of an e-nose is composed of a sensing element, chamber, and sensor array. In order to maximize interaction between the sensor array and volatile substances, the sensing chamber can be a dynamic closed-loop area. The sensing chamber may also be a static area that prevents gas leaks during the detecting stage, which might have a negative impact on the interpretation of the data [6].
One of the biggest issues with an e-detection nose’s stage efficiency is poor sensor response to volatile chemicals. One of the most frequent issues related to subpar sensor response signal performance is also thought to be the longer time it takes for sensors to attain steady state.
The size and shape of the detecting chamber, together with the placement of the intake and outflow gases, are all factors that might significantly affect the performance of the sensor’s response. The gas flow and concentration in the detecting chamber are impacted by these variables.
2. Technology for an e-nose system
An e-nose system is a device with a sensor array that is intended to distinguish between and identify complex scents. Three primary components make up e-nose instruments: a sample handling system, a detection system or sensor array, and data processing models, including categorization and prediction models. The sensor array consists of general-purpose sensors, often metal oxides, that have undergone various chemical treatments. When the volatile molecules are exposed to the sensor array, a particular smell print (or fingerprint) is instantaneously produced from them. To build the database and train a new pattern recognition system that is used to categorize and identify novel scents, patterns or fingerprints from known odors are employed [7].
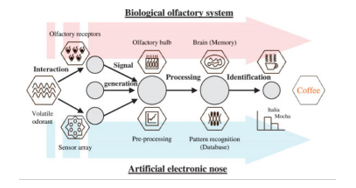
Figure 1: Basic diagram showing the analogy between biological and artificial noses [8].
Electronic nose is a quick and powerful approach that does not require any specific sample preparation and can determine a product’s whole volatile profile. Devices called e-noses are composed of several sensors and may mimic the sense of smell.
As shown by the similarity between biological and artificial noses in Fig.1, e-nose is designed as a match-model for the natural nose and includes the many phases between a volatile odorant and its detection, namely: interaction, signal generation, processing, and identification. A sensor array, electrical interface circuitry, and a pattern-recognition device that serves as a signal processing system are all included in the system. However, a more straightforward model based on a collection of sensors, signal amplification through pre-processing [9], and a pattern recognition system aids in better understanding and illustrating how the nose works [8]. Pattern recognition methods include all statistical and neural techniques for the classification and recognition of odors.
Machine learning is used in the electronic nose. The core concept is that the measurement system learns from training measurements to achieve the desired goal rather than the scientist or application engineer adapting the measurement system to a specific measurement activity [6].
2.1. Measurement conditions stability
The electronic nose’s seeming simplicity has made processing samples and delivering sample gas easier. Furthermore, despite the fact that many electronic nose scientists have academic backgrounds in mathematics or electronics, they lack knowledge of chemical-analytical concerns. The same is true for the measurement systems. Data from a basic electronic nose measuring system, such as one that merely consists of a few gas sensors in a straightforward chamber, will be noisy and have a high degree of measurement uncertainty [6].
Therefore, the only means of achieving stability are controlled sampling methods and the transfer of volatiles to the measurement apparatus. The electronic nose must also be as technologically advanced as is feasible to block sources of noise and outside impacts.
2.2. Detection measurement
The three main parts of an electronic nose are a detecting system sample, a processing system, and a calculation system. The sample handling technique enables the generation of a sample’s headspace (volatile chemical smells [6]). The detecting component of the electronic nose is then injected with this headspace. The sample handling method is essential for ensuring constant operational conditions [10].
Our aim study is based on the detection system sample, because firstly before entering to the processing and computing phases we should make a good measurement from the sensor array in e-nose system by using the procedure below [4] (Figure 2):
- To suppress any strange gases in the cell, first of all to do is injecting the gas vector (oxygen, nitrogen, or air) into the chamber, which is controlled by opening the upper electrical valve (the strange gases are considered as noise in the measurement).
- When to confirm that the chamber is cleaned, then flowing the gas vector into the sample to through the chamber sensor array by opening the downer electro-valve and closing the first one.
- Recording the data from any acquisition electronic board and plotted to see the measurement of the sensor array.
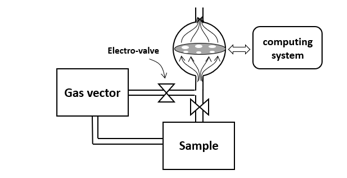
Figure 2: Procedure sensing of an e-nose system [4].
3. Prototype system design
In order to make sure that gas sensors offer reliable readings, we look at the process design of the sensing chamber and the notion of hydrodynamic and fluid flow in this section [11]. We will assess the form, taking into account the sizes depend on the number of sensors employed, and temperature and humidity impact.
3.1. Specification
Two fluid systems types are, static and dynamic systems. According to their names, static systems are those in which the fluid is at rest and dynamic systems are those in which the fluid is in motion. [12].
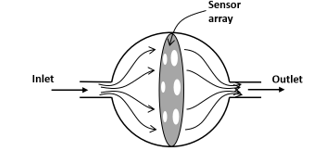
Figure 3: Sensor array inside the gas chamber of e-nose [4].
A dynamic system maintains gas concentrations that are utilized for processing. As seen in Figure 3, the chamber’s design should allow for a more effective dispersion of the gas introduced within. To do this, a variety of sensors with the ability to simulate fragrance must be used [13].
3.2. Chamber design
With a single inlet and outflow, the chamber was meant to resemble a spherical chamber (Figure 3). This shape may be compared to another in which the detecting system performed poorly because the stationary zone was big, for instance because the rectangular shape’s borders trapped the gas (Figure 4). As a result, the chamber’s sensitivity to compost emissions was poor, and its signal-to-noise ratio was less stable [5].
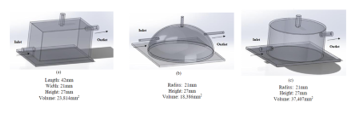
Figure 4: Shapes and volumes of the (a) rectangular, (b) hemisphere and (c) cylindrical sensing chambers [5].
In [5], the author concluded from a comparison of various chambers that the hemisphere chamber, shown in Figure 4, which they used to assess the sensor’s time response and stagnant region, had the best performance. For each sensor chamber and the alcohol content, the average of three readings was obtained in 100 seconds [5]. When there was just clean air in the sensing chambers at first, the alcohol content remained consistent for all of them. The three sensing chambers show a rapid rise in alcohol concentration level with passing time, however the rectangle chamber responds more slowly than the hemisphere and cylindrical chambers when they inject the alcohol gas detected by the gas sensor (MQ-3) inside the sensing chambers [5].
However, the author study [5] encouraged us to specify the e-nose geometrically as a spherical shape, which we base on the temporal response and additional measuring benefits, as illustrated in Figure 5.
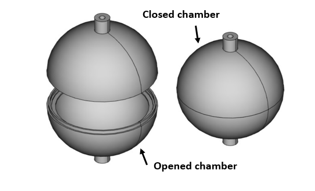
Figure 5: Spherical chamber opened and closed[4].
3.3. Sensor array arrangement
Odors of interest in practical applications are typically complicated mixes rather than pure gases. A fruit’s aroma, for instance, is a sophisticated fusion of dozens of distinct odors. Finding sensors for each individual component of the gas mixture is very hard due to its complexity [14].
In the literature we found that, six to seven gas sensors are employed in the nasal sensor array [15]-[16]-[17], some researchers supporting them to eleven or more [18]-[19]. In our case, six sensors used for the measurement, which are useful to describing the odor of the sample. To be more practical, addition of temperature and humidity sensors is advised. (DHT11), which are important in the measurement and signal processing [4].
Our sensor array should be built on a PCB circle shaped that fits our spherical chamber. The hexagonal dispersion geometry makes a symmetrical form of these sensors as seen in Figure 6.
Temperature has an impact on other aspects of thermal comfort and indoor air quality [20]. The temperature in the occupied space ought to stay constant. On the other side, high humidity can promote the development and proliferation of molds and bacteria that can spread via the air. Controlling quality is a difficulty in this situation. On the other hand, relative humidity has a big role in thermal comfort. The optimum range for the relative humidity of indoor air, as per international norms and regulations, is between 30 and 60% [21].
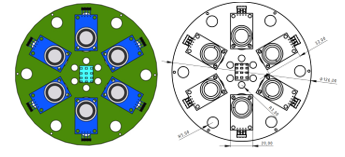
Figure 6: Sensor array network distribution in hexagonal form, as well as temperature and humidity sensors.
3.4. Flow rate
The time needed to reach a uniform condition and the chamber’s capacity were two of the many variables used to evaluate the sensor’s response signal performance. As shown in Figure 7, the design of a spherical chamber performed well since the stationary zone was minimal and the chamber was less intricately constructed.
The continuity equation, a fundamental principle of fluid mechanics [11], asserts that the volume flow is constant and that the quantity of any incompressible amount of fluid entering and departing are equal, The measurement item and the chamber volume determine the flow rate. Figure 7 depicts the geometry of the cell.
The calculation of velocity and flow rate, provide us to know the volume of chamber designed by applied some formulas.
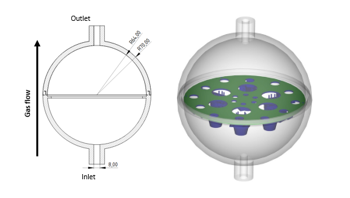
Figure 7: Dimension of the e-nose shape (mm unit).
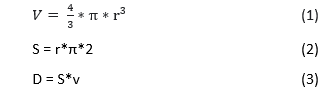
where:
V = Volume of the chamber
S = Section of the tube
D = Debit (flow rate)
v = velocity
r = Radius
For the velocity, our object is to make a symmetrical concentration of the gas inside the sensing chamber in a good time, fixed about 180 seconds [16], and the inlet and outlet pipe section is 50.27 mm2 by (2), the volume of the sensing chamber using (1) is 1098 cm3, and velocity equal to 3.98 cm/s. With these parameters we can calculate the optimum flow rate 2 cm3/s using (3).
3.5. Architectural prototype system for sensing chamber test
The prototype’s main objective is to control the quality of agricultural products by using smell (gas sensor matrix) through the first step to ensure the reliability of the information as much as possible. Performed by a procedure, elaborated in the next section, well determined at the fluidic level, to acquire the necessary data for the processing system.
In general, the experiment takes place in a well-defined time (according to the response of the gas sensor), at first the odorant is putted in the sample door, and we wait for any moment that the smell is concentrated before the flow. Then any smell is released inside the gas cell with the air by the action of opening the solenoid valve at the top V1 plus the start of the pump until the stabilization of the sensors as shown in Figure 8. The next step is to open the solenoid valve at the bottom V2 and close the solenoid valve at the top V1, so that the smell of the sample flows to the gas cell, which causes a measurement exchange at the sensor level.
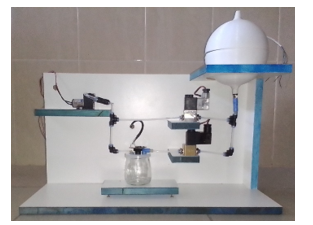
Figure 8: Prototype system conception.
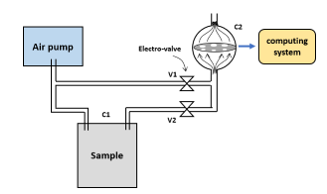
Figure 9: Synoptic diagram.
4. Results and discussions
4.1. Chamber simulation
Working on FreeCAD software using the workbench CfdOF with OpenFOAM tool to simulate the sensing chamber by setting some parameters as, ambient temperature, boundary conditions, iterations, the temperature, density and flow rate. And importing the mesh result to ParaVIEW software. According to Figure 9, we visualize the streamline movement.
In fact, energy is wasted at the level of gas movement (turbulence) [11], resulting in difficult cleaning and an imbalance in the gas concentration in the cell linked to the measuring sensors. This is just one final thought on the simulation. The cause of this effect is the connection between tube and the spherical form is 90-degree.
As a result, we have created a new modification that uses a tangential arc to eliminate the corner on both sides (Figure 11). We maintain the same settings and setup as in Figure 10, the distribution of the airflow in Figure 11 is generally uniform and devoid of turbulence. In comparison to Figure 10, both corners, which are challenging to clean, are replaced by a tangential arc, which is simple to clean. Additionally, the air pressure inside the sensor array is raised, which is good for the way the sensors and the gas under measurement interact.
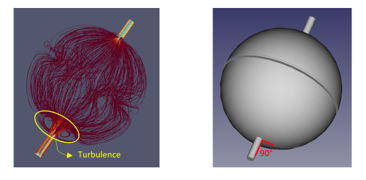
Figure 10: outcomes of fluid characteristic simulation (including the sensor array inside the chamber).
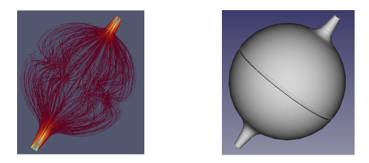
Figure 11: Simulation outcomes with the same flow rate and changed shape as in Figure 9.
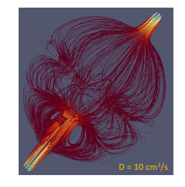
Figure 12: Simulation outcomes at 10cm3/s flow rate.
Figure 12, which keeps the same setup as Figure 11 but changes the flow rate parameter to 10cm3/s, displays the simulation results. As depicted in Figure 10, we may draw the conclusion that the system is constrained in terms of specific parameters, such as flow rate, and that it cannot be utilized for sensing measurements since the response will be non-confidential when employed (there will be a lot of turbulence). The values used for Figure 11 therefore provide the highest geometrical performance.
4.2. Experience description
According to a huge number of tests carried out at the validation of built system dedicated to the quality control of agricultural products. This part results from tests done in order to come out with a significant percentage of system validation regarding data acquisition.
Sample: to ensure that the system works well (Figure 8) and with the lack of some sensor on the market, we worked with the most available sensors such as the MQ2 and MQ5 sensors, which are used for smoke detection and flammable gauges (for example butane), in this case our sample will be a lighter that can be contained in the cell, with a mechanical action so as to pull out the gas towards the outside.
Technical part: The sensor array consists of Six MOS chemiresistive type sensors (GS1, GS2, GS3, GS4, GS5 and GS6) capable of detecting various odors. To test the homogeneity of the chamber, the sensor array integrated with an Arduino UNO microcontroller having an on-chip analog to digital converter was used for data acquisition and plot it in the screen, two electro-valves are used for starting or stopping the gas flow coming from the pump.
A chemiresistive sensor or gas detector, principle of functionality in it [22], look like a resistor vary with different gases.
4.3. Testing the sensors responses inside the chamber
We aim to test the response of these sensors (MQ2 and MQ5), based on the above procedure of the experiment, as shown in the Figure 13.

Figure 13: Procedure of the experiment.
The first 20 seconds are considered an initialization step for the sensors by airflow. Then we observe that there is a significant growth detected. This deduces that a new gas was captured. Finally, we return to the initial state performed another time by the injection of air, which will create a well on a signal decrease (the gas cell fills with air) slowly.
With this much-delayed decrease, we gave it a helping hand at time 178 s by manually opening the sensor chamber to release the butane gas in a faster way.
The sensor response is illustrated in the figure below:
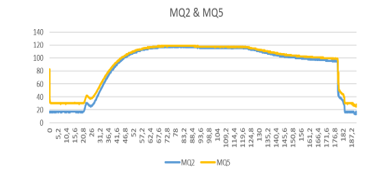
Figure 14: response of the butane gas flow from the sample cell to the measuring cell (C1 to C2 see Figure 9) observed by the sensors MQ2 and MQ5.
We can see the reaction of these sensors with butane gas, which we have an increasing after 20 seconds of butane flowing as shown in Figure 13, the amplitude gone from 20 as minimal to 120 analog values, and decreasing when we inject the air flow, with these responses we can see that the two sensors inside the chamber are functional, for reason to make sure that the system is working.
4.4. Homogeneity test in the gas chamber
To evaluate the homogeneity of the gas sensor cell, the sensors must have almost the same answer, for this, the idea is that we will follow it is to work with only one sensor of type MQ2 at a time.
Since the electronic board supports 6 gas sensor locations, this involves 6 tests for each position, because only one measurement sensor was used. The following figure shows the procedure of the experiment:
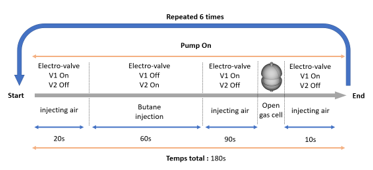
Figure 15: Homogeneity experiment procedure.
We respect as much as possible all the details of the experiment with the same condition as possible, the result is shown in the following figure.
By respecting the same conditions at each turn of the experiment, namely the concentration of gas in the sample cell in C1, the opening and closing of the solenoid valves and the practical operation of the MQ2 sensor.
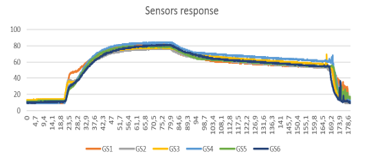
Figure 16: Homogeneity test response on the 6 sensor positions in C2 cell.
From these measurements it is found that they are almost homogeneous with some small deference either at the beginning of the transitional regime and the end of the measurement, the first is due to the fact that the concentration of gas mixture (air + butane) are not the same when it touches the sensor membrane (the sensitive part of the sensor against the gauze) for the 6 different positions on the electronic board, for the second is generated by the opening of the chamber causes a vibration of the sensor giving an observable disturbance at the measurement level.
But in general, these answers present a quality of measurement in the permanent diet that is most important in the data processing phase.
5. Conclusion and future work
For several uses in machine learning, including quality control, the e-nose system was an essential tool. The sensor chamber is crucial in the detection phase of any electronic nasal application. This investigation’s analytical, which mainly focused on geometrical restrictions of e-nose design, discovered that, the spherical shape shows the highest geometrical performance for the debit due to several factors including volume and shape.
On the one hand, this practical work is an image that must respond to the simulation of the gas cell on the homogeneity of data capture according to the sensors. In the same way, we found a compatibility relationship between them, since the 6 sensors positions have an important reliability of the information, which gives the next step towards the processing and the pattern recognition phases.
- H. J. Ko and T. H. Park, “Bioelectronic nose and its application to smell visualization,” J. Biol. Eng., 10(1), 17, Dec. 2016, doi: 10.1186/s13036-016-0041-4.
- G. Ohloff., “Chemistry of odor stimuli.Experientia,” 42, 271-279., 1986.
- S. S. Schiffman and T. C. Pearce, “Introduction to Olfaction: Perception, Anatomy, Physiology, and Molecular Biology,” in Handbook of Machine Olfaction, T. C. Pearce, S. S. Schiffman, H. T. Nagle, and J. W. Gardner, Eds. Weinheim, FRG: Wiley-VCH Verlag GmbH & Co. KGaA, 2002, 1–31. doi: 10.1002/3527601597.ch1.
- M. Harmouzi, A. Amari, and L. Masmoudi, “The conception of gas chamber for electronic nose,” in 2022 2nd International Conference on Innovative Research in Applied Science, Engineering and Technology (IRASET), Meknes, Morocco, Mar. 2022, 1–4. doi: 10.1109/IRASET52964.2022.9737802.
- N. S. Samiyan and M. M. Addi, “Characterization of Sensing Chamber Design for E-Nose Applications,” J. Telecommun. Electron. Comput. Eng. JTEC, 9, 3–9, Art. no. 3–9, Dec. 2017.
- P. Boeker, “On ‘Electronic Nose’ methodology,” Sens. Actuators B Chem., vol. 204, pp. 2–17, Dec. 2014, doi: 10.1016/j.snb.2014.07.087.
- S. Kiani, S. Minaei, and M. Ghasemi-Varnamkhasti, “Instrumental approaches and innovative systems for saffron quality assessment,” J. Food Eng., 216, 1–10, Jan. 2018, doi: 10.1016/j.jfoodeng.2017.06.022.
- E. L. Hines, P. Boilot, J. W. Gardner, and M. A. Gongora, “Pattern Analysis for Electronic Noses,” in Handbook of Machine Olfaction, T. C. Pearce, S. S. Schiffman, H. T. Nagle, and J. W. Gardner, Eds. Weinheim, FRG: Wiley-VCH Verlag GmbH & Co. KGaA, 2002, 133–160. doi: 10.1002/3527601597.ch6.
- R. Gutierrez-Osuna, H. T. Nagle, B. Kermani, and S. S. Schiffman, “Signal Conditioning and Preprocessing,” in Handbook of Machine Olfaction, T. C. Pearce, S. S. Schiffman, H. T. Nagle, and J. W. Gardner, Eds. Weinheim, FRG: Wiley-VCH Verlag GmbH & Co. KGaA, 2002, 105–132. doi: 10.1002/3527601597.ch5.
- A. Koocheki and E. Milani, “Saffron adulteration,” in Saffron, Elsevier, 2020, pp. 321–334. doi: 10.1016/B978-0-12-818638-1.00020-4.
- J. Roussel, “Cours de mécanique des fluides – femto-physique.fr,” p. 68.
- “Understanding Pressure Measurement.” https://www.meddeviceonline.com/doc/understanding-pressure-measurement-0001 (accessed Oct. 19, 2021).
- S.-M. Jafari, M. Z. Tsimidou, H. Rajabi, and A. Kyriakoudi, “Bioactive ingredients of saffron: extraction, analysis, applications,” in Saffron, Elsevier, 2020, pp. 261–290. doi: 10.1016/B978-0-12-818638-1.00016-2.
- K.-T. Tang, S.-W. Chiu, C.-H. Pan, H.-Y. Hsieh, Y.-S. Liang, and S.-C. Liu, “Development of a Portable Electronic Nose System for the Detection and Classification of Fruity Odors,” Sensors, 10(10), 9179–9193, Oct. 2010, doi: 10.3390/s101009179.
- S. Kiani, S. Minaei, and M. Ghasemi-Varnamkhasti, “Integration of computer vision and electronic nose as non-destructive systems for saffron adulteration detection,” Comput. Electron. Agric., 141, 46–53, Sep. 2017, doi: 10.1016/j.compag.2017.06.018.
- M. Ezhilan, N. Nesakumar, K. J. Babu, C. S. Srinandan, and J. B. B. Rayappan, “Freshness Assessment of Broccoli using Electronic Nose,” Measurement, 145, 735–743, Oct. 2019, doi: 10.1016/j.measurement.2019.06.005.
- K. Heidarbeigi, S. S. Mohtasebi, A. Foroughirad, M. Ghasemi-Varnamkhasti, S. Rafiee, and K. Rezaei, “Detection of Adulteration in Saffron Samples Using Electronic Nose,” Int. J. Food Prop., 18(7), 1391–1401, Jul. 2015, doi: 10.1080/10942912.2014.915850.
- P. Le Maout., “Polyaniline nanocomposites based sensor array for breath ammonia analysis. Portable e-nose approach to non-invasive diagnosis of chronic kidney disease,” Sens. Actuators B Chem., vol. 274, pp. 616–626, Nov. 2018, doi: 10.1016/j.snb.2018.07.178.
- L. Kumari, “Various techniques useful for determination of adulterants in valuable saffron: A review”, 3 March 2021, doi: https://doi.org/10.1016/j.tifs.2021.02.061
- T. Hübert, “Chapter 12 – Electronic Noses for the Quality Control of Spices,” 115–124, 2016, doi: https://doi.org/10.1016/B978-0-12-800243-8.00012-3.
- M. S. Hallé, M. L. Dufresne, and M. L. Lamarche, “ MODÉLISATION DE LA QUALITÉ DE L’AIR DANS UNE UNITÉ DE BRONCHOSCOPIE : INFLUENCE DES STRATÉGIES DE VENTILATION,” 132.
- M. A. Franco, P. P. Conti, R. S. Andre, and D. S. Correa, “A review on chemiresistive ZnO gas sensors,” Sens. Actuators Rep., 4, 100100, Nov. 2022, doi: 10.1016/j.snr.2022.100100.