
Integrated GIS-SUE Map Cost Estimation System Prototype for Designing a Decision Support System
Volume 8, Issue 1, Page No 95-100, 2023
Author’s Name: Ali Nashwana), Khalil Al-Joburi
View Affiliations
Civil Engineering, University of Bahrain, Sanad, 00745, Bahrain
a)whom correspondence should be addressed. E-mail: alinashwan@gmail.com
Adv. Sci. Technol. Eng. Syst. J. 8(1), 95-100 (2023); ![]() DOI: 10.25046/aj080111
DOI: 10.25046/aj080111
Keywords: GIS, SUE, Smart cities, UML, Utilities

Export Citations
Subsurface Utility Engineering (SUE) is an international model for mapping and classifying underground surfaces according to their accuracy (acquisition method). Utilizing Geographic Information System (GIS) to map and present the SUE levels paved the way for producing a new Decision Support System (DSS) for the utility mapping process. The proposed system represents an efficient tool for managing, operating and maintaining utilities. This Article aims to design a prototype in Unified Modeling Language (UML) of a new DSS system to operate SUE maps using digital spatial maps (GIS-compatible). Although SUE and GIS are not new technologies, integrating them is. The result is a prototype that makes utility management and maintenance cost estimation more efficient. This prototype facilitates and automates the cost estimation of exposing, maintaining, or locating subsurface objects, such as utilities. In addition, it may apply to Municipal Solid Waste (MSW) and void mapping.
Received: 29 August 2022, Accepted: 07 January 2023, Published Online: 07 February 2023
1. Introduction
This paper is an extension of work originally presented at the 2021 International Conference on Innovation and Intelligence for Informatics, Computing, and Technologies (3ICT) [1].
Planning is a basic management function involving formulating one or more detailed plans to achieve an optimum balance of needs or demands with available resources (Source: https://www.dictionary.com ). The cost is the most vital function to consider during the planning process. On the other hand, the cost usually changes from one location to another. Thus, spatial analysis is considered one of the best cost estimation and selection tools. This geospatial technique is called Location Based Service (LBS). LBS accuracy depends on the mapping accuracy of spatial features. Therefore, accurate LBS produces accurate cost estimation.
Spatial analysis is one of the main functions of GIS. However, its power and efficiency are inherently in the ability to combine spatial with non-spatial data called “Attributes”. Figure 1 shows an example of a GIS map with an attribute table (Geodatabase).
The GIS in utility discussed in Article [1] started by illustrating the Facility Mapping systems (FM). These systems enhance the construction, maintenance, and operation of utilities. FM system mainly represented the utility features as vector (point, line, or polygon) rather than raster data (pixels). This is because vector data has better accuracy than raster and is easy to calculate.
Increasing mapping accuracy of the existing subsurface utility minimizes the potential risk of damaging them. This objective is significant for the majority of subsurface mapping researchers. Therefore, SUE was designed to control and document underground utilities’ mapping accuracy. In addition, SUE has several other benefits illustrated by Nashwan and Al-Joburi [1].
SUE classifies the mapping features based on source accuracy (Data capturing). The classification is usually divided into four categories (Levels of Quality). These categories are class D: the location was determined based on historical data (digitizing old drawings or asking experts). Class C indicates that a topographical survey was used to locate the existing surface manholes and utility markers. Class B means that a geophysical surveying method was conducted to locate the utility, such as Ground Penetrating Radar (GPR), Electricity Pipe and Cable Locator (EPL), and other techniques. Finally, Class A refers to a non-destructive drilling technique (using water or air jetting devices) or hand-work trial holes implemented to identify the locations. The reliability of these classes was set to 25, 50, 75, and 100% for the classes D, C, B, and A, respectively [2]. Figure 2 shows a typical SUE map with the level of accuracy (confidence) and depth for each feature written over it.
These levels from A to D are inversely proportional to cost and directly proportional to risk, as shown in Figure 3.
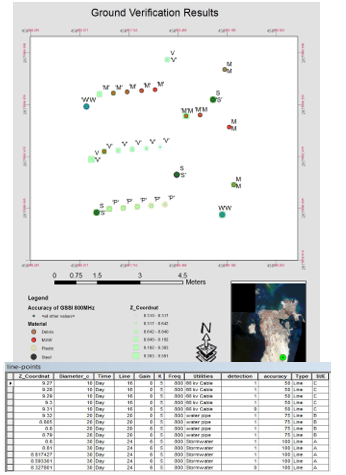
Figure 1 Sample of GIS map with attribute data
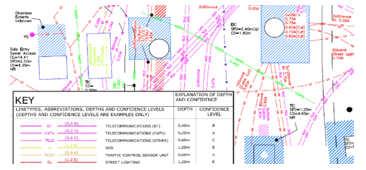
Figure 2 Typical SUE Map
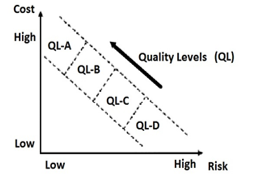
Figure 3: SUE Quality levels
Article [1] discusses integrating GIS with SUE. Also, the Article provided a prototype for this integration (How to convert the SUE map into the FM system and how to add the SUE classes to the FM system).
The future work for the mentioned Article was to design a DSS that helps the FM system user estimate the cost and time for mapping subsurface utilities. Therefore, this research extends this work to produce the mentioned DSS. In addition, this Article and [1] represent an enhancement of the results obtained by the original research in subsurface mapping [3].
Several works of literature define and illustrate the SUE and GIS in more detail, such as the articles [4,5], and [6], which represent good references that discuss SUE’s benefits and history. These articles showed that the SUE has begun enhancing utility mapping certainty in roads and highway projects. They also show that the benefit of investment in SUE is enhanced and increases with time.
On the other hand, the articles [7,8], and [9] discuss the FM and the importance of GIS and FM in managing utilities and other subsurface features. In addition, these articles show that FM represents an office automation system that starts from converting the utility maps from CAD to GIS layers and includes utility planning, designing, operating, maintenance, and construction.
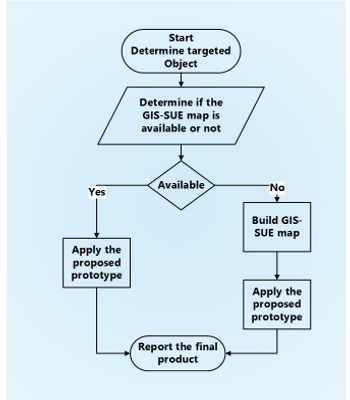
Figure 4 Methodology
2. Methodology
This research aims to design a prototype for a DSS that enhances the cost and time estimation for subsurface feature mappings, such as utility construction and utility data acquisition. The proposed system is designed based on the prototype for integrating GIS data and SUE maps.
The methodology of this research flowchart is shown in Figure 4, started by defining the targeted object to be investigated. The targeted objects in this research are utilities, voids, and MSW because the original researches [1] and [3] were designed to study these objects. Even though the outcome prototype can be applied to investigate any subsurface features, the system was built based on the outcome of the integration and conversion between SUE and GIS layers. Therefore, the availability of a GIS-SUE map might be defined to delineate the scenario that the software (system) will follow (either to build a new GIS-SUE map or to work on an existing one). Thus, this research focuses on putting the designed prototype into a system that determines how much it costs to locate the intended feature and to gauge its cost and time.
This Article presents the significance of utilizing SUE in the proposed DSS. Then, briefly discusses the designed prototype. Lastly, it discusses the results and output of this research.
3. SUE in a Decision Support System
The benefit of SUE levels could save the cost of data acquisition, depending on data acquisition objectives. For example, there is no need to pay a significant amount to gather data using topographical or geophysical surveying; when the map is for planning purposes, historical data is enough. Also, it assists the project manager in determining the requirements for the project. For example, if the map is for construction purposes, the area of potential risks requires level A (precise location) data, such as junctions, to avoid hazards and injuries.
The previous examples are used to establish a DSS to help the designer and the project manager determine the cost and risk of utilizing the feature’s locations in further procedures, such as excavation and construction. However, the proposed DSS depends on the pre-requisite information provided by the user. This information helps the system define the likelihood, track and calculate the costs. The requirements are:
1- The objective of the requested mapping is to delineate the required level of SUE.
2- SUE level for the existing feature, if any.
3- The unit price for locating the service includes the exposing method, the depth, length, size, action required (protect, relocate, or do nothing), and any other information that affects the total utility cost.
4- The time required to implement the action in the previous step.
The proposed system will delineate the cost of the required operation near the utility feature with a range of certainty that depends on the level of SUE of the original data. In addition, the system estimates the cost of changing the level of SUE data to increase the reliability of the data, which must be done later in the construction phase.
The proposed prototype shown in Figure 5 is designed for utility. However, it could be implemented and updated for other targets’ inspections, such as MSW and voids, where the requirements differ. For example, the inspection cost might be included if this DSS is used in MSW mapping. However, contrariwise, the utility’s locations are usually known with confidence (the inspection and the SUE ensure these locations) voids and MSW locations are usually unknown. Thus, the inspection is done to locate or minimize the suspected areas. Then additional inspections or excavations are done to locate it. In addition, the location of utilities is required to maintain and protect them, while the MSW and voids location must be determined to remove or treat these features. Therefore, it is recommended to start with the inspection cost, locate the features, and remove them to avoid collapse and cracks that could deteriorate the surface structure, like the collapse due to a void or the cracks due to MSW under the building foundation.
The following example is to clarify how the cost and time estimation of locating the objected features (utility, voids or MSW) will be calculated in the system:
The pre-requisite items for the system are the GIS-SUE map for the area of interest for objected features. In addition, metadata (extra data) contains the amount of cost and time for locating each type of SUE level (C, B, or A), which is called a Bill of Quantity (BOQ). (Such as the cost of using the topographical survey to locate the service in level C, using the geophysical survey to locate it in level B, or exposing the location (trial hole or non-destructive digging) to obtain level A location.
The objective in the example is to find the cost and time for locating an object (water pipe) during the construction phase (which means locating the pipe in level A). If the existing level is C, then the location needs to be inspected using the geophysical method (GPR in this case) (to get level B type) and to do some trial holes for verification (for level A). Using the BOQ, the cost and time of both types could be calculated inside the system and added as an attribute on the feature or in a separate report.
4. Implementation
The system started by gathering the required information from the user, which was mentioned previously. This information started by determining the required SUE level for the targeted feature (as mentioned in the introduction. In addition, the system might determine the expected area to be investigated using the original GIS or CAD map. Then using the price, time, and quantity database, the cost will be determined. Lastly, the output of the DSS will be a GIS layer and a report in an MS Excel sheet.
The prototype shown in Figure 5 is working as follows:
| Result: Determining the cost and time required to implement a specific process in the project. | |||||
|
Initialization; Gather the project data from the user (existing SUE-levels, Unit price for time and cost for each item, and data mapping method). Refine the collected information for the decision analysis process. Implementing: the following algorithm is used to determine if the SUE level is suitable for the project’s objective and to determine the required cost and time for it (how the system will work). The example for this algorithm is the calculation of the cost and time for the construction phase: |
|||||
| While data is not sufficient to calculate the cost & time, do | |||||
|
Apply the sub-prototype in Figure 6; Save the cost and time in a database; The following verifying process is used to check objective With SUE level (data accuracy) using the sub-prototype: |
|||||
| If Data accuracy is not at level A, then | |||||
|
Calculate the time and cost for the required action (exposing, inspection, relocating); |
|||||
| else | |||||
| Do nothing, | |||||
|
end The accuracy is enough for the objective, and it up to 100% for level A, end sub-prototype |
|||||
|
End Convert the results into a shapefile.
The outputs are a GIS map where the user can start the activity, he/she wants (such as construction) and the area that still has risk (an area that is lower than level A); |
|||||
5. Results and Discussions
The proposed solution in this research was a prototype designed in UML high-level format. The complete programming project required a budget, further details, and available software. This prototype can be programmed and implemented partially using MATLAB code or any other programming language.
Although the main utilization of the proposed DSS might be in a subsurface utility map, it could be used to map any subsurface feature, such as MSW and voids. This opens the way to expand the DSS to be adopted in infrastructure applications for subsurface mapping purposes.
The SUE was considered a valuable tool in the damage-preventing process. Also, it helps in reducing utility relocating, project delays, and compensations. Besides, facilitates utility maintenance and several other benefits. Although the main item in the mentioned literature was the utilities, this Article investigates other inspections, locating and removing other potential risks such as MSW and voids after considering some changes in the DSS. Therefore, the primary investigation was designed in the original project mentioned in [3] to detect these features instead of utilities.
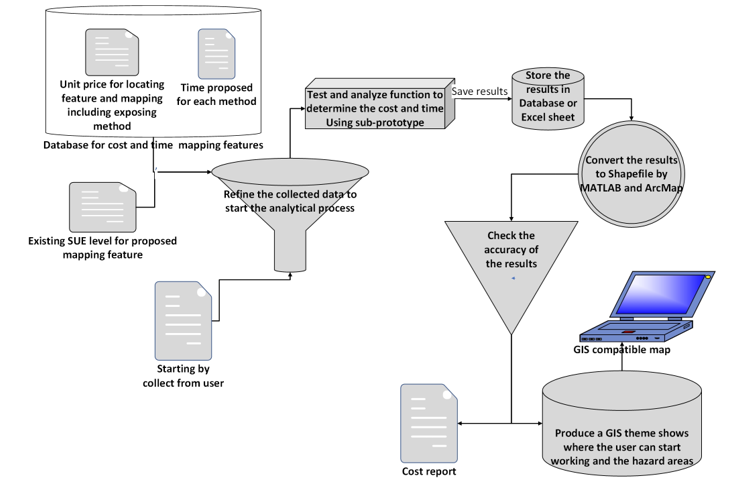
Figure 5 Proposed General DSS prototype for cost and estimation
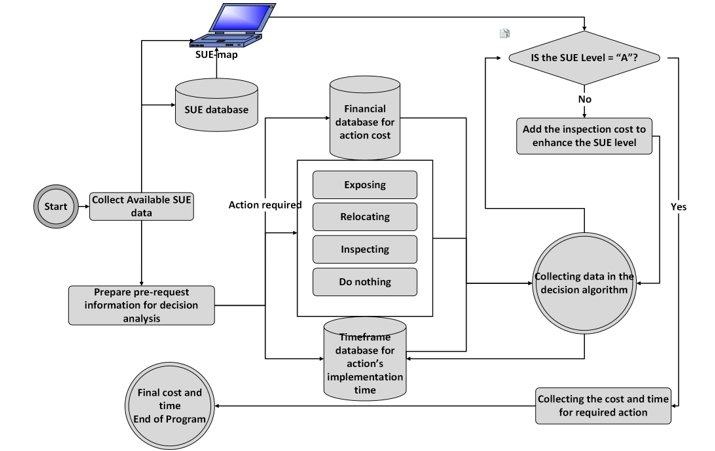
Figure 6 Sub-Prototype for DSS cost analysis in construction phase
The significance of accurately locating the other subsurface feature is to prevent the potential structural damage of these features, such as cracks and collapse due to voids. These locations are essential for structural design and affect the final cost of the construction project, such as exposing and treating these features or negating their effect with other structural solutions like reinforcement concrete mixes. On the other hand, the maintenance engineer might utilize the SUE map to delineate the expected time and cost to repair the utility faults. Therefore, he/she can decide which is feasible to expose the old utility or cancel it and lay a new one. In addition, the planner and structural engineers might change the proposed design to avoid underground MSW or voids or to add the cost of exposing and removing it before construction. Thus, the proposed prototype illustrated previously for a decision support system using an integrated GIS-SUE map was designed to solve this issue.
The results of the proposed DSS prototype are a GIS map beside a report
6. Conclusions
This Article presented a prototype to design and implement a DSS for determining the cost and time required to do a specific action on a utility network segment or locate subsurface hazardous material. This prototype was designed to analyse input data, such as the unit cost for each type of action with the targeted feature. The prototype compares the objectives to the available confidence level (SUE). The output is a GIS-compatible map and a report outlining the cost and time needed to upgrade the SUE certainty
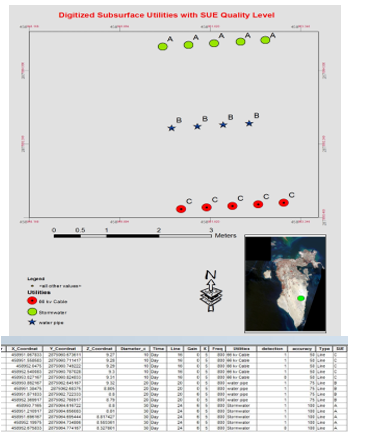
Figure 7 GIS-SUE integrated map with attribute
level. Such a system represents a new step in smart cities and office automation. In the past, the same procedure might have been done manually and by geophysical engineering experts.
The next step is to implement and test the prototype. The resulting maps provide several spatial analyses that help project managers, planners, and quantity surveyors assess the areas requiring an extra budget for upgrading data accuracy during construction and maintenance.
Maintenance costs for existing subsurface utilities can be estimated upon customizations and linked with utility maps.
- A. Nashwan, K. Al-Joburi, “A Prototype to Produce an Integrated GIS-SUE Map,” in 2021 International Conference on Innovation and Intelligence for Informatics, Computing, and Technologies (3ICT), IEEE, Bahrain: 592–597, 2021, doi:10.1109/3ICT53449.2021.9581853.
- S. Rana, N. Swarup, SUE Training Module Level One, 56, 2018.
- A. Nashwan, 3-D Subsurface Feature Mapping: Integrated Geospatial Approach, University of Bahrain, 2021.
- Y.J. Jung, “Evaluation of subsurface utility engineering for highway projects : Benefit – cost analysis,” Tunnelling and Underground Space Technology, 27(1), 111–122, 2012, doi:10.1016/j.tust.2011.08.002.
- B. Uslu, Y.J. Jung, S.K. Sinha, “Underground Utility Locating Technologies for Condition Assessment and Renewal Engineering of Water Pipeline Infrastructure Systems,” Journal of Pipeline Systems Engineering and Practice, 7(4), 221–242, 2016, doi:10.1061/(ASCE)PS.1949-1204.0000221.
- S. Rana, Advance GPR Training Course: Data processing, 2020.
- A. Fenais, S.T. Ariaratnam, S.K. Ayer, Nikolas Smilovsky, “Integrating Geographic Information Systems and Augmented Reality for Mapping Underground Utilities,” Infrastructures, 4(60), 1–17, 2019, doi:https://doi.org/10.3390/infrastructures4040060.
- M. Wang, Y. Deng, J. Won, J.C.P. Cheng, “Automation in Construction An integrated underground utility management and decision support based on BIM and GIS,” Automation in Construction, 107, 1–22, 2019, doi:10.1016/j.autcon.2019.102931.
- J.R. Meyers, “GIS in Utilities,” Geographical Information Systems: Management Issues and Applications, 2, 801–818, 1999.