An Efficient Way of Hybridizing Edge Detectors Depending on Embedding Demand

Adv. Sci. Technol. Eng. Syst. J. 8(1), 63–77 (2023);
 DOI: 10.25046/aj080108
Edge detection-based image steganography schemes usually embed data in edge pixels only. However, some schemes embed data in non-edge pixels as well. In that case, the schemes embed more bits in the edges than in the smoothed areas. In all cases, the schemes perform large changes in a tiny area of the image during small data embedding. Detecting such local modifications is comparatively easier for a steganalyzer. As a result, it is preferable to distribute bits evenly across the image. Again, the schemes struggle to hide large messages in a cover image due to the algorithmic approach of hiding a fixed number of bits per pixel. In this research, we have overcome that problem by employing multiple edge detectors in generating a resultant edge image. Depending on the embedding needs, we have checked whether a single edge detector is sufficient to help in conceiving all bits or not. If it is not possible for a single-edge detector, we have hybridized them. Hybridization of edge images is performed either by logical AND, OR or OR with dilation. When the message size is very small, we have generated the resultant edge image by doing a logical AND operation among the edge images. That strategy have reduced the number of edge pixels as well as helped in distributing the to-be-embedded bits over the image in a more evenly manner. Similarly, to meet a larger embedding demand, we have performed a logical OR operation among the same edge images to increase the number of edge pixels. Even, to meet more embedding demand, we have dilated the OR-resultant image. These processes were carried out dynamically in the research according to an embedding demand. The experimental results deduce that this scheme embeds 92.37%, 73.92%, 74.78%, and 9.60% more bits than four competing methods. Similarly, for small embedding demand, the proposed scheme demonstrates 37.45%, 46.87%, 44.21%, and 55.56% higher PSNR values than the others. Moreover, statistical analyses state that this scheme demonstrates stronger security against attacks.
1. Introduction
In steganography, an embedding method implants a secret in a cover media such as a text file, digital image, audio, video, IP protocol, bio-signals, DNA sequence, etc [1]. By implanting secrets in a media, these methods modify the contents of that cover media. That modified media is then known as stego media. As a cover media, digital images are widely used in steganography because of their higher degree of redundant information [2]. The performance of image steganography is mainly measured by a set of features like payload, imperceptibility, and security of stego image [3]. Steganography methods work in either spatial domain, transform coefficients or created residues [1]. In the spatial domain, the confidential information is concealed in either pixel values or to their processed values [4]–[6]. There a very commonly used method is least signifiresidue-based methods, the schemes implant secrets, generally, in pixel value differences (PVD) and prediction errors [8].
In terms of blindness, these schemes are categorized as reversible [6], [9]–[21] and irreversible [4, 5], [22]–[33] groups. In reversible steganography, the receiver rebuilds the cover image from the stego image in addition to extracting the desired secret message. On the other hand, the irreversible schemes extract the secrets only. Irreversible schemes are easy to implement and provide higher embedding capacity. For this, our research focuses on irreversible techniques. We concentrate our research target on the spatial domain only.
Machine learning is frequently used in cancer and kidney stone detection, image retrieval, and brain stroke [34]–[39]. Many of such applications use edge detection algorithm for localizing and visualizing target area in image and data. Before applying machine learning, if one wishes to implant privacy-preserving and securityrelated data [40]–[42] in the detected edge information that could be a promising technique to be used in the tele-medicine applications. Therefore, it is interesting to associate an edge detection method to divide the image contents into the edge and non-edge areas and to hide the data there [5, 6, 10, 31, 43].
In [22], [24], [33], [6], [2], the author used Canny edge detector to identify edge and non-edge pixels. All of the schemes used the LSB substitution method to hide data bits. In [25], [28] the author worked with different authors and applied a Canny edge detector in both cases to detect edge pixels. In [25] and [28], authors implanted data bits using reduplicated exploiting on the modification direction (REMD) and hybrid Hamming codes, respectively. In [8], the author employed a Canny edge detector as well and applied exclusive OR operation as a part of their embedding process. In [23], the author did the same but partitioned the image first into blocks. In addition to data implantation tasks, these schemes tried to their own ways to maintain a better visual quality in their stego images. In [3] and [31], the author used hybrid edge detection techniques in their data hiding process. They measured pixel value differences (PVD) first to decide the number of implanted bits per pixel and then used the LSB substitution method for data hiding. In [30], the author associated the Canny edge detector and PVD in their data hiding technique as well.
In [1] and [27], the author employed fuzzy edge detector to detect edge pixels and then used LSB substitution approach to implant the secrets into these detected edge pixels. In [1], the author used a chaotic method as a pre-processing task to encrypt the secret message.
Some authors first used multiple edge detectors using diverse edge operators, e.g., Canny, Sobel, and Fuzzy operators, and then hybridized these edge images to increase the number of edge pixels [4] in the resultant edge image. They used the LSB substitution method in their data implantation phase. To minimize the distortion of [4], in [26], the author divided the image into blocks and thereafter, they applied a hybridization process to these detected edge images. In [31], the author used another hybrid edge detection technique. He, additionally, performed a morphological dilation operator in their data-hiding phase to increase embedding capacity. In [32], the author hybridized the edge images by logical AND operator to increase the stego image quality while implanting small sized messages. In [5], the author proposed another edge detection based steganography method. They tested their scheme for Canny, Sobel, and Fuzzy-based edge detectors. They used the renown LSB substitution method to implant data bits. In [29], Ghosal proposed a steganography scheme using the Kirsch edge detection method where they implanted the message bits into each triplet of pixels. Therefore, the embedding capacity is low.
In this study, we have proposed a new hybrid edge detectionbased embedding process where it embeds more bits in edge pixels than non-edge ones. The proposed scheme employs multiple edge detection methods and finds the best detector for what the demanded message bits are just conceivable. Depending on embedding demand, it determines whether a single edge detector is capable to help in hiding entire secrets. If the size of the secret message is too small or very high than the embedding capacity by using a single edge detector, it hybridizes the edge images in both cases. When the message length is too small, the proposed scheme hybridizes edge images by logical AND operator to reduce the number of edge pixels. The number of edge images is employed in the AND operation depending on the message length. The resultant edge image helps the embedding algorithm to distribute the secret bits in the cover image more evenly. Again, to implant a large-size message, it performs a logical OR operation among the edge images to increase the number of edge pixels in the resultant edge image. Even, if OR is unable to implant the whole secret message, the scheme employs a morphological dilation operation to further increase the number of edge pixels in the resultant edge image. The scheme does that hybridization and dilation operation dynamically realizing the length of the secret message and computing the embeddable bits through that resultant edge image. Experimental results show that our proposed scheme performs better than the other competing methods for all the performance measuring parameters.
Contributions of this research are listed below: • This scheme dynamically chooses the best one of the four different embedding techniques depending on the message length.
- We have allowed the scheme to implant a different number of bits in edge and non-edge pixels according to embedding demand.
- Our proposed method increases the visual quality of stego image and embedding capacity as well. At the same time, it shows strong resistance against statistical attacks.
The rest of this paper is organized as follows: section 2 concisely presents the related works. The proposed method is described neatly in section 3. Section 4 demonstrates the simulated results of our scheme. The results of testing the robustness of the proposed scheme against attacks are devoted in section 5. Finally, section 6 concludes the article.
2. Related Works
2.1. A Brief on Edge Detectors
The sharp changes in the image brightness are called the edges or boundaries of the image. Edges may exist in horizontal, vertical, or diagonal directions. The method which is used to detect the edges of an image is called edge detection. A filter, known as kernel or operator is used to identify the edges in an image. Very commonly used edge detectors are canny, sobel, log, Prewitt, kirsch, laplacian, and fuzzy. Generally, edge detectors are used in pattern recognition, feature extractions, and image morphology. In the field of detectionbased, edge detectors are used to improve the security of data hidden. These schemes first detect the edge pixels and non-edge pixels in a cover image and implant only edge pixels or both categories. We have studied a good number of articles on that state art. Among those, we found the works of [5], [31], [33] and read them very carefully and attentively and built the foundation of our proposed work on them.
2.2. Single edge-based image steganography
In [5], the author proposed an edge-detection-based steganographic method. This scheme copied the cover image and cleared n−bits LSBs from it. Then it applies various popular edge detectors such as canny, Sobel, fuzzy, etc., and generates an edge image. This scheme classifies the contents of cover image pixels as edge and non-edge pixels based on that edge image. This scheme then implants x bits of secrets into edge pixels and y bits into non-edge pixels and generates a stego image. This is the embedding process. In the extraction phase, the receiver extracts the secret messages from the stego image using the reverse process of embedding.
2.3. Hybrid edge-based image steganography
In 2018, Rasol [33] proposed an image steganography using a hybrid edge detection technique. In this scheme, the authors apply canny and Sobel edge detection methods and generate edge area. They combined those edge areas using logical OR operation. On the other hand, they also add a special character at the end of the message and convert it into binary according to ASCII. Then they embed x bits into the edge area and y bits into the non-edge area using the LSB method and thus generate a stego image and send it to the receiver. The receiver performs the reverse of the embedding process and extracts the secret message.
2.4. Dilated hybrid edge-based image steganography
In [31], the author proposed a dilated hybrid edge detection-based image steganography scheme. This method has three phases such as preprocessing, embedding, and extraction. Like as [5], this scheme also copies the cover image and cleared n−bits LSBs from it. This scheme then applies m−number of edge detectors such as e1,e2,……,em and combine two edge detectors using logical OR operation. This scheme also used morphological operators such as dilation to increase the number of edge pixels. Based on the dilated hybrid edge image, all the contents of the cover image pixels are classified as edge pixels and non-edge pixels. The XOR operator is used in the embedding process to improve security. This scheme implants x bits information in edge pixels and y bits into non-edge pixels and generates a stego image. In the extraction phase, the receiver extracts the secret message using the reversible method of embedding.
2.5. Edge-based image steganography
In [32], the author proposed an image steganography method based on hybrid edge detection. This scheme all most similar to setiadi’s method [31]. The difference between those schemes is, [32] is applicable for small message sizes with maintaining good visual quality and [31] has good embedding capacity with maintaining visual quality. The scheme [32] used logical AND operation instead of logical OR operation.
Table 1 gives a summary of this work.
Table 1: Summary of related works. Uses of multiple edge detectors and dilating the hybrid edge image are the key distinguishing features of this scheme.
| Criteria | [32] | [5] | [33] | [31] |
| Cleared LSBs? | Yes | Yes | No | Yes |
| Hybridize edge images? | Yes | No | Yes | Yes |
| Dilate edge image? | Yes | No | No | Yes |
| Use an edge detector? | Yes | Yes | Yes | Yes |
| Encrypt message? | No | No | Yes | Yes |
| Embed as (x,y) bits? | Yes | Yes | Yes | Yes |
| Message type? | Text | Binary | Text | Text |
3. Proposed method
The proposed work consists of three phases: pre-processing, data embedding, and data extracting. The description of these phases is given below:
3.1. Pre-processing phase
As our target is to implant the message in both edge and non-edge pixels, we perform single edge detectors or hybridize edge detectors based on message length mL and maximum achievable payload. We take an instance of the cover image and cleared n− bits LSBs from it. Then we apply m− number of edge detectors. We select the best suitable edge detector in the following way:
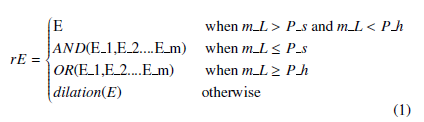
We select single edge detector E when message length mL is greater than the probable highest payload Ph and less than the probable smallest payload Ps. When message length mL is less than Ps then we hybridize two or more edge images using AND operation. we also hybridize two or more edge images using OR operation when message length mL is greater than the probable highest payload Ph. In another case, we used morphological operator dilation when the message length is large. Let the cover image is C and an instance of it by I. We first clear n−bits of LSBs from every pixel of I by equation(2).
![]()
where function f returns the remainder value when one divides I(i,j) by 2n.
We have applied m−number of edge detection operators, e.g., canny, sobel, fuzzy, Robert, Prewitt, log, etc on the cleared image I to detect edge pixels, separately. We have generated the edge image by equation (3).
![]()
where ψ is one of the m edge detection operators, i.e., Ωϵ{canny, sobel,log, fuzzy,Robert, Prewitt,etc.} and 1 <= I <= m and ψ returns the edge image eI from I for a specific edge detector Ω. We also make all possible combinations of edge images if needed. We performed logical AND, OR, or dilation operations in each group. Each edge image is a binary image. For each pixel, the edge image holds a 0 or 1. A 1-in-edge image means the corresponding pixel of I is in the detected edge.
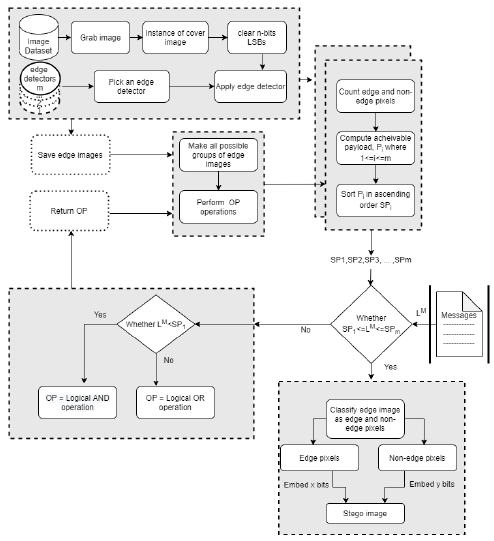
Figure 1: Preprocessing and embedding Phase.
We compute the maximum achievable payload Pi by using equation(4). Payload is the total embedded bits.
![]()
Where ePN is the edge pixel and neN is the non-edge pixels and x and y are the number of embedded bits, 1 <= x <= 5 and 1 <= y <= 4.
We then sort Pi in ascending order i.e. P1 < P2 < P3 < ……….. < Pi.
We calculate the total embedded message length mL by equation
![]()
Next, we check which one first meets the requirement of embedding payload mL, say Pk using equation (1). Pk is the resultant edge image.
Those are the pre-processing stage. This is illustrated in Figure (1) up to (4) blocks.
3.2. Data embedding phase
Now it is the time to implant secrets in the image I. The preprocessing and embedding process is illustrated in Figure (1). The data implantation steps are as follows:
- An algorithm is developed to classify edge and non-edge pixels and their location in I based on resultant edge image Pk by equation (6).
![]()
Where F returns edge pixels ePN, their positions ePNP, nonedge pixels neN and their positions neNP in I. The function F performs in following:
Function F(I, Pk)
Compute the size of image I. Let it is (h,w)
[ePN,ePNP] = Ge(I, Pk,h,w)
CPk = (Pk − 1) ∗ (−1)
[neN,neNP] = Ge(I,CPk,h,w) return [ePN,ePNP,neN,neNP] Where Ge is defined below.
Function Ge(Q,R,h,w) k = 0
for i = 1toh for j = 1tow if R(i, j) == 1 R1(k) = Q(i, j) R2(k,1) = i,R2(k,2) = j return R1,R2
- Now, we implant x bits and y bits of secrets in each edge and non-edge pixel, respectively of the cover image by the LSB substitution method. Let x bits of information be bx and y bits of information are by. In that, the substitution task is performed by equation (7).
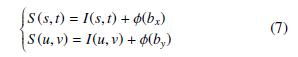
where ϕ(bx) stands for decimal conversion of binary bx. s = ePNP(i,1), t = ePNP(i,2), u = neNP(j,1), v = neNP(j,2) and 1 ≤ i ≤ No O Edge Pixels, 1 ≤ j ≤
No Of nonEdge Pixels. Here bx will be different for each of the s and t. The same is true for by. This means that each time a different bx and by of the secret will be implanted. That stego image S is then sent to a receiver end. The receiver end next extracts the implanted secrets from S.
3.3. Data extraction phase
In the extraction phase, the receiver receives the stego image and stego key. The receiver gets the necessary information from the stego key such as the number of cleared bits n, the name of selected edge detectors, the number of bits embedded in edge and non-edge pixels, and message length. Like the sender, the receiver copies the stego image S to I. It then clears n bits of LSBs from I by equation (1). Let, that n−LSBs cleared image is also I. The scheme that applies m− number of edge detectors on I from stego key. We have then separated the edge and non-edge pixels and their corresponding positions in I by equation (6). Next from each of the edge and nonedge located pixels, i.e., from (s,t) and (u,v), we have measured dx
Here s,t,u,v,i,and j are defined in the previous subsection. Next, we extracted the binaries of the secret by equation (10).
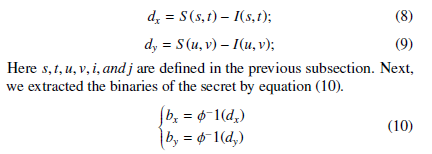
Where ϕ−1 means binary conversion of decimal value dx.
4. Result analysis and discussion
In this section, we show the experimental results conducted to evaluate the performance of the proposed scheme with the works of Sultana [32], Bai [5], Rasol [33] and Setiadi[31]. We first selected ten frequently used images, an image dataset, and a message dataset. We set up our experiment and then analyzed the results.
4.1. Experimental Setup
We worked on MATLAB’s edition R(2017a) on windows 7. The experiments were performed on a desktop that is specified by an Intel (R) Core (TM) i5-8500T CPU @ 2.10 GHz 2.11 GHz processor and RAM of 8.00 GB. In the proposed system we used two different types of input data one is the secret message, i.e. to be implanted data, and the other is the cover image. We first collected some sample messages from different sources, as shown in Table 2.
The sample message could be a text, binary, or any other format. We used our prepared function ConBin to convert the non-binary input data to binary. For example, text data is converted to binary from the ASCII values of the text contents. We work for different sizes of message lengths. As a cover media, We collected ten frequently used standard images as shown in Figure 2 to conduct all our primary experiments. We also used 499 images of the BOSS dataset. We converted the color of the images to grayscale and resized them to 512 x 512. As the contents of the dataset are images, we worked with intensity values of pixels. Thus the final inputed values to our embedding algorithm are binary for secret message and pixel values for cover media. We measured the performance of the schemes by several feature values, such as edge pixel generation capability, embedding capacity, peak signal-to-noise ratio (PSNR), structural similarity index matrix (SSIM), standard deviation, correlation coefficient, entropy, cosine similarity, and Pixel difference histogram, etc.
Table 2 is given as a message dataset of this work.
Table 2: List of message dataset with message length and type
| DatasetName | Message Length | Message Type |
| SupervisorMessage | 398833 | text |
| M1 | 274661 | binary |
| M2 | 442483 | text |
| M3 | 693637 | binary |
A supervisor Message is a text-type message from my supervisor. The message is Though the life of a Ph.D. researcher is a matter of struggle, it is enjoyable as well. Bethe cause finding some novelty is always challenging and overcoming such challenge gives a researcher heavenly happiness……..,.
4.2. Mathematical Representation of Feature values
Let the number of edge and non-edge pixels in a cover image are ePN and neN, respectively. Then the maximum achievable payload PL is defined by equation (11)
![]()
Where x and y are the numbers of bits embedded in the edge and the non-edge pixels. We also measured the capacity. Capacity can be defined as the number of implanted bits per pixel. Embedding capacity EC is measured by equation (12)
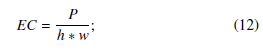
Where, P is the total number of implanted bits in the cover image, h and w are the image height and width. Maintaining image quality is a challenging task and for this purpose, we used PSNR and SSIM which are commonly used image distortion measurement parameters. PSNR is measured by equation (13)
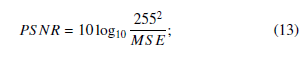
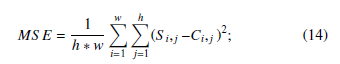
here, S is the stego image and C is the original cover image. Next, SSIM is calculated by equation (15)
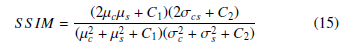
here, µc and σc are the mean and variance of pixel values in the cover image. Likewise cover, µs, and σs are the same for the stego image. C1 and C2 are two constants and we set C1 = 0.0001 and C2 = 0.0009 for experiment. There are many methods of analyzing the robustness against various attacks. Famous techniques are entropy measurement, standard deviation measurement, analyzing correlation among the pixels, checking the cosine similarity between the cover and stego image, and histogram of the Pixel difference between the stego and cover image. The entropy is measured by equation (16)
Where N is the number of data points, xi each of the values of the data, and x is the mean of xi.
Population correlation is defined by equation (18) σcs
![]()
Where σc and σs are population standard deviations in cover C and stego S. Again, σcs is the co-variance between the cover and stego image. Equation (19) gives us the cosine similarity values
Where C and S are cover and stego images.
4.3. Experimental results and discussions
In the experiment, we first applied canny, sobel, log, Prewitt, and Roberts edge detectors in five LSBs cleared images to identify edge and non-edge pixels. Canny, sobel, log, Prewitt, and Roberts-based edge detector functions of MATLAB return an edge image for a given input image. The edge image is a binary image. The obtained edge images generated from ten input images, are shown in Table 3. In the previous section, according to the embedding rules we implant x bits of information in edge pixels and y bits of information in non-edge pixels and that represent as a tuple (x,y) where x > y. Table 4 summarises the number of edge pixels that were found in ten sample images by different methods. Table 4 provided statistics collected from 5-LSBs cleared images.
We calculated the maximum achievable payload of each edge image
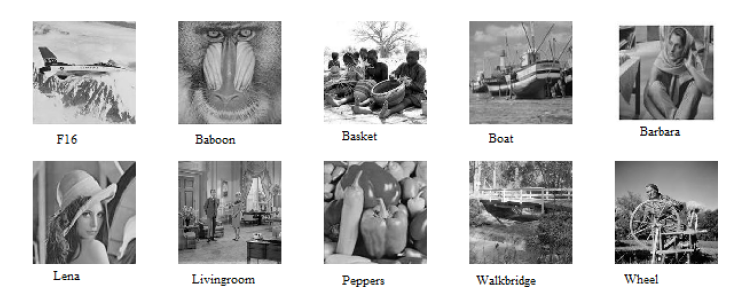
Figure 2: Sample cover images.
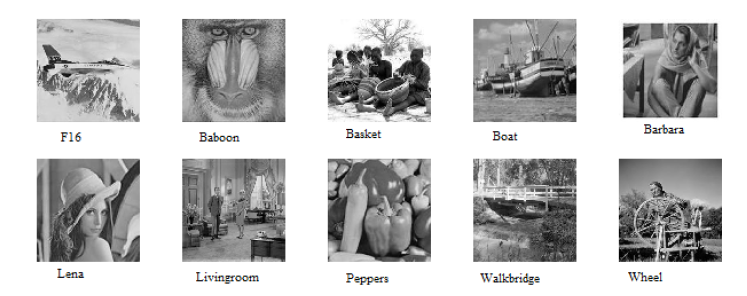
Figure 3: Stego images for the cover images of Figure 2.
Table 3: Edge images generated from ten cover images. The images were formed for Canny, Log, Prewitt, Sobel, and Robert edge detectors from 5-LSBs cleared images (n=5).
| ImageName | Methods | ||||
| Canny | Log | Prewitt | Sobel | Roberts | |
| F16.jpg
babon.jpg basket.jpg boat.jpg brbra.jpg lena.jpg livingroom.jpg pepper.jpg walkbridge.jpg wheel.jpg |
| ImageName | Elapsed time | ||||
| Proposed | [32] | [5] | [33] | [31] | |
| F16.jpg | 13.32 | 13.32 | 13.32 | 13.47 | 12.20 |
| babon.jpg | 13.45 | 13.23 | 13.66 | 13.75 | 9.89 |
| basket.jpg | 13.69 | 13.38 | 13.61 | 13.59 | 11.01 |
| boat.jpg | 13.28 | 13.41 | 13.50 | 13.68 | 11.18 |
| brbra.jpg | 13.18 | 13.00 | 13.49 | 13.32 | 11.37 |
| lena.jpg | 13.19 | 13.43 | 13.52 | 13.45 | 11.51 |
| livingroom.jpg | 13.48 | 13.39 | 13.58 | 13.72 | 9.72 |
| pepper.jpg | 14.38 | 13.39 | 13.47 | 13.47 | 11.26 |
| walkbridge.jpg | 13.60 | 13.27 | 13.81 | 13.85 | 9.44 |
| wheel.jpg | 13.49 | 13.42 | 13.43 | 13.46 | 11.64 |
which is shown in Figure 4. That figure states that canny is the Table 6: Elapsed time for message length = 398833 bits. highest and Prewitt is the lowest value of the maximum achievable payload. At the same time, for the experimental purpose, we take four sample messages and the length are 398833 bits, 274661 bits, 442483 bits, and 693637 bits. We demonstrate various experimental results for those messages.
We analyzed the performance in embedding capacity as well. Embedding capacity is graphically shown in Figure 5 for 499 images of the BOSS dataset. We also analyzed the visual quality and structural originality of stego images. Visual quality is measured by PSNR values and is sketched in Figure 6 for a message length of 398833 bits. PSNR value in our scheme is higher than the others which are 37.45%, 46.87%, 44.21%, and 55.56%. It is clear from the diagram that the proposed scheme has a higher PSNR value than the competing schemes. The structural similarity index value, SSIM, for message length = 398833 bits is listed in Table 5. The table confirms that the SSIM values of all the schemes are both high and very close to each other.
Table 7 and Table 8 contain the values of PSNR and SSIM for message lengths 274661 bits, 442483 bits, and 693637 bits. We analyzed the time complexity of diverse schemes by measuring their required data embedment times for a message length of 398833 bits. The time complexity of the schemes is measured experimentally and tabulated in Table 6.
Table 4: A comparison of the number of edge pixels on various edge detectors for cleared images (n=5).
| ImageName | Methods | ||||
| Canny | Log | Prewitt | Sobel | Roberts | |
| F16.jpg | 24966 | 19532 | 8119 | 7786 | 5239 |
| babon.jpg | 38383 | 26700 | 2700 | 1966 | 26603 |
| basket.jpg | 31560 | 21967 | 8603 | 9145 | 5323 |
| boat.jpg | 26991 | 21406 | 4555 | 14018 | 23576 |
| brbra.jpg | 26941 | 19099 | 4536 | 4010 | 1595 |
| lena.jpg | 24884 | 19391 | 12270 | 12229 | 21061 |
| livingroom.jpg | 35543 | 25742 | 12253 | 11998 | 7049 |
| pepper.jpg | 25860 | 19595 | 4686 | 14211 | 21890 |
| walkbridge.jpg | 45563 | 28134 | 8405 | 9388 | 4685 |
| wheel.jpg | 27745 | 20467 | 8726 | 8870 | 8544 |
| ImageName | SSIM values | ||||
| Proposed | [32] | [5] | [33] | [31] | |
| FF16.jpg | 0.993 | 0.992 | 0.975 | 0.984 | 0.961 |
| babon.jpg | 0.972 | 0.971 | 0.924 | 0.946 | 0.911 |
| basket.jpg | 0.997 | 0.995 | 0.987 | 0.989 | 0.979 |
| boat.jpg | 0.993 | 0.962 | 0.964 | 0.980 | 0.948 |
| brbra.jpg | 0.994 | 0.995 | 0.966 | 0.986 | 0.945 |
| lena.jpg | 0.987 | 0.954 | 0.953 | 0.973 | 0.928 |
| livingroom.jpg | 0.997 | 0.994 | 0.986 | 0.988 | 0.978 |
| pepper.jpg | 0.990 | 0.950 | 0.954 | 0.979 | 0.933 |
| walkbridge.jpg | 0.998 | 0.996 | 0.986 | 0.989 | 0.984 |
| wheel.jpg | 0.996 | 0.994 | 0.989 | 0.990 | 0.982 |
Table 5: SSIM values when message length = 398833 bits.
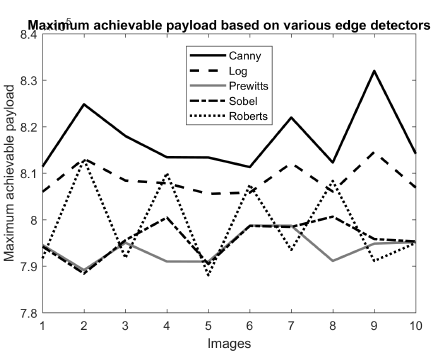
Figure 4: Maximum achievable payload based on diverse edge detectors where x = 4 and y = 3. The figure states that canny has the highest achievable payload than log, Prewitt’s, sobel, and Roberts.
Table 7: SSIM values of different schemes
| Methods | ImageName | Message length (bits) | ||
| 274661 | 442483 | 693637 | ||
| Proposed method | F16.jpg boat.jpg | 0.994
0.991 |
0.967
0.953 |
0.948
0.924 |
| pepper.jpg | 0.988 | 0.941 | 0.905 | |
| [32] | F16.jpg boat.jpg | 0.993
0.972 |
0.992
0.962 |
0.992
0.962 |
| pepper.jpg | 0.962 | 0.950 | 0.950 | |
| [5] | F16.jpg boat.jpg | 0.978
0.972 |
0.975
0.964 |
0.975
0.964 |
| pepper.jpg | 0.963 | 0.954 | 0.954 | |
| [33] | F16.jpg boat.jpg | 0.987
0.985 |
0.984
0.980 |
0.984
0.980 |
| pepper.jpg | 0.982 | 0.979 | 0.979 | |
| [31] | F16.jpg boat.jpg | 0.969
0.961 |
0.957
0.940 |
0.955
0.929 |
| pepper.jpg | 0.953 | 0.924 | 0.913 | |
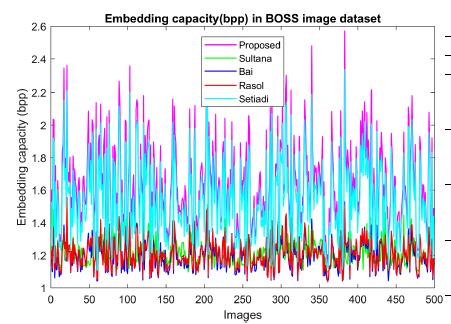
Figure 5: Performance comparison of the proposed scheme with Sultana [32], Bai [5], Rasol [33], and Setiadi [31] in terms of capacity in the BOSS image dataset.
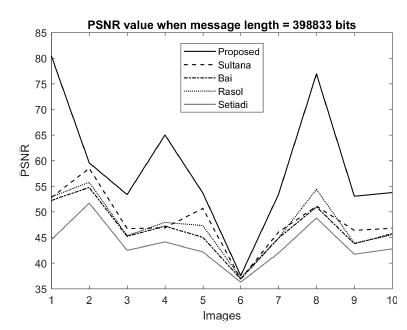
Figure 6: Performance comparison of the proposed scheme with Sultana [32], Bai[5], Rasol [33], and Setiadi [31] in terms of PSNR when message length = 398833
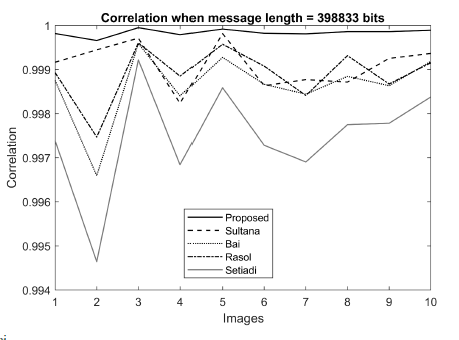
Figure 7: Performance comparison of the proposed scheme with Sultana [32], Bai bits. The figure states that the proposed scheme dominates the other competing [5], Rasol [33], and Setiadi [31] in terms of Correlation coefficients when message schemes. length = 398833 bits.
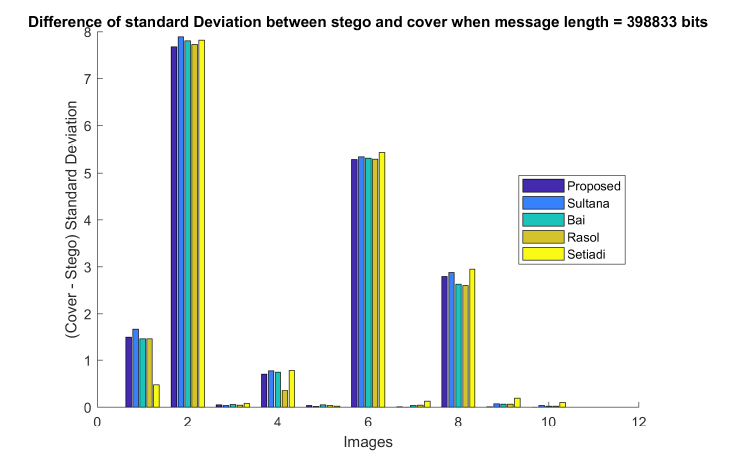
Figure 8: Difference of standard Deviations of cover and stego images when message length = 398833 bits. The figure states that the differences are very small and close to each other.
Table 8: PSNR values of different schemes Table 9: Elapsed time of different schemes
|
|
||||||||||||||||||||||||||||||||||||||||||||||||||||||||||||||||||||||||||||||||||||||||||||||||||||||||||||||||||||||||
Table 9 contains the time complexity for message lengths 274661 bits, 442483 bits, and 693637 bits.
| Methods | ImageName | Message length (bits) | |||
| 274661 | 442483 | 693637 | |||
| Proposed method | F16.jpg boat.jpg | 0.999
0.999 |
0.998
0.997 |
0.996
0.995 |
|
| pepper.jpg | 0.999 | 0.998 | 0.996 | ||
| [32] | F16.jpg boat.jpg | 0.999
0.998 |
0.999
0.998 |
0.999
0.998 |
|
| pepper.jpg | 0.999 | 0.998 | 0.998 | ||
| [5] | F16.jpg boat.jpg | 0.998
0.998 |
0.998
0.998 |
0.998
0.998 |
|
| pepper.jpg | 0.999 | 0.998 | 0.998 | ||
| [33] | F16.jpg boat.jpg | 0.999
0.999 |
0.998
0.998 |
0.998
0.998 |
|
| pepper.jpg | 0.999 | 0.999 | 0.999 | ||
| [31] | F16.jpg boat.jpg | 0.998
0.997 |
0.997
0.996 |
0.996
0.996 |
|
| pepper.jpg | 0.998 | 0.997 | 0.997 | ||
| Table 11: Standard deviations values of different schemes | |||||
| Methods | ImageName | Message length (bits) | |||
| 274661 | 442483 | 693637 | |||
| Proposed method | F16.jpg boat.jpg | 1.49
0.71 |
1.45
0.76 |
0.38
0.50 |
|
| pepper.jpg | 2.58 | 2.65 | 2.77 | ||
| [32] | F16.jpg boat.jpg | 1.65
0.74 |
1.66
0.77 |
1.66
0.77 |
|
| pepper.jpg | 2.86 | 2.87 | 2.87 | ||
| [5] | F16.jpg boat.jpg | 1.46
0.72 |
1.46
0.74 |
1.46
0.74 |
|
| pepper.jpg | 2.61 | 2.62 | 2.62 | ||
| [33] | F16.jpg boat.jpg | 1.46
0.34 |
1.46
0.35 |
1.46
0.35 |
|
| pepper.jpg | 2.59 | 2.59 | 2.59 | ||
| [31] | F16.jpg boat.jpg | 0.53 0.85 | 0.47 0.80 | 0.47 0.83 | |
| pepper.jpg | 2.93 | 2.93 | 2.97 | ||
Table 10: Correlation values of different schemes stego image. We also measured the standard deviation of pixel values from, their mean, separately in cover and stego image is σc and σs for message length 398833 bits. We then calculated their difference by sigma=σc − σs. Ideally, σd should be zero for a non-tempered image. The results are shown in Figure 8.
Table 10 and Table 11 contains the values of correlation coefficients and standard deviations for message length 274661 bits, 442483 bits, and 693637 bits.
To verify further with similar statistics, we measured cosine similarities between the cover and stego images for a message length of 398833 bits. That value is 1 for two identical images and 0 for two fully mismatched images. The results are demonstrated in Figure 9. The figure illustrates that our proposed method shows higher values than the other competing schemes.
We computed, the entropy values H as well in cover and stego images for message length 398833 bits. Next, we calculated their differences. That difference value is zero for two identical images. Results are plotted in Figure 10. The figure shows that none of the results are greater than 0.04, i.e., these are very small and close to zero.
5. Robustness of the proposed scheme against attacks
We statistically analyzed our scheme using various parameters such as correlation coefficient, standard deviation, entropy, cosine similarities, and pixel difference histogram to check its robustness against various attacks, We first measured correlation coefficients ρsC between the cover and stego image for message length 398833 bits. ρsC = 0 stands for no relationship between two images. ρsC > 0 means a positive correlation between the cover and stego image and lies perfect relationship when it reaches 1. Similarly, a negative value of ρsC indicates a negative relationship. Results of ρsC are depicted in Figure 7. Through proposed method shows a higher.
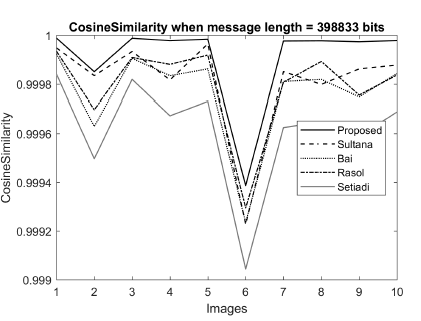
Figure 9: Performance comparison of the proposed scheme with Sultana [32], Bai correlation value, its difference from others is insignificance.
Rather, [5], Rasol [33], and Setiadi [31]in terms of Cosine similarity when message length = as with others, it represents a higher correlation between cover and 398833 bits.
Table 13: Entropy values of different schemes
| Methods | ImageName | Message length (bits) | ||
| 274661 | 442483 | 693637 | ||
| Proposed method | F16.jpg boat.jpg | 0.027
0.030 |
0.040
0.046 |
0.052
0.068 |
| pepper.jpg | 0.028 | 0.029 | 0.046 | |
| [32] | F16.jpg boat.jpg | 0.024
0.020 |
0.031
0.039 |
0.031
0.039 |
| pepper.jpg | 0.011 | 0.024 | 0.024 | |
| [5] | F16.jpg boat.jpg | 0.022
0.023 |
0.033
0.040 |
0.033
0.040 |
| pepper.jpg | 0.014 | 0.025 | 0.025 | |
| [33] | F16.jpg boat.jpg | 0.022
0.019 |
0.032
0.028 |
0.032
0.028 |
| pepper.jpg | 0.021 | 0.029 | 0.029 | |
| [32] | F16.jpg boat.jpg | 0.021
0.019 |
0.043
0.048 |
0.048
0.069 |
| pepper.jpg | 0.0008 | 0.032 | 0.044 | |
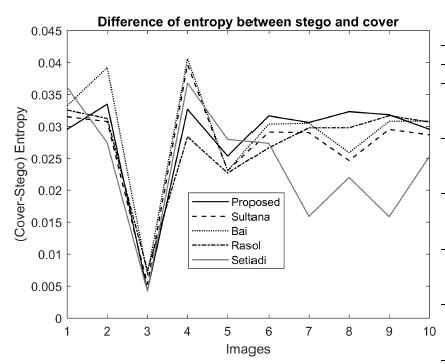
Figure 10: Performance comparison of the proposed scheme with Sultana [32], Bai [5], Rasol [33], and Setiadi [31] in terms of entropy values when message length = 398833 bits.
Table 12: Cosine similarity values of different schemes
| Methods | ImageName | Message length (bits) | ||
| 274661 | 442483 | 693637 | ||
| Proposed method | F16.jpg boat.jpg | 0.9999
0.9999 |
0.9998
0.9997 |
0.9997
0.9995 |
| pepper.jpg | 0.9999 | 0.9997 | 0.9995 | |
| [32] | F16.jpg boat.jpg | 0.9999 0.9998 | 0.9999 0.9998 | 0.9999 0.9998 |
| pepper.jpg | 0.9998 | 0.9997 | 0.9997 | |
| [5] | F16.jpg boat.jpg | 0.9999 0.9998 | 0.9999 0.9998 | 0.9999 0.9998 |
| pepper.jpg | 0.9998 | 0.9998 | 0.9998 | |
| [33] | F16.jpg boat.jpg | 0.9999
0.9999 |
0.9999
0.9998 |
0.9999
0.9998 |
| pepper.jpg | 0.9999 | 0.9998 | 0.9998 | |
| [31] | F16.jpg boat.jpg | 0.9998
0.9997 |
0.9998
0.9996 |
0.9998
0.9995 |
| pepper.jpg | 0.9997 | 0.9996 | 0.9995 | |
Table 12 and Table 13 contains the values of cosine similarity and entropy for message length 274661 bits, 442483 bits, and 693637 bits.
We also used, another statistical tool pixel difference histogram(PDH) to identify the stego images. The PDH of the original images and corresponding stego images are shown in Figure 11 and Figure 12 for message length 398833 bits.
Thus, it can be deduced from the results of these experiments that our method is strong enough to protect against attacks on implanted data.
6. Conclusion
The edge-detection-based embedding schemes, generally, implant either in edge pixels only or a different number of bits in edge and non-edge pixels. Few of them use multiple edge detectors and hybridize them to increase the number of edge pixels in the resultant edge image. Even, either maintaining the visual quality of stego image or meeting the embedding demand is still functioning as a challenging matter. This research overcomes that problem by realizing the situation and then dynamically choosing the number of implanted bits per pixel, the required edge detectors, and the best hybridization technique.
Edge detectors are selected and their hybridization is performed based on message length. This scheme, thus, increases or decreases the number of edge pixels and fixes the number of implanted bits per edge and non-edge pixels according to the embedding demand. The experimental result deduces that this scheme embeds 92.37%,
73.92%, 74.78%, and 9.60% more bits than [32], [5], [33], [31], respectively. Similarly, for a small embedding demand, the proposed scheme demonstrates 37.45%, 46.87%, 44.21%, and 55.56% higher PSNR values than [32], [5], [33], [31], respectively. Moreover, the statistical analyses state that this scheme exhibits stronger security against attacks.
In our future work, we wish to apply this high-performing embedding scheme in electronic kit development for use in healthcare and forensic-related applications. We also plan to apply a machine learning algorithm for segmenting the image areas into different complex levels so that we can implant a different number of bits in those staged areas, i.e. levels.
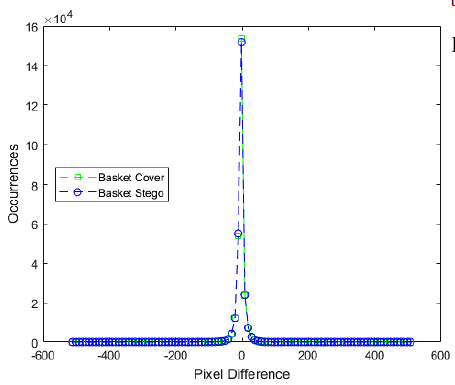
Figure 11: Performance comparison of the proposed scheme with Sultana, Bai, Rasol, and Setiadi in terms of pixel difference histogram when message length = 398833 bits for basket cover image.
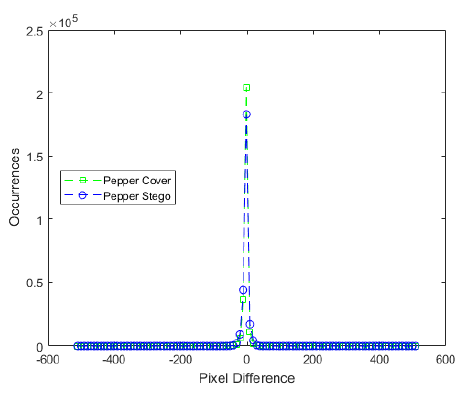
Figure 12: Performance comparison of the proposed scheme with Sultana, Bai, Rasol, and Setiadi in terms of pixel difference histogram when message length = 398833 bits for peppers cover image.
Conflict of Interest
There is nothing related to conflict of interest.
Acknowledgment
The first author is a research fellow of the ICT division of the Ministry of Post, Telecommunication, and Information Technology of the Government of Bangladesh. Therefore, we want to devote a thank to the concerned ministry, and at the same time, we would like to acknowledge that support.
- C. Vanmathi, S. Prabu, “Image steganography using fuzzy logic and chaotic for large payload and high imperceptibility,” International Journal of Fuzzy Systems, 20(2), 460–473, 2018, doi:10.1007/s40815-017-0420-0.
- E. J. Kusuma, O. R. Indriani, C. A. Sari, E. H. Rachmawanto, et al., “An im- perceptible LSB image hiding on edge region using DES encryption,” in 2017 International Conference on Innovative and Creative Information Technology (ICITech), 1–6, IEEE, 2017, doi:10.1109/INNOCIT.2017.8319132.
- M. Hussain, A. W. A. Wahab, N. Javed, K.-H. Jung, “Recursive information hiding scheme through LSB, PVD shift, and MPE,” IETE Technical Review, 35(1), 53–63, 2018, doi:10.1080/02564602.2016.1244496.
- W.-J. Chen, C.-C. Chang, T. H. N. Le, “High payload steganography mech- anism using hybrid edge detector,” Expert Systems with applications, 37(4), 3292–3301, 2010, doi:10.1016/j.eswa.2009.09.050.
- J. Bai, C.-C. Chang, T.-S. Nguyen, C. Zhu, Y. Liu, “A high payload stegano- graphic algorithm based on edge detection,” Displays, 46, 42–51, 2017, doi:10.1016/j.displa.2016.12.004.
- H. Sultana, A. Kamal, “An Edge Detection Based Reversible Data Hiding Scheme,” in 2022 IEEE Delhi Section Conference (DELCON), 1–6, IEEE, 2022, doi:10.1109/DELCON54057.2022.9753404.
- P. W. Adi, F. Z. Rahmanti, N. A. Abu, “High quality image steganography on integer Haar Wavelet Transform using modulus function,” in 2015 International Conference on Science in Information Technology (ICSITech), 79–84, IEEE, 2015, doi:10.1109/ICSITech.2015.7407781.
- H. Al-Dmour, A. Al-Ani, “A steganography embedding method based on edge identification and XOR coding,” Expert systems with Applications, 46, 293–306, 2016, doi:10.1016/j.eswa.2015.10.024.
- A. Kamal, M. M. Islam, “A prediction error based histogram association and mapping technique for data embedment,” Journal of Information Security and Applications, 48, 102368, 2019, doi:10.1016/j.jisa.2019.102368.
- H. Sultana, A. Kamal, M. M. Islam, “Enhancing the Robustness of Visual Degradation Based HAM Reversible Data Hiding.” J. Comput. Sci., 12(2), 88–97, 2016, doi:10.3844/jcssp.2016.88.97.
- A. Kamal, M. M. Islam, “Enhancing embedding capacity and stego image quality by employing multi predictors,” Journal of Information Security and Applications, 32, 59–74, 2017, doi:10.1016/j.jisa.2016.08.005.
- A. Kamal, M. M. Islam, “Boosting up the data hiding rate through multi cycle embedment process,” Journal of Visual Communication and Image Representa- tion, 40, 574–588, 2016, doi:10.1016/j.jvcir.2016.07.023.
- A. Kamal, M. M. Islam, “Capacity improvement of reversible data hiding scheme through better prediction and double cycle embedding process,” in 2015 IEEE International Conference on Advanced Networks and Telecommunca- tions Systems (ANTS), 1–6, IEEE, 2015, doi:10.1109/ANTS.2015.7413636.
- A. Kamal, M. M. Islam, “An image distortion-based enhanced embed- ding scheme,” Iran Journal of Computer Science, 1(3), 175–186, 2018, doi:10.1007/s42044-018-0016-3.
- A. Kamal, M. M. Islam, Z. Islam, “An embedding technique for smartcard- supported e-healthcare services,” Iran Journal of Computer Science, 3(4), 195–205, 2020, doi:10.1007/s42044-020-00055-1.
- A. Kamal, M. M. Islam, “Enhancing the embedding payload by handling the affair of association and mapping of block pixels through prediction errors histogram,” in 2016 International Conference on Networking Systems and Security (NSysS), 1–8, IEEE, 2016, doi:10.1109/NSysS.2016.7400691.
- A. Kamal, M. M. Islam, “Enhancing the performance of the data em- bedment process through encoding errors,” Electronics, 5(4), 79, 2016,
doi:10.3390/electronics5040079. - A. Kamal, M. M. Islam, “Facilitating and securing offline e-medicine service through image steganography,” Healthcare Technology Letters, 1(2), 74–79, 2014, doi:10.1049/htl.2013.0026.
- W. Hong, “Adaptive reversible data hiding method based on error energy con- trol and histogram shifting,” Optics Communications, 285(2), 101–108, 2012, doi:10.1016/j.optcom.2011.09.005.
- H. Yao, C. Qin, Z. Tang, Y. Tian, “Improved dual-image reversible data hiding method using the selection strategy of shiftable pixels’ coordi- nates with minimum distortion,” Signal Processing, 135, 26–35, 2017, doi:10.1016/j.sigpro.2016.12.029.
- S. Yi, Y. Zhou, “Binary-block embedding for reversible data hid- ing in encrypted images,” Signal Processing, 133, 40–51, 2017, doi:10.1016/j.sigpro.2016.10.017.
- S. Khan, N. Ahmad, M. Ismail, N. Minallah, T. Khan, “A secure true edge based 4 least significant bits steganography,” in 2015 Interna- tional Conference on Emerging Technologies (ICET), 1–4, IEEE, 2015, doi:10.1109/ICET.2015.7389227.
- G. Swain, “Adaptive pixel value differencing steganography using both vertical and horizontal edges,” Multimedia Tools and Applications, 75(21), 13541– 13556, 2016, doi:10.1007/s11042-015-2937-2.
- S. Sun, “A novel edge based image steganography with 2k correction and Huffman encoding,” Information Processing Letters, 116(2), 93–99, 2016, doi:10.1016/j.ipl.2015.09.016.
- C.-F. Lee, C.-Y. Weng, K.-C. Chen, “An efficient reversible data hiding with reduplicated exploiting modification direction using image interpolation and edge detection,” Multimedia Tools and Applications, 76(7), 9993–10016, 2017, doi:10.1007/s11042-016-3591-z.
- H.-W. Tseng, H.-S. Leng, “High-payload block-based data hiding scheme using hybrid edge detector with minimal distortion,” IET Image Processing, 8(11), 647–654, 2014, doi:10.1049/iet-ipr.2013.0584.
- S. Kumar, A. Singh, M. Kumar, “Information hiding with adaptive steganog- raphy based on novel fuzzy edge identification,” Defence Technology, 15(2), 162–169, 2019, doi:10.1016/j.dt.2018.08.003.
- C.-F. Lee, C.-C. Chang, X. Xie, K. Mao, R.-H. Shi, “An adaptive high-fidelity steganographic scheme using edge detection and hybrid hamming codes,” Dis- plays, 53, 30–39, 2018, doi:10.1016/j.displa.2018.06.001.
- S. K. Ghosal, A. Chatterjee, R. Sarkar, “Image steganography based on Kirsch edge detection,” Multimedia Systems, 27(1), 73–87, 2021, doi:10.1007/s00530- 020-00703-3.
- B. Vishnu, L. V. Namboothiri, S. R. Sajeesh, “Enhanced image steganography with PVD and edge detection,” in 2020 Fourth International Conference on Computing Methodologies and Communication (ICCMC), 827–832, IEEE, 2020, doi:10.1109/ICCMC48092.2020.ICCMC-000153.
- D. R. I. M. Setiadi, “Improved payload capacity in LSB image steganography
uses dilated hybrid edge detection,” 2022, doi:10.1016/j.jksuci.2019.12.007. - H. Sultana, A. Kamal, “Image Steganography System based on Hybrid Edge Detector,” in 2021 24th International Conference on Computer and Information Technology (ICCIT), 1–6, IEEE, 2021, doi:10.1109/ICCIT54785.2021.9689777.
- D. R. I. M. Setiadi, J. Jumanto, “An enhanced LSB-image steganography using the hybrid Canny-Sobel edge detection,” Cybernetics and Information Technologies, 18(2), 74–88, 2018, doi:10.2478/cait-2018-0029.
- K. M. Sagayam, A. A. Anton Jone, K. Cengiz, L. Rajesh, A. A. Elngar, “Breast Cancer Detection based on 3-D Mammography Images using Deep Learning Strategies,” Journal of Information Technology Management, 14(4), 2–18, 2022, doi:10.22059/JITM.2022.88132.
- P. Elayaraja, S. Kumarganesh, K. Martin Sagayam, H. Dang, M. Pomplun, “An efficient approach for detection and classification of cancer regions in cervi- cal images using optimization based CNN classification approach,” Journal of Intelligent & Fuzzy Systems, (Preprint), 1–11, 2022, doi:10.3233/JIFS-212871.
- R. Jayasingh, J. K. RJS, D. B. Telagathoti, K. M. Sagayam, S. Pramanik, O. P. Jena, S. K. Bandyopadhyay, “Speckle noise removal by SORAMA seg- mentation in Digital Image Processing to facilitate precise robotic surgery,” International Journal of Reliable and Quality E-Healthcare (IJRQEH), 11(1), 1–19, 2022, doi:10.4018/IJRQEH.295083.
- T. B. Mary, P. M. Bruntha, M. Manimekalai, K. M. Sagayam, H. Dang, et al., “Investigation of an Efficient Integrated Semantic Interactive Algorithm for Image Retrieval,” Pattern Recognition and Image Analysis, 31(4), 709–721, 2021, doi:10.1134/S1054661821040234.
- A. D. Andrushia, K. M. Sagayam, H. Dang, M. Pomplun, L. Quach, “Visual-Saliency-Based Abnormality Detection for MRI Brain Im- ages—Alzheimer’s Disease Analysis,” Applied Sciences, 11(19), 9199, 2021, doi:10.3390/app11199199.
- J. Andrew, T. Mhatesh, R. D. Sebastin, K. M. Sagayam, J. Eunice, M. Pomplun, H. Dang, “Super-resolution reconstruction of brain magnetic resonance images via lightweight autoencoder,” Informatics in Medicine Unlocked, 26, 100713, 2021, doi:10.1016/j.imu.2021.100713.
- J. A. Onesimu, J. Karthikeyan, D. S. J. Viswas, R. D. Sebastian, “Security and Privacy Challenges of Deep Learning: A Comprehensive Survey,” Research An- thology on Privatizing and Securing Data, 1258–1280, 2021, doi:10.4018/978- 1-7998-8954-0.ch059.
- J. A. Onesimu, J. Karthikeyan, Y. Sei, “An efficient clustering-based anonymization scheme for privacy-preserving data collection in IoT based healthcare services,” Peer-to-Peer Networking and Applications, 14(3), 1629–1649, 2021, doi:10.1007/s12083-021-01077-7.
- Y. Sei, J. Andrew, H. Okumura, A. Ohsuga, “Privacy-Preserving Collaborative Data Collection and Analysis with Many Missing Values,” IEEE Transactions on Dependable and Secure Computing, 2022, doi:10.1109/TDSC.2022.3174887.
- A. Jan, S. A. Parah, M. Hassan, B. A. Malik, “Realization of Efficient Stegano- graphic Scheme Using Hybrid Edge Detection and Chaos,” Arabian Journal
for Science and Engineering, 1–14, 2022, doi:10.1007/s13369-022-06960-w.