Analysis and Trend Estimation of Rainfall and Seasonality Index for Marathwada Region

Adv. Sci. Technol. Eng. Syst. J. 8(1), 30–37 (2023);
 DOI: 10.25046/aj080104
Droughts are undesirable and highly unwanted form of disasters. It is essential to analyse the cause of such extreme events and act accordingly to pave the way for a sustainable future. The present research work conducts a seasonality and trend analysis of rainfall over the eight districts of Marathwada region. The study is carried out for the last 39 years ranging from 1980 to 2018. The rainfall data pertaining to pre-monsoon season, monsoon season (Kharif), and annual average have been analysed. The trend has been estimated using Sen’s slope estimation process along with Mann-Kendal test. It was determined that the all the eight districts of the region show a negative trend in the annual rainfall received. Nanded district showed the largest negative trend in the annual rainfall. Out of eight districts seven districts of the region show a decline in rainfall during the monsoon season. The district of Nanded showed largest decline in the rainfall received during monsoon season. The research work presents the discussion on possible causes of such trends estimated. The research creates a robust foundation of advanced computation techniques for prediction of droughts.
1. Introduction
Melting of glaciers, frequent droughts, and increase in regional temperature are some of the climatic changes that are expected to affect the agricultural scenario of the world [1]. Due to these adverse climate changes, it has been predicted by the intergovernmental panel on climate change (IPCC) that these unfavourable events may lead to scarcity of drinking water and water resources [2]. As per the panel this scarcity of water resource might led to drop in per capita freshwater availability. The effect of this drop would be visible by 2025.
Many researchers in the past have indicated that the change in climatic conditions will bring both scarcities of precipitation and increased intensity of precipitation [3-5]. The increased intensity of precipitation will result in intense flooding, flash flooding, and higher run-off during the monsoon. As the run-off will increase the lesser precipitation will percolate. The ground which is bound to negatively affect the ground water recharge will subsequently result in falling of water table and lower volume of water available for anthropometric activities [6]. Prediction of scarcity of water along with prediction of increased intensity of precipitation indicates that climate change will affect the precipitation at both local and regional scales.
The research presented in [7] indicated in their research work that in Asia-Pacific region the agricultural activities are highly dependent on ground water and monsoon. Thus, depleting water table and less precipitation will adversely affect the cropping system in the region. As the cropping system will be affected it will lay an effect on yield productivity and the net area sown under the principal crops in the region [8].
IPCC has also predicted the probability that the global surface temperature might increase by 5.8oC by the end of year 2021 [2]. Many researchers in the past have worked upon the sensitivity of the crops to the surface temperature [9,10]. The study in [11] focused on accessing the probable impact of temperature rise on the production of wheat in India. They determined through mathematical modelling that a 1oC rise in temperature is sufficient to drastically reduce the production of wheat.
Study of rainfall variation in India is of special interest to researchers for a long time [12]. The research in [13] focused on studying the variations of climatic parameters in different regions of India even before the subject of climate change was prominent. The special interest in studying the rainfall variations comes from the fact that Indian agriculture is entirely dependent on rainfall. If the states of Punjab and Haryana is not considered no state in India has a proper network of canals and channels that can supply water for irrigation to the farmers. Due to unavailability of irrigation infrastructure the farmers in India are dependent on monsoon. If the monsoon performs poorly in any year, the production of Kharif crops gets affected drastically. It is due to these monsoon dependent characteristics of Indian agriculture; it is called ‘Gamble on Rains’.
The research in [14] focused on determining the rainfall trend in the North Eastern states of India. They focused on determining the trend present in the North Eastern states because these states suffer due to scarce as well as heavy rainfall [15]. The study in [16] concluded that due to inadequacy of the irrigation system a decreased rainfall results in poor agricultural production while an increased rainfall always poses a certain danger of flooding due to Brahmaputra breaking its banks. Researchers in the past also indicated that monsoon presents a decreasing trend in the states of Chhattisgarh, Jharkhand, and Kerala [17]. In recent years, the monsoon in India is weakened by the El Nino Southern Oscillations (ENSO) especially in the year 2009, 2015, and 2017 [18]. The ENSO negatively affects the monsoon over India. This negative effect causes less than normal rainfall during phases of El Nino.
The Marathwada region of Maharashtra is a drought prone area [19]. Latur and Osmanabad districts of the region are some of the worst affected regions of the country [14,20]. In 2016, numerous full capacity trains only with water wagons were ferried to Latur to meet the water scarcity of the district [10]. The year of 2016 was not the first time a Latur district from Marathwada region, has suffered from severe water shortages in. Latur has faced droughts in 1980s as well in 1990 [21]. However, the event of scarcity of water in April 2016 was an extreme event. The time of the study is selected from 1980 because the region has shown more susceptibility for getting affected by the drought since then. The research work thus, tries to determine and evaluate the trend present in the rainfall received by the districts of Marathwada region through a time-series analysis for the years 1980-2018.
2. Research Method
The region selected for the study is Marathwada as shown in Figure 1. The Marathwada region is a group of districts located in south western region of state of Maharashtra. The region is comprised of districts namely Beed, Latur, Parbhani, Hingoli, Jalna, Aurangabad, Osmananbad, and Nanded. The region lies near to the northern ranges of western Ghant. The location of the study region has been shown in the map. The region was earlier known for its sugarcane and cotton production. However, the region has started to witness increased frequency of below normal rainfall during monsoon which has reduced the sugarcane cultivation in the region. Further, the area becomes area of interest for the study because the district of Latur recently faced one of the worst water crises in history of Independent India [20].
3. Data
The present study is based on data recorded at 8 stations in the Marathwada region. The period of the data is from 1980 to 2018 (Last 39 years). The data was procured from the India Meteorological Department (IMD). The rainfall data used in this research work was recorded in the stations in the form of direct observation and was subjected to standard normal homogeneity test for homogenization. The data contained no missing values. The trend in the rainfall in the selected districts was estimated on an annual, pre-monsoon, and Kharif season (main sowing season in India that begins in June. The season begins with advent of South West Monsoon making a landfall at Kerala). The pre monsoon months were selected as March, April, and May. The Kharif season was selected as June-July-August, and September.
4. Analysis
For the study seasonality index (SI), standard deviation (SD), coefficient of variance (CV), Sen Slope and Mann-Kendall test were utilized. The seasonality index helps in determination of contrast in the rainfall regime. This process is done by utilization of rainfall monthly distribution data. In other words, the seasonality index helps in identification of monthly rainfall variability [22]. The seasonality is a function of mean of monthly rainfall and mean annual rainfall. The seasonality index is computed as:
![]()
where, Xn is the rainfall calculated for the nth month. A is the total annual rainfall. Theoretical variations in the seasonality index can be from 0 to 1.83. If all the months in a year records equal rainfall, than the SI becomes zero. If all the rainfall occurs in one month than the SI becomes 1.83 [23]. The SI also suggests changes in rainfall pattern [24]. The rainfall regimes associated with the different values of the seasonality index has been shown in the table 1.
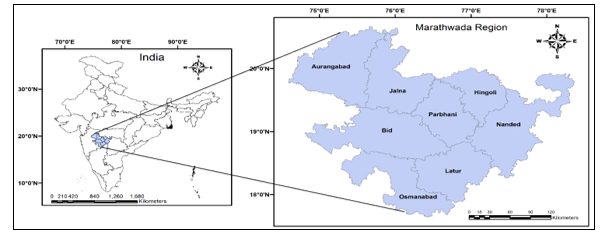
Figure 1: Study Area: Marathwada region
Table 1: Rainfall regimes and associated SI (Walsh & Lawer, 1981)
| Regimes | Seasonality Index (SI) |
| Very Equable | Less than or equals 0.19 |
| Equable, but with a definite wetter season | 0.20-0.39 |
| Rather Seasonal with short drier season | 0.40-0.59 |
| Seasonal | 0.60-0.79 |
| Marked Seasonal with long drier season | 0.80-0.99 |
| Mostly rain in 3 months or less | 1.00-1.19 |
| Extreme, almost rain in 1 to 3 months | Greater than or equals 1.20 |
Along with the identification of rainfall regime, SI indicates towards soil and vegetation characteristics along with hydrological stress in the region. Rainfall trend analysis can be performed by using different available parametric and non-parametric methods [25]. These analyses are in general meant to analyse the trend present in long term dataset. However, these techniques are also used to determine trend in short-term data series [26]. These short-term data series can be truncated to ten data points. The restriction associated with the use of parametric test in the trend determination is that the data points in the time series should follow a distribution. Non-parametric tests do not pose such restrictions and are minimally affected by any outliers present in the dataset. In the present work the trend present in the rainfall data was analysed using Mann-Kendal test and the Sen-slope estimates. The slope estimates were determined using Sen-slope estimation process. The Mann-Kendall tests are widely utilized for determination of trends which are monotonous in nature in the non-cyclic data sets [27]. The wide popularity in determining the trend present in the rainfall data using Mann-Kendall test is due to because Mann-Kendal test does not require a particular distribution. Another important characteristic of Mann-Kendal test is that it is least sensitive towards in homogeneity present in the time series [28]. The time series is thus assumed to obey the following model.
![]()
where, f(t)is the monotonic decreasing or increasing function of time; the residual is represented by et. It is also assumed further that the variance of the distribution is constant in time. Further, it is also assumed that the autocorrelation in the data set is zero [29].
The estimate of slope which is denoted by Q is calculated by the following process [30].
Firstly, the slope between all pairs of data values is determined. The procedure for the same is as follows.
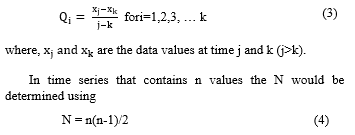
Where, N is the no of iterations and T is total observations.
The N values are arranged in ascending order before the application of T in the equation presented below. Estimator of Sen’s slope is representative of the median of these N values of Qi
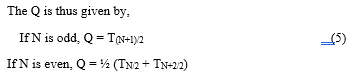
Normal distribution is applied for determination of two-sided confidence interval related to the estimation of the slope. In the dataset of the time series the downward or the decreasing trend is indicated by the negative value of Q, while an upward or increasing trend is determined by positive value of Q. The Mann-Kendal test null hypothesis assures that the data series had normal distribution. A significance level of 0.001 has been used for the testing-module. These characteristics correlate to the fact that a probability of 0.01% exists for the randomness in the time series data. Similarly, if the significance level is kept as 0.05 then it is assumed that there exists a 5% of probability that the values of the time series are from random distribution. The Mann-Kendall test statistics S is determined using the formula [31].
The number of data points in the time series under consideration is denoted by n and , xj are the rainfall sum in the year j and k respectively. Here, the jth value is greater than the kth value. The present work fixes the significance level as 0.05 for the test. Since the number of data points would be greater than10 the distribution of S was approximated using a normal distribution. The estimation of trend line was done using linear regression method [32]. In this research work slopes that are of significant nature at significance level of 5% has been marked with*. Slopes that are not of significant nature are not marked with any sign in the result tables.
5. Results
The results of the present study are as follows:
5.1. Seasonality Index
The results of the seasonality index (SI) have been presented in the table 2. The SI reveals that Beed, Latur and Osmanabad face frequent long drier season (SI ranging between 0.8 – 0.99, are marked by red colour cells). In these districts the long drier season occurred for 11, 13 and 9 times respectively in 39 years. Parbhani, Hingoli, Jalna, Aurangabad, and Nanded also face long drier season but in these districts the occurrence of long drier season is less as compared to the rest of three districts. The district of Nanded faced least number of long drier seasons in last 39 years. The SI in the Nanded district for most of the years is greater than 1 which indicates that the district receives rains in almost three months or less. The district of Latur faced two consecutive long drier seasons in last 39 years. The first occurred from 1985 to 1987 and the second occurred from 2013 to 2015. Further, the district of Latur faced long drier season in alternate years from 1987 to 1992 and from 2002 to 2006.
Table 2: Seasonality Index for the last 39 years for Districts of Marathwada Region
| Year | Beed | Parbhani | Hingoli | Latur | Jalna | Aurangabad | Osmanabad | Nanded |
| 1980 | 1.21 | 1.07 | 1.3 | 1.19 | 1.25 | 1.24 | 1.25 | 1.24 |
| 1981 | 0.85 | 1.15 | 1.03 | 1.02 | 1.24 | 0.9 | 0.94 | 1.16 |
| 1982 | 1.05 | 1.06 | 0.94 | 1.04 | 0.9 | 0.92 | 0.95 | 1.05 |
| 1983 | 1.17 | 1.04 | 1.19 | 1.15 | 0.92 | 1.24 | 1.12 | 1.17 |
| 1984 | 1.11 | 1.04 | 1.11 | 1.07 | 1.24 | 1.1 | 1.11 | 1.09 |
| 1985 | 1.09 | 1.09 | 1.07 | 0.97 | 1.1 | 1.15 | 1.05 | 1.03 |
| 1986 | 1.1 | 1.28 | 1.14 | 0.87 | 1.15 | 1.22 | 1.11 | 1.07 |
| 1987 | 0.99 | 1.18 | 1.12 | 0.92 | 1.22 | 1.05 | 0.94 | 1.03 |
| 1988 | 1.26 | 0.98 | 1.24 | 1.27 | 1.05 | 1.09 | 1.19 | 1.16 |
| 1989 | 1.14 | 1.39 | 1.2 | 1.11 | 1.09 | 1.2 | 1.08 | 1.22 |
| 1990 | 0.98 | 1.06 | 1.03 | 0.97 | 1.2 | 0.95 | 0.92 | 0.97 |
| 1991 | 1.27 | 0.95 | 1.38 | 1.12 | 0.95 | 1.33 | 1.09 | 1.25 |
| 1992 | 1.14 | 1.03 | 1.11 | 0.97 | 1.33 | 1.15 | 1.01 | 1.13 |
| 1993 | 0.95 | 0.86 | 1 | 1.04 | 1.15 | 1.01 | 1 | 1.05 |
| 1994 | 0.88 | 1.24 | 1.16 | 1.05 | 1.01 | 0.92 | 1.02 | 1.11 |
| 1995 | 0.93 | 0.78 | 0.94 | 0.92 | 0.92 | 1.1 | 0.9 | 1.02 |
| 1996 | 1.17 | 1.08 | 1.2 | 1.14 | 1.1 | 1.12 | 1.1 | 1.16 |
| 1997 | 0.75 | 1.13 | 0.91 | 0.71 | 1.12 | 0.87 | 0.76 | 0.78 |
| 1998 | 1.1 | 1.31 | 1.04 | 1.06 | 0.87 | 1.07 | 1.12 | 1.08 |
| 1999 | 1.05 | 1.2 | 1.14 | 0.95 | 1.07 | 1.09 | 1 | 1.13 |
| 2000 | 1.2 | 1.17 | 1.37 | 1.13 | 1.09 | 1.12 | 1.11 | 1.2 |
| 2001 | 1.2 | 1.23 | 1.23 | 1.14 | 1.12 | 1.13 | 1.17 | 1.2 |
| 2002 | 1.14 | 1 | 1.26 | 0.94 | 1.13 | 1.17 | 1 | 1.25 |
| 2003 | 1.06 | 1.13 | 1.25 | 1.18 | 1.17 | 1.04 | 1.01 | 1.18 |
| 2004 | 0.89 | 1.13 | 1.07 | 0.89 | 1.04 | 1.12 | 0.83 | 1.01 |
| 2005 | 1.16 | 1.31 | 1.12 | 1.09 | 1.12 | 1.2 | 1.16 | 1.11 |
| 2006 | 0.95 | 1.21 | 1.17 | 0.96 | 1.2 | 1.11 | 1 | 1.19 |
| 2007 | 1.28 | 0.91 | 1.31 | 1.26 | 1.11 | 1.22 | 1.15 | 1.23 |
| 2008 | 1.05 | 1.14 | 1.24 | 1.13 | 1.22 | 1.24 | 1.14 | 1.22 |
| 2009 | 0.84 | 1.23 | 0.89 | 1.02 | 1.24 | 1.05 | 0.92 | 1.05 |
| 2010 | 1.05 | 1.17 | 1.12 | 1 | 1.05 | 0.94 | 1.01 | 1.07 |
| 2011 | 1.18 | 1.02 | 1.28 | 1.3 | 0.94 | 1.25 | 1.15 | 1.26 |
| 2012 | 1.15 | 0.98 | 1.17 | 1.16 | 1.25 | 1.17 | 1.13 | 1.15 |
| 2013 | 1.01 | 0.99 | 1.07 | 0.96 | 1.17 | 1.09 | 1.01 | 1.01 |
| 2014 | 0.9 | 1.13 | 1.1 | 0.85 | 1.09 | 0.91 | 0.79 | 1.08 |
| 2015 | 0.87 | 1.16 | 1.01 | 0.81 | 0.91 | 1.05 | 0.82 | 0.87 |
| 2016 | 1.12 | 1.27 | 1.12 | 1.07 | 1.05 | 1.2 | 1.09 | 1.09 |
| 2017 | 1.14 | 1.2 | 1.15 | 1.1 | 1.2 | 1.15 | 1.1 | 1.1 |
| 2018 | 1.18 | 1.11 | 1.33 | 1.05 | 1.15 | 1.23 | 0.95 | 1.19 |
5.2 Rainfall Trend
The trend in the annual rainfall for the various district of Marathwada regions has been shown in the Table 3.
Table 3: Annual Rainfall Trend Analysis for the last 39 Years (1980-2018)
| District | Mean (mm) | Standard Deviation (mm) | Sen’s Slope (mm/year) | Mann Kendall (mm/year) |
| Beed | 745.33 | 187.45 | -1.962 | -0.75 |
| Parbhani | 872.20 | 246.12 | -6.090 | -1.62 |
| Hingoli | 903.80 | 250.53 | -4.771 | -1.28 |
| Latur | 814.83 | 210.11 | -0.460 | -0.12 |
| Jalna | 747.47 | 167.87 | -1.703 | -0.53 |
| Aurangabad | 680.276 | 156.01 | -1.787 | -0.70 |
| Osmanabad | 737.724 | 193.05 | 0.021 | 0.00 |
| Nanded | 985.91 | 311.88 | -5.60* | -1.65 |
*Statistically significant at 5%, Significance tested using MK Test.
The mean rainfall in the Beed district was observed as 745.33 mm from 1980 to 2018. The annual rainfall in Beed district years shows a negative trend for the last 39 in the annual rainfall. The Sen’s slope determined for the annual rainfall received by the district in the last 39 years is -1.962 mm/Year. The mean rainfall in the Parbhani district was observed as 872.20 mm from 1980 to 2018. The annual rainfall of Parbhani for the last 39 years shows a negative trend. The Sen’s slope determined for the annual rainfall received by the district in the last 39 years is -6.090 mm/Year. The mean rainfall in the country’s one of most severely and frequently drought affected district Latur was observed as 814.83 mm from 1980 to 2018. The annual rainfall trend in Latur district shows a negative trend for the last 39 years. The Sen’s slope determined for the annual rainfall received by the district in the last 39 years is -4.771 mm/Year. The mean rainfall in the Nanded district was observed as 985.91 mm from 1980 to 2018. Out of the 8 selected districts. Nanded received highest mean annual rainfall during the last 39 years. The annual rainfall in Nanded district for the last 39 years shows a negative trend. The Sen’s slope determined for the annual rainfall received by the district in the last 39 years is -5.60 mm/Year which was statistically significant negative trend.
The pre-monsoon season holds special importance in the Marathwada region known for its water intensive crops such as sugarcane [33]. Industries in and around the Marathwada region are also known to use water intensively. These industries include the sugar mills and the cotton dying industries. Real-estate activities are also on the rise in the region [34]. Traditional construction approach adopted in the region requires excessive use of water for curing of concrete and the wall plaster. The demand for the sugarcane increases in summer season due to fresh juice stalls and sugar mills boost their production to stock the sugar for the upcoming festive seasons [35].
Farmers use excessive water in the fields during pre-monsoon season in order to increase the brix content of the crop and inter nodal gap in sugarcane [4]. Farmers in the region typically use drenching method of irrigation which also accounts for loss of precious water reserves [36]. Such anthropogenic activities require intense water and may pose a certain threat to the water availability in this already drought susceptible region of the Maharashtra state. From table 4, it is evident that Pre-monsoon rainfall trend is positive for all the 8 districts under consideration. The districts of Jalna and Aurangabad show a positive trend in the pre-monsoon rainfall, but the trend determined is minuscule. Largest positive trend in the pre-monsoon rainfall was observed for the Osmanabad district. The increasing positive trend is beneficial for the water intensive crops sown in the district.
Table 4: Pre-monsoon Rainfall Trend Analysis of last 39 Years (1980-2018)
| District | Mean (mm) | Standard Deviation (mm) | Sen’s Slope (mm/yr) | Mann Kendall (mm/yr) |
| Beed | 31.86 | 29.81 | 0.295 | 0.69 |
| Parbhani | 27.67 | 28.30 | 0.192 | 0.77 |
| Hingoli | 22.02 | 24.33 | 0.108 | 0.31 |
| Latur | 43.82 | 33.28 | 0.393 | 0.95 |
| Jalna | 20.76 | 24.23 | 0.017 | 0.08 |
| Aurangabad | 16.55 | 23.58 | 0.049 | 0.55 |
| Osmanabad | 36.92 | 29.72 | 0.485 | 1.63 |
| Nanded | 29.82 | 31.34 | 0.254 | 1.27 |
However, the positive trend determined for the pre-monsoon rainfall in the districts was not statistically significant.
The monsoon season is the time to sow the Kharif crops. Kharif crops are known to be water intensive. Farmers in the region have a strong affinity for the sowing water intensive crops in the region. Scarcity of water in the germination and early development stage results in osmotic stress [37]. Such stress exploits the growth of the crop. Farmers are known to sow crops like cotton and groundnut in the early monsoon season. Water intensive crops like sugarcane are sown in the middle of the monsoon season so that the crop can be harvested by March to May [38]. Therefore, good monsoon is essential for the Marathwada region from agricultural perspective. Table 5 depicts that the highest mean rainfall in the monsoon season was received by Nanded district. The district of Aurangabad and Osmanabad received mean rainfall of 557.71 mm and 571.12 mm, respectively. Latur which is one of the drought susceptible districts of the country received a mean rainfall of 656.82 mm in the monsoon season. Sen’s slope estimate shows the negative trend in the rainfall received by the districts during monsoon.
The district of Beed shows a negative trend of -0.956 mm/Year. The district of Parbhani shows a negative trend of -2.809 mm/Year. The district of Nanded shows the highest negative trend of -3.996 mm/Year followed by the district of Hingoli which shows a negative trend of -3.154 mm/Year. Only the district of Latur shows a positive trend of 0.458 mm/Year for the rainfall received in monsoon season. The negative trend in seven out of eight districts of region is bad from the perspective of sugarcane producers of the region. Figure 2 shows the trend obtained for the rainfall received by the districts in the monsoon season.
Table 5: Kharif Rainfall Trend Analysis of last 39 Years (1980-2018)
| District | Mean (mm) | Standard Deviation (mm) | Sen’s Slope (mm/yr) | Mann Kendall (mm/yr) |
| Beed | 609.66 | 179.318 | -0.956 | -0.34 |
| Parbhani | 744.89 | 229.24 | -2.809 | -0.77 |
| Hingoli | 792.54 | 227.45 | -3.154 | -0.90 |
| Latur | 656.82 | 191.40 | 0.458 | 0.19 |
| Jalna | 620.59 | 152.30 | -1.385 | -0.60 |
| Aurangabad | 557.71 | 131.31 | -1.669 | -0.68 |
| Osmanabad | 571.12 | 167.68 | -0.266 | -0.05 |
| Nanded | 836.07 | 274.27 | -3.996 | -1.23 |
From the analysis of annual and monsoon rainfall received by the districts it is evident that the scarcity of the rainfall in the region is on the rise. Seven districts of region showed a negative trend in the annual rainfall received while seven out of eight districts of the region showed a negative trend in the rainfall received in the monsoon season.
6. Discussion
The Thar Desert and adjoining areas of central and northern subcontinents heat up during the summers. This creates a void. To fill up the void the air from the Indian ocean rush into the mainland. The air is laden with moisture picked up from the ocean surface. The Himalayas regulates the air-flow and prevent its influx into the central Asia. As the wind rises, precipitation occurs and India receives rainfall [39]. This rainfall season is also known as the Southwest (SW) monsoon. Marathwada region of Maharashtra state receives the SW monsoon. The period of SW monsoon starts from June and ends in early to mid of October. The SW monsoon is considered as the principal rainy season in India. Nearly, the whole country receives rainfall during this period. The Southwest monsoon accounts for nearly 75% of rainfall in the country and thus agrarian activities are dependent on it [40].
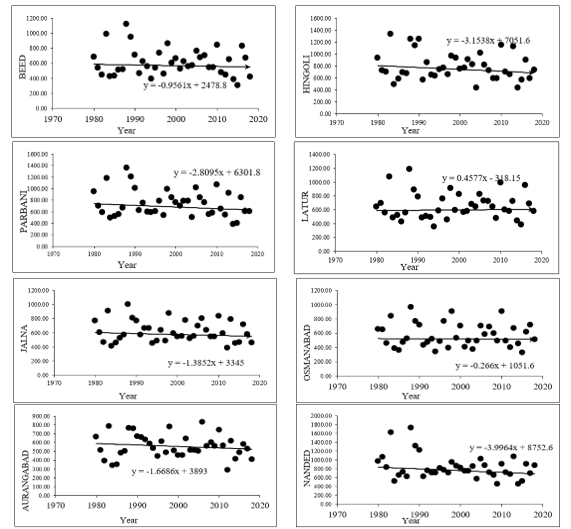
Figure 2: Monsoon rainfall trend from 1980 to 2018 for districts of Marathwada
The SW monsoon is important from India’s agricultural perspective. India does not possess any significant irrigation network. Only the states of Punjab and Haryana have proper irrigation infrastructure in place [41,42] Agriculture of rest of the country either survives on monsoon or depends upon the ground water source [43]. It is due to this high dependency on the monsoon, Indian agriculture is often referred as gamble on rains [44].
The characteristics of Indian agriculture is such that the farmers’ despite being heavily dependent on rains sow water intensive crops on large scale in the Kharif season (monsoon). Such crops are Paddy and sugarcane. Paddy is prominently grown in the central and eastern regions of India such as Chhattisgarh and West Bengal while Sugarcane is a prominent Kharif crop of Maharashtra which belongs to western region of India. These crops are sensitive to climate change as it causes rise in temperature, and water scarcity [6]. These effects along with ENSO bring in uncertainty over the amount of rainfall [45]. Thus, climate change poses a certain threat to the Indian agriculture.
From the analysis, it is evident that amount of rainfall in the districts of Marathwada is decreasing. Declining trend was determined for the annual rainfall in all the districts. Farmers in the region are known to produce sugarcane. The sugarcane demands for extensive irrigation for increased brix content, grass weight, and larger node to node distance. With the decreasing rainfall in the region, the farmers are facing a loss in the production. The average productivity of sugarcane crop in the Marathwada region is 50 tonnes per acre while the average productivity of the crop in the state of Maharashtra is 80 tonnes per acre [46]. Thus, it can be concluded that decline in the rainfall in monsoon season (Kharif) is projecting its effect on the productivity of the crop in the region. Absence of irrigation infrastructure in the region results in utilization of ground water by the farmers for the irrigation purposes. This activity further adds up to the woes of the farmers itself. With decline in rainfall the percolation of water during the rainy season also declines which restricts the recharge of the water table [47].
Utilization of ground water in such cases only degrades the water table. Farmers who are not sowing sugarcane are also facing the effects of decreased rainfall. In recent years farmers of the Latur district had to re-sow their crops because of the long drier season [48].
It is being observed that along with annual rainfall the monsoon rainfall is also depicting a negative trend. The trends are huge for districts like Hingoli, Parbhani, and Nanded. Latur and Osmanabad are the districts that are already receiving less amount of rainfall. In such cases, when the amount of rainfall received is declining the farmers should shift from the sugarcane crop to less water intensive crops. Agriculture activity of such crops is an anthropogenic activity that is adding to water crisis of the region. The seasonality index indicates that Latur frequently faces long drier seasons.
The inferior quality of soil in the Udgir, Ausa and Ahmedpur taluka of the Latur district becomes hard during the long drier seasons which along with steep terrain of the region restrict the percolation of water during the rainy season thus further restricting the ground water recharge. Agriculture is not the only anthropogenic activity that are creating water crisis in the region. Jhum style or the shifting style of agriculture is also prominent in the region. Illegal encroachment of forest land is common in the region. The land is cleared by burning the vegetation present [1]. The burning of vegetation leads compressed temperature difference between the land and the Indian Ocean [49]. This reduction in the temperature between land and sea restricts the draft of air from the ocean that further decreases the rainfall amount. Sugarcane crop not sold to the sugar mills is crushed down in makeshift factories to produce Jaggery and country liquor.
The bagasse is used as a bio-fuel for production of heat needed for making jaggery and liquor. The burning of such bio-fuels is a prominent activity in the region [50]. Although bagasse is low in sulphur content but burning it on a large scale releases ample amount of sulphur dioxide, greenhouse gases and nitrogen oxides into the atmosphere [51]. These emissions further reduce the difference between land and ocean temperature and thus acts as a weakening force for the monsoon system. The warming of Indian Ocean is also leading to rainfall woes in India. The warming of Indian Ocean is leading to decrease the difference between ocean and land temperature. This further reduces the rainfall received by the region. Warming of Indian ocean also results in the occurrence of extreme events [52].
The extreme rainfall event in the districts of Latur and Nanded has been credited to the warming of Indian Ocean [53]. Occurrence of such extreme rainfall events in the backdrop of reducing monsoon might lead to sequence of catastrophic events such as loss of livestock, poverty, and agrarian crisis.
7. Conclusion and Future Scope
Drought is an extreme event which has exponentially grown in numbers affecting countless lives and resources’ availability. The prominent challenge is experienced by Suryaputra countries falling under International Solar Alliance like India, Brazil, Australia and South Africa. This creates an alarming issue for a necessity of studies that can assist in eradicating such treacherous events. The region of Marathwada has been a pivotal region prone to such events. All the districts of the Marathwada region of the Maharashtra state are witness a decline in the annual rainfall. The decline in the annual rainfall was largest for the Nanded and Parbhani district. The decline of the annual rainfall in the Nanded district was found to be statistically significant. Out of eight districts seven districts of the region have witnessed a decline in the monsoon rainfall over the last 39 years.
The seasonality index calculated indicates that Latur, Beed, and Osmanabad are the drier districts of the region which receives rainfall in more than 3 months. The negative rainfall trend observed might pose a threat to the highly monsoon dependent agriculture of the region. The farmers of the region therefore should migrate from sowing water intensive crops to less water intensive crops such as Sorghum and pearl millet. Sugarcane can also be replaced with less water intensive mandarin which is a less water intensive cash crop. In cases where the farmers are not able to shift to other crops irrigation management system such as irrigation through drip irrigation and rain pipes should be implemented. If negative trend in the rainfall is not effectively managed through change and control of anthropogenic activities the region of Marathwada might enter advanced phases of agrarian crisis which might also lead to the collapse of the agriculture system of the districts comprising it.
The study presented rainfall and seasonality trends which portrayed the topographical and climatic conditions of the districts of Marathwada region. Based on the analysed dataset of 39 years, it can very well be inferred that a spatial time-series analysis yields fruitful information regarding the aspects, characteristics and trend analysis which acts as dominant prerequisites for advanced computation techniques to be deployed for analysis and prediction of droughts in the upcoming years.
- K. Gabhiye, C. Mandal, Agro-Ecological Zones, their Soil Resource and Cropping Systems. Nagpur: National Bureau of Soil Survey and Land use Planning, 2000.
- IPCC, The physical science basis. The contribution of Working Group I to the Fourth Assessment Report of the Intergovernmental Panel on Climate Change. New York: Cambridge University Press, 2007.
- M. Dore, “Climate Change and Changes in global precipitation” Environmental International, 31, 1167-1181, 2005.
- S. Manwar, P. Vadiya, “Characterization and classification of sugarcane growin soils of Latur district”, Annals of Plant and Soil Research, 17(5), 373-377, 2015.
- A, Saini, N. Sahu, P. Kumar, S. Nayak, W. Duan, R. Avtar, S. Behera, “Advanced Rainfall Trend Analysis of 117 Years over West Coast Plain and Hill Agro-Climatic Region of India”, Atmosphere, 11(11), 1225, 2020, 10.3390/atmos11111225.
- D.Y. Gumel, A.M. Abdullah, A.M. Sood, R.E. Elhadi, M.A. Jamalani, K.A.A.B. Youssef, “Assessing Paddy Rice Yield Sensitivity to Temperature and Rainfall Variability in Peninsular Malaysia Using DSSAT Model”. International Journal of Applied Environmental Sciences, 12(8), 1521-1545, 2017.
- M. Parry, O. Canziani, J. Palutikof, P.V.D. Linden, C. Hanson, Aia Climate Change 2007: Impacts, adaptation and vulnerability. In : Fourth Assessment report of the intergovernmental panel on climae change. Cambridge: Cambridge University Press, 2007.
- A. Saini, N. Sahu, W. Duan, M. Kumar, R. Avtar, M. Mishra, S. Behera, “Unraveling Intricacies of Monsoon Attributes in Homogenous Monsoon Regions of India”, Frontiers in Earth Science, 10, 1–17, 2022, 10.3389/feart.2022. 794634.
- M.A. Semenov, “Impacts of Climate Change on Wheat in England and Wales”, Journal of the Royal Society Interface, 6, 2008, 343-350. doi:10.1098/rsif.2008.0285
- S. Osmani, P. Patil, “Drought response and relief by Jaldoot Express: A case study of Latur drought”, Zenith IJMR, 9(6), 224-236, 2019.
- A. Kumar, A. Singh, “Climate Change and its Impact on Wheat Production and Mitigation through Agroforestry Technologies”, International Journal of Environmental Sceinces, 5(1), 73-90, 2014.
- O. Dhar, B. Parthasarathy, “Trend analysis of annual Indian rainfall”, Hydrological Science, 26, 257-260, 1975.
- K. Krishnamurthi, Y. Ramanathan, “Sensitivity of the monsoon onset to differential heating”, Journal of atmospherc science, 39, 1290-1306, 1982.
- D. Duhan, A. Pandey, “Statistical analysis of long term spatial and temporal trends of precipitaton during 1901-2002 at Madhya Pradesh”, Atmospheric Research, 122, 136-149, 2013.
- V. Kumar, S.K. Jain, Y. Singh, “Analysis of long-term rainfall trends in India”, Hydrological Sciences Journal, 55(4), 484–496, 2010, doi:10.1080/02626667.2010.481373.
- A. Gupta, “Flood and Floodplain management in North East India: An Ecological Perspective”, 1st International Conference on Hydrology and Water Resources in Asia Pacific Region, Kyoto: Hydrology and Water Resources, 1-10, 2003.
- S. Swain, M.K. Verma, M. Verma, “Analysis of Change in Annual Rainfall for Raipur district”, IJERT, 3(20), 1-10, 2015.
- I. Roy, R.G. Tedeschi, M. Collins, “ENSO teleconnections to the Indian summer monsoon under changing climate”, International journal of climatology, 39(6), 3031-3042, 2019.
- A. Kulkarni, S. Gadgil, S. Patwardhan, “Monsoon variability, the 2015 Marathwada drought and rainfed agriculture”. Current Science, 111(7), 1182-1193, 2016.
- SANDRP, Latur Drinking Water Crisis highlights absence of Water Allocation Policy and Management, Retrieved from South Asia Network on Dams, Rivers and People, 2016 https://sandrp.in/2016/04/20/latur-drinking-water-crisis-highlights-absence-of-water-allocation-policy-and-management/
- D. Kolekar, V. Vanama, Satellite based Drought Assessment Over Latur, India Using Soil Moisture Derived From SMOS. ISPRS TC V Mid-term Symposium, Geospatial Technology – Pixel to People. Dehradun: ISPRA, 2018, doi:10.5194/isprs-archives-XLII-5-421-2018.
- E. Kanellopoulou, “Spatial distribution of rainfall seasonality in Greece”, Weather, 57, 215-219, 2002.
- S. Ingle, S. Patil, N. Mahale, Y. Mahajan, “Analyzing rainfall seasonality and sNorth Maharashtra”, Environmental Earth Sciences, 77, 651-662, 2018.
- R. Walsh, D. Lawer, “Rainfall seasonality: description, spatial patterns and change through time”, Weather, 36, 201-208, 1981.
- R. Yadav, S. Tripathi, G. Pranuthi, S. Dubey, “Trend analysis by Mann-Kendall test for precipitation and temperature for thirteen districts of Uttarakhand”, Journal of agrometeorology, 16(2), 164-171, 2014.
- I. Ahmad, D. Tang, T, Wang, M, Wang, B, Wagan, “Precipitation Trends over Time Using Mann-Kendall and Spearman’s rho Tests in Swat River Basin”, Advances in meteorology, 2015, 1-15, 2015, doi:10.1155/2015/431860
- H. Tabari, S. Marofi, M. Ahmadi, “Long-term variations of water quality parameters in the Maroon river”, Environmental monitoring assess, 177, 273-287, 2011.
- N. Karmeshu, Trend Detection in Annual Temperature & Precipitation using the Mann Kendall Test – A Case Study to Assess Climate Change on Select States in the Northeastern United States. Pennsylvania, 2012.
- S. Yue, P. Pilon, B. Phinney, G. Cavadias, “The influence of autocorrelation on the ability to detect trend in hydrological series”, Hydrological processes, 16(9), 1807-1829, 2002.
- S. Shahid, “Trends in the extreme rainfall events in Bangladesh”, Theoretical Application of Climatology, 104, 489-499, 2011.
- R. Gilbert, Statistical methods for environmental pollution monitoring. New York: Van Nostrand Reinhold, 1987.
- F. Wang, W. Shao, H. Yu, G. Wang, X. He, D. Zhang, G. Kan, “Re-evaluation of the Power of the Mann-Kendall Test for Detecting Monotonic Trends in Hydrometeorological Time Series”, Frontiers in Earth Science, 8, 1-12, 2020, doi:10.3389/feart.2020.00014
- GWP, Droughts and Sugar Industry in Maharashtra – Are We Learning from History? New Delh: Global Water Partnership, 2016.
- S. Sandbhor, “Analysis of Behaviour of Real Estate Rates in India-A Case Study of Pune City”, International Journal of Economics and Management Engineering, 7(8), 2465-2570, 2013.
- R. Singh, “Sugarcane marketing systems in India”, Sugar Technology, 13(4), 1-10, 2011.
- M. Sabesh, M. Ramesh, H. Prakash, G. Bhaskaran, “Is there any shift in cropping pattern in Maharashtra after the introduction of Bt Cotton”, Indian society for cotton improvement, 6(1), 63-70, 2014.
- C. Pote, A. Kale, “Effect of Osmotic Stress on Sugarcane (Saccharum officinarum L.) Growth and Physiology”, International Journal of Current Microbiology and Applied Sciences, 8(12), 1472-1481, 2019.
- R. Garkar, Sugarcane Breeding.Central Sugarcane Research Station, Padegaon, 2017.
- M. Rajeevan, D. Pai, R. Kumar, B. Lal, “New statistical models for long-range forecasting of southwest monsoon rainfall over India”, Climate Dynamics, 2-17, 2007, doi:10.1007/s00382-006-0197-6
- S. Sasane, “Impact of south west monsoon on crop yield: a statistical analysis”, International Interdisciplinary Seminar on Geographical and Historical Perspective of Global Problems, 1-10, 2017.
- J. Skutsch, J. Rydzewski, Review of research and development needs in irrigation and drainage, Romw: FAO, 2001.
- R. Jain, P. Kishore, D. Singh,. (2019). “Irrigation in India: Status, challenges and options”, Journal of soil and water conservation, 18(4), 2455-2459, 2019.
- K. Kumar, “Climate impacts on Indian agriculture”, International journal of climatology, 24(11), 1375-1393, 2004.
- S. Gadgil, “The Indian Monsoon”. Resonance, 11(8), 8-15, 2006.
- K. Tamaddun, “Effects of ENSO on Temperature Precipitation and Potential Evapotranspiration of North India’s Monsoon: An Analysis of Trend and Entropy”, Water, 11(2), 1-21, 2019, doi:10.3390/w11020189
- P. Upreti, A. Singh, “An Economic Analysis of Sugarcane Cultivation and its Productivity in Major Sugar Producing States of Uttar Pradesh and Maharashtra”, Economic Affairs, 62(4), 711-718, 2017.
- A, Dias, R, Dhawde, N, Surve, A, Weinberg, T, Birdi, N, Mistry, “Impact of climate changes on water availability and quality in the state of maharashtra in western India”, Asian Jr. of Microbiol. Biotech. Env. Sc, 17(4), 1071-1081, 2015.
- N. Jamwal, Maharashtra Farmers Fear Loss of Kharif Harvest, Blame Met Department. The Wire, 2017.
- B. Singh, O. Singh, “Study of Impacts of Global Warming on Climate Change: Rise in Sea Level and Disaster Frequency”, Global warming Impacts and Future Perspective, 1-10, 2012, doi:10.5772/50464.
- S. Kulkarni, “Development of efficient furnace for jaggery making”, International Journal of Recent Scientific Research, 9(5), 26563-226565, 2018.
- J. Halofsky, B. Harvey, “Changing wildfire, changing forests: the effects of climate change on fire regimes and vegetation in the Pacific Northwest, USA”, Hydrobiologia, 16(4), 1-10, 2020.
- M. Roxy, C. Gnanaseelan, Indian Ocean Warming. In Assessment of Climate Change over the Indian Region, 191-206. Springer publications, Singapore, 2020.
- A. Yaduvanshi, A. Kulkarni, “Observed changes in extreme rain indices in semiarid and humid regions of Godavari basin, India: risks and opportunities”, Natural Hazards, 103, 685-711, 2020.
No related articles were found.