Performance Adjustment Factor for Fixed Solar PV Module
 , Japhet Sakala 1, Kagiso Motshidisi 2, Edward Rakgati 3, Ishmael Zibani 1, Edwin Matlotse 1
Adv. Sci. Technol. Eng. Syst. J. 7(4), 98–104 (2022);
 DOI: 10.25046/aj070413
There are different factors which contribute to the amount of output power which can be delivered by solar photovoltaic (PV) module at any time of the year. The factors include but not limited to solar irradiation, ambient temperature, relative humidity, wind velocity, position of sun in the sky, geographical position of installed solar PV module and others. Apparent position of the sun in the sky contribute to the amount of electromagnetic radiation from the sun reaching the module’s surface area. With the sun further away from the module and irradiance reaching the module surface area at an angle non perpendicular to the surface leads to low output power delivered by the module. In southern hemisphere the PV module experience high output power around November/December which are summer months and low output power around June/July which are winter months. This paper develops performance adjustment factor of fixed solar PV module to adjust PV module output power such that the PV system can deliver required amount of power during winter season. The results show that the value of performance adjustment factor for fixed solar PV module or system was established and can be used to adjust performance or output power for winter periods.
1. Introduction
Performance of Solar photovoltaic (PV) module plays an important part in the overall performance of solar photovoltaic energy system or solar array in particular. To improve performance of the system various studies have confirmed that many factors need to be looked into. This include system design whereby a PV tracking system was found to yield more output power than fixed installation system. However, due to other technical considerations of the system design the fixed installation system is the most commonly preferred. Other considerations are geographical position of the system expressed in terms of latitude and longitudinal points. Weather conditions such as availability of sunlight, wind velocity, temperature, rainfall, technology applied during manufacture of modules, which lead to different types of modules such as monocrystalline, polycrystalline, thin film, and others. To research further on factors and their effects on PV module performance this paper is an extension of work originally presented in 2021 10th International Conference on Renewable Energy Research and Application (ICRERA) which was dealing with maximum power output and voltage profiles as a response to varying irradiance and ambient temperature [1]. Single diode model shown in Figure 1 [2-6] was simulated using Simulink model shown in Figure 2 to generate voltage profile, power profile and profile for maximum power of a fixed installation as it varies from January to December. The outcome of the maximum power profile showed that the maximum power output is lowest during the months of June/July which is winter season in southern hemisphere and increased gradually when summer months (November/December) approached. While the temperature and irradiance were considered when producing profiles, the output power profile followed closely the profile of solar irradiance during the same period, indicating that irradiance is a dominant factor in generating output power by PV module. For the northern hemisphere, the opposite takes place whereby solar irradiation profile picture was observed with the maximum monthly global irradiance recorded during May, June and July months [7]. In this paper two profiles of maximum output power are established. One profile is for the lowest values of maximum power determined in a five year period. The other profile is for the highest values of maximum power profiles established in the same five year period. The two profiles are used to come up with the performance adjustment factor for fixed PV module or PV system. The performance adjustment factor is used to adjust PV system design output to a higher value, such that the system meets the expected output throughout the year irrespective of the time of the year at which it is designed or at which data used in the design was recorded. The rest of the sections of this paper are arranged in the following manner: Section 2 deals with definitions of terms. Section 3 deals with establishment of profiles for maximum output power and voltages. Section 4 presents methodology for generating profiles. Section 5 deals with the results and discussions and section 6 gives conclusions.
2. Nomenclature
k Boltzmann constant (1.381× J/K)
q Electron charge (1.602×10⁻¹⁹ C)
photovoltaic output current
photon current, at standard test conditions (G, 1000 , Temperature )
G Solar irradiance
G0 solar irradiance ( ) at standard test conditions (G, 1000 , Temperature ))
( ) short-circuit current of a PV module at reference condition, ((STC) 1000 , Temperature )
short circuit temperature coefficient at module reference conditions
reverse saturation current
shunt current
output voltage of PV module
ambient temperature (Kelvin)
Diode ideality constant
number of cells in series
diode current
series resistance
shunt resistance
performance adjustment factor
Maximum power output of PV module
Highest value of maximum-power output of the
PV module recorded in a year
Minimum value of maximum-power output of the PV module recorded in a year
Output power of the PV module or PV system
Design
Adjusted output power of the MV module or PV systems.
3. Establishing Maximum Power Profiles for Winter and Summer Seasons
Maximum power output of the PV module for the winter and summer periods are computed by use of single diode model shown in Figure 1 [2]-[6].
The parameters in the model are current source which represents photon current ( ), diode current ( ) passing through the diode which is connected across the source terminals, a shunt resistor which is connected across the current source terminals and represents leakages in form of leakage current ( ) experienced by the cell, and a series resistor ( ) representing resistances due to solder bonds, metallization of cell, terminations of junction box, and emitter and base regions [2, 8, 9].
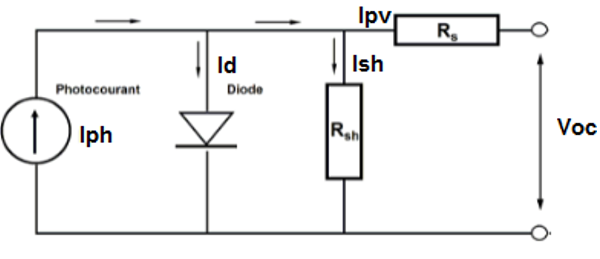
Figure 1: Single diode model representation of a PV cell
The cell model was used to represent PV module because the module is made up of electrical and mechanical interconnection of solar cells. The model in Figure 1 was simulated using Simulink and its corresponding Simulink model is shown in Figure 2 [1].
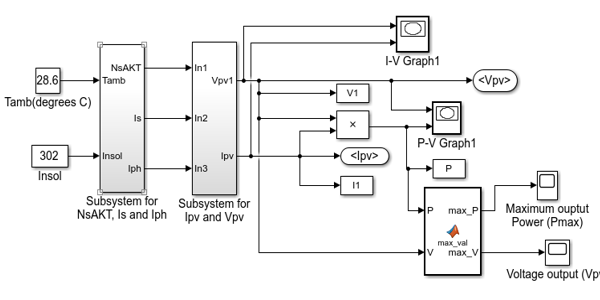
Figure 2: Simulink model for computing maximum power output
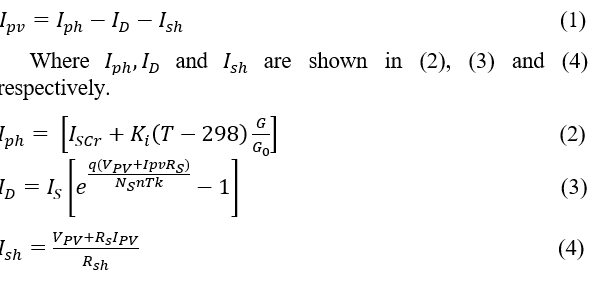
Considering expressions of different electrical parameters of the model the value of output current expressed in mathematical form is presented in (1) [10, 11, 12, 13, 14, 15, 16].
4. Methodology for generating maximum power output profiles
The following data was used to establish profiles. PV module characteristics, ambient temperature and irradiance from five different weather stations in Botswana [17]. Dataset for the two weather variables covers a five year period, from 2009 to 2013.
The characteristic parameters of a photovoltaic module were obtained from a module installed at a weather station called Renewable Energy Research Centre (CERC) at the University of Botswana (UB) in capital city of Republic of Botswana, Gaborone and from similar model online. The geographical positioning system location coordinates of Gaborone are 24° 39′ 11.7252” S and 25° 54′ 24.4512” E [18]. The parameters are detailed in Table 1.
Table 1: Photovoltaic Module Parameters
| Name | Solaire Direct Technologies |
| Model | SD ECO PLUS 150 W |
| Electrical Ratings at STC: 1000 ; AM 1.5 spectrum; Temperature | |
| Peak Power | 150 |
| Warranted minimum | 147.5 ( ) |
| Voltage | 18.0 V |
| Current | 8.05 A |
| Open Circuit Voltage | 22.6 V |
| Short Circuit Current | 8.72 A |
| Maximum System Voltage | 1000 V |
Ambient temperature and solar irradiance were obtained from the following weather stations. Sir Seretse Khama Airport (SSKI) Weather Station. The weather station is located in the Capital City Gaborone, in the south-eastern part of the country with geographical positioning System (GPS) coordinates of 24° 39′ 11.7252” S and 25° 54′ 24.4512” E. Kasane weather station, located in the town of Kasane at the northern part of Botswana. Its GPS location coordinates are 17° 48′ 10.944” S and 25° 8′ 56.0364” E. Tshane weather station, located in the town of Tshane in the southern part of Botswana. Its GPS location coordinates are 24° 1′ 7.032” S; 21° 51′ 33.084” E. Maun weather station, located in the town of Maun at the north-western part of Botswana. Its GPS location coordinates are 19° 59′ 23.6004” S; 23° 25′ 24.888” E. Shakawe weather station, located at the village of Shakawe with the following coordinates 18° 21′ 46.728” S 21° 50′ 51” E [18].
For each weather station, ambient temperature and solar irradiance for a five year period were considered. The temperature was considered because besides irradiance it is one of the factors affecting PV module electrical power output [19, 20]. Data provided from the weather stations was for daily recordings and using that data the monthly average values of temperature and irradiance were calculated. The monthly average values were used as input variables into the Simulink model to compute monthly values of for each month. Figure 3 shows corresponding graphical representation of power output against the voltage obtained from the model. From each graph obtained or indicated were recorded [1]. Similar procedure was followed to generate monthly for the years 2009 to 2013.
To plot profiles, the lowest values of maximum power from each year were plotted. Same procedure was followed to plot a profile for highest values of maximum power from each year. The difference between two profiles ( ) was determined and used to formulate a factor referred to as performance adjustment factor. This factor gives a relationship between in summer season and in winter season in southern hemisphere.
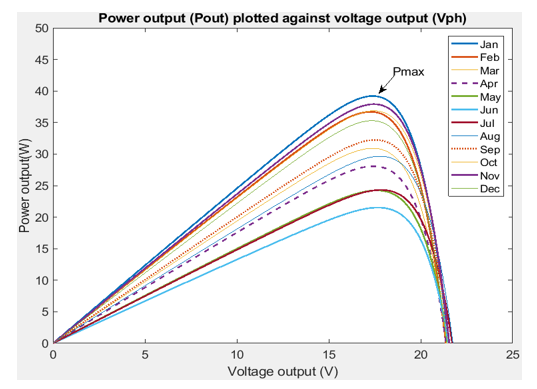
Figure 3: Photovoltaic module power output plotted against voltage for different months of the year
5. Results and Discussion
5.1. Sir Seretse Khama Airport (SSKI) Weather Station
The irradiance and temperature data recorded at the station was used in the simulation model to get values of power output and voltage for the years 2009, 2010, 2011, 2012 and 2013. The Figures 4 and 5 show how output power and voltage values respectively were determined and recorded by Simulink model, with Tables 2, 3, 4, 5 and 6, of corresponding years respectively showing values obtained from Simulink model. From the tables the maximum and minimum values of output power recorded each year were obtained and recorded in Table 7. Also shown in Table 7 are corresponding values of voltages and months of the year at which such minimal and maximum values were recorded.
To establish five year-period profiles for highest maximum value of power ( and lowest maximum value of power ( as shown in Figure 6, data from Table 7 was used. Similarly voltage profile was also generated.
Table 2: 2009 Maximum power and voltage output determined with Simulink Model
| Month | Average Temperature | GHI | (W) | (V) |
| Jan | 24.2 | 264.0 | 34.6 | 17.6 |
| Feb | 24.9 | 259.0 | 33.8 | 17.5 |
| Mar | 20.8 | 234.0 | 30.8 | 17.7 |
| Apr | 19.4 | 235.0 | 31.1 | 17.8 |
| May | 18.1 | 188.0 | 24.6 | 17.6 |
| Jun | 14.0 | 150.0 | 19.5 | 17.7 |
| Jul | 10.0 | 187.0 | 25.2 | 18.2 |
| Aug | 14.7 | 226.0 | 30.4 | 18.1 |
| Sep | 19.8 | 254.0 | 33.8 | 17.8 |
| Oct | 22.9 | 252.0 | 33.1 | 17.6 |
| Nov | 22.4 | 271.0 | 35.8 | 17.7 |
| Dec | 25.2 | 316.0 | 41.7 | 17.7 |
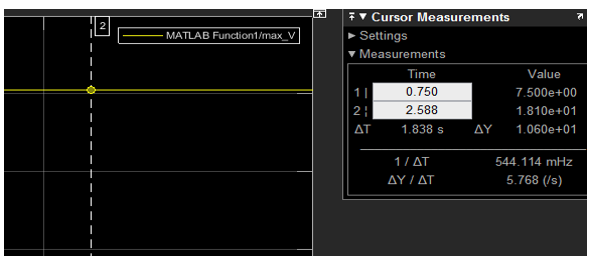
Figure 4: Simulink plotting output voltage
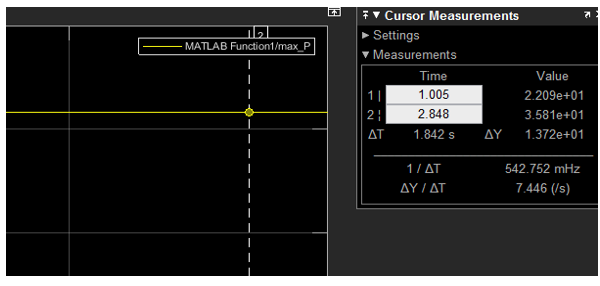
Figure 5: Simulink plotting maximum power
Table 3: 2010 Maximum power and voltage output determined with Simulink Model
| Month | Average Temperature | GHI | (W) | (V) | |
| Jan | 25.3 | 261.0 | 34.0 | 17.5 | |
| Feb | 25.4 | 279.0 | 36.5 | 17.5 | |
| Mar | 24.0 | 235.0 | 30.5 | 17.5 | |
| Apr | 20.6 | 163.0 | 20.8 | 17.3 | |
| May | 16.6 | 173.0 | 22.6 | 17.7 | |
| Jun | 12.1 | 181.0 | 24.2 | 18.0 | |
| Jul | 13.9 | 182.0 | 24.1 | 17.9 | |
| Aug | 15.6 | 229.0 | 30.7 | 18.0 | |
| Sep | 21.5 | 275.0 | 36.5 | 17.8 | |
| Oct | 25.5 | 304.0 | 40.0 | 17.6 | |
| Nov | 25.4 | 266.0 | 34.7 | 17.5 | |
| Dec | 24.6 | 290.0 | 38.2 | 17.6 | |
Table 4: 2011 Maximum power and voltage output determined with Simulink Model
| Month | Average Temperature | GHI | (W) | (V) |
| Jan | 24.0 | 256.0 | 33.5 | 17.5 |
| Feb | 25.2 | 287.0 | 37.6 | 17.6 |
| Mar | 25.9 | 257.0 | 33.3 | 17.4 |
| Apr | 17.8 | 176.0 | 22.9 | 17.6 |
| May | 12.0 | 191.0 | 25.6 | 18.1 |
| Jun | 13.8 | 184.0 | 24.4 | 17.9 |
| Jul | 10.4 | 187.0 | 25.2 | 18.2 |
| Aug | 12.7 | 224.0 | 30.4 | 18.2 |
| Sep | 20.7 | 275.0 | 36.6 | 17.8 |
| Oct | 22.2 | 287.0 | 38.1 | 17.8 |
| Nov | 24.0 | 287.0 | 37.8 | 17.7 |
| Dec | 27.0 | 240.0 | 30.8 | 17.3 |
Table 5: 2012 Maximum power and voltage output determined with Simulink Model
| Month | Average Temperature | GHI | (W) | (V) |
| Jan | 25.3 | 320.0 | 42.3 | 17.7 |
| Feb | 26.6 | 297.0 | 38.8 | 17.5 |
| Mar | 23.9 | 266.0 | 34.9 | 17.6 |
| Apr | 19.8 | 230.0 | 30.3 | 17.7 |
| May | 17.1 | 206.0 | 27.2 | 17.8 |
| Jun | 14.0 | 180.0 | 23.8 | 17.9 |
| Jul | 14.0 | 195.0 | 26.0 | 18.0 |
| Aug | 17.0 | 225.0 | 30.0 | 17.9 |
| Sep | 21.0 | 267.0 | 35.5 | 17.8 |
| Oct | 21.9 | 260.0 | 34.3 | 17.7 |
| Nov | 25.9 | 316.0 | 41.6 | 17.6 |
| Dec | 23.3 | 290.0 | 38.4 | 17.7 |
Table 6: 2013 Maximum power and voltage output determined with Simulink Model
| Month | Average Temperature | GHI | (W) | (V) |
| Jan | 26.9 | 293.0 | 38.2 | 17.5 |
| Feb | 26.8 | 302.0 | 39.5 | 17.5 |
| Mar | 24.5 | 275.0 | 36.1 | 17.6 |
| Apr | 21.7 | 220.0 | 28.7 | 17.6 |
| May | 16.6 | 203.0 | 26.9 | 17.8 |
| Jun | 14.5 | 182.0 | 24.1 | 17.9 |
| Jul | 16.0 | 192.0 | 25.4 | 17.8 |
| Aug | 17.5 | 223.0 | 29.6 | 17.9 |
| Sep | 23.9 | 255.0 | 33.3 | 17.5 |
| Oct | 24.0 | 292.0 | 38.5 | 17.7 |
| Nov | 25.7 | 312.0 | 41.1 | 17.6 |
| Dec | 25.5 | 247.0 | 32.0 | 17.4 |
Table 7: Yearly highest ( and lowest ( values of maximum power and average voltage output for SSKI
| Year | (W) | Mth |
(W) |
Mth | Average (V) | |
| 2009 | 41.7 | Dec | 19.5 | Jun | 17.8 | |
| 2010 | 40.0 | Oct | 20.8 | Apr | 17.7 | |
| 2011 | 38.1 | Oct | 22.9 | Apr | 17.8 | |
| 2012 | 42.3 | Jan | 23.8 | Jun | 17.7 | |
| 2013 | 41.1 | Nov | 24.1 | Jun | 17.7 | |
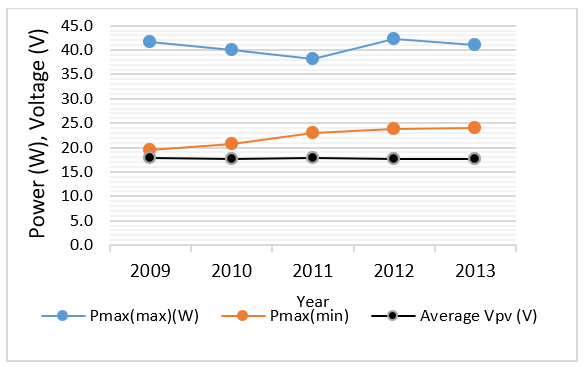
Figure 6: Profiles of highest and lowest values of maximum power and voltages for SSKI Weather station
5.2. Kasane, Maun, Shakawe and Tshane Weather Stations
To develop profiles for Kasane, Maun, Shakawe and Tshane weather stations the approached described in SSKI weather station at section 5.1 was followed. Simulated values of power output and voltages arising from irradiance and temperature values for different months and years are shown in Table 8. Corresponding power and voltage profiles of the same weather stations are shown in Figures 7 to 10 respectively.
Table 8: Highest and lowest values of maximum power and average voltage output
| Place | Yr | Highest value
of Maximum power,
(W) |
Mth | Lowest
value of Maximum power,
(W) |
Mth | Average Output voltage, (V) |
| Tshane | 2009 | 42.5 | Dec | 22.3 | Jun | 17.7 |
| 2010 | 43.6 | Dec | 25.3 | Jun | 17.7 | |
| 2011 | 41.6 | Nov | 24.5 | Jun | 17.7 | |
| 2012 | 40.1 | Nov | 24.4 | Jun | 17.7 | |
| 2013 | 42.7 | Nov | 24.3 | Jun | 17.7 | |
| Maun | 2009 | 37.5 | Nov | 25.4 | Jun | 17.6 |
| 2010 | 39.2 | Oct | 25.6 | Jul | 17.5 | |
| 2011 | 40.6 | Oct | 27.8 | Jun | 17.6 | |
| 2012 | 38.5 | Jan | 27.0 | Jun | 17.6 | |
| 2013 | 39.9 | Feb/Oct | 27.2 | Jun | 17.6 | |
| Kasane | 2009 | 36.9 | Jan | 27.2 | Jun | 17.6 |
| 2010 | 38.9 | Sept | 25.0 | Jul | 17.6 | |
| 2011 | 38.9 | Sept | 28.8 | Jun | 17.6 | |
| 2012 | 38.1 | Sept | 28.4 | Jun | 17.6 | |
| 2013 | 38.9 | Oct | 28.8 | Jun | 17.6 | |
| SSKI | 2009 | 41.7 | Dec | 19.5 | Jun | 17.8 |
| 2010 | 40.0 | Oct | 20.8 | Apr | 17.7 | |
| 2011 | 38.1 | Oct | 22.9 | Apr | 17.8 | |
| 2012 | 42.3 | Jan | 23.8 | Jun | 17.7 | |
| 2013 | 41.1 | Nov | 24.1 | Jun | 17.7 | |
| Shakawe | 2009 | 36.6 | Nov | 27.0 | Jun | 17.6 |
| 2010 | 38.8 | Oct | 26.1 | Jul | 17.6 | |
| 2011 | 40.9 | Oct | 29.3 | Jun | 17.7 | |
| 2012 | 38.8 | Sept | 28.4 | Jun | 17.7 | |
| 2013 | 39.5 | Oct | 28.6 | Jun | 17.6 |
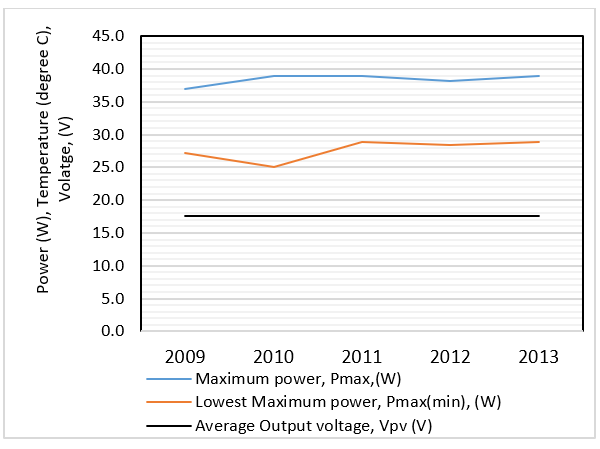
Figure 7: Profiles of highest and lowest values of maximum power and voltages for Kasane Weather station
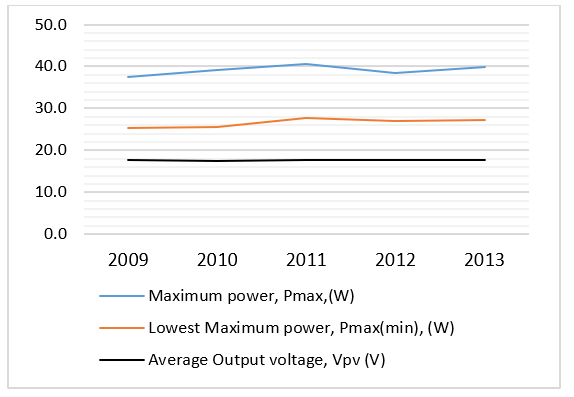
Figure 8: Profiles of highest and lowest values of maximum power and voltages for Maun Weather station
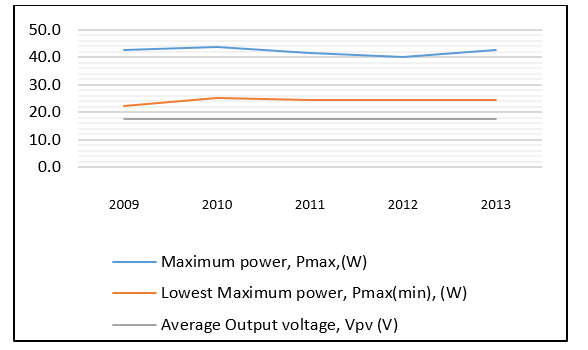
Figure 9: Profiles of highest and lowest values of maximum power and voltages for Tshane Weather station
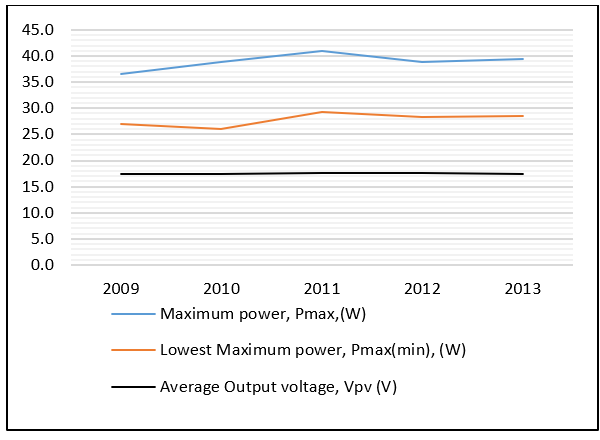
Figure 10: Profiles of highest and lowest values of maximum power and voltages for Shakawe Weather station
5.3. Five year national average profiles
Data from five weather stations shown in table 8 was used to come up with yearly averages shown in table 9, where also the yearly averages were computed to come up with a five year average value for and respectively. Table 9 was used to generate figure 11 where average values of highest value of maximum power , lowest value of maximum power and voltage for each year were plotted to come up with national average profiles. Profiles in figure 11 were refined further as shown in figure 12 by plotting average values stretching on a five year long period.
Table 9: Yearly averages for maximum power and voltage output
| Year | Average Highest Maximum power,
(W) |
Average Lowest Maximum power,
(W) |
Average Output voltage, (V) |
| 2009 | 39.04 | 24.28 | 17.7 |
| 2010 | 40.10 | 24.56 | 17.6 |
| 2011 | 40.02 | 26.66 | 17.7 |
| 2012 | 39.56 | 26.40 | 17.7 |
| 2013 | 40.42 | 26.6 | 17.6 |
| Average | 39.8 | 25.7 | 17.7 |
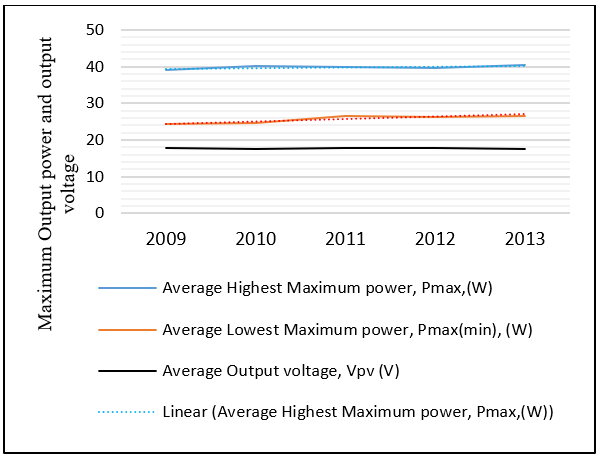
Figure 11: Five year period national averages of maximum power and voltage output
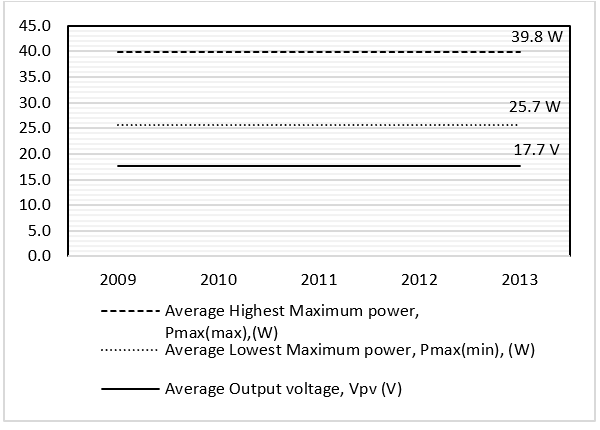
Figure 12: Refined profiles for five year period national averages of maximum power and voltage
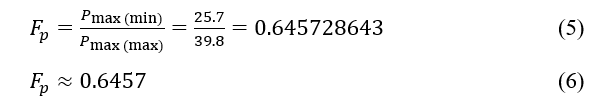
5.4. Determining the value of performance adjustment factor,
The relationship between two final average values of maximum power as shown in table 9 and figure 12 is represented by a factor herein referred to as performance adjustment factor, . The purpose of this factor is to make adjustment on PV systems design output power which would have been determined or calculated during PV system design stage. The importance of adjustment is to ensure that the PV system or the PV module gives a required amount of power output throughout the year regardless of the season or month of the year at which such system was designed. is obtained as shown in (5) to (8)
The final value of the solar PV system or module output power obtained after adjustment is designated, , and is presented as in (3)
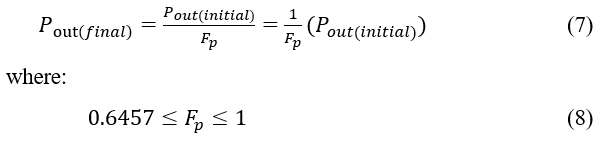
is the output power, before adjustment, of the fixed solar PV system or module calculated using site specific parameters (temperature and irradiation) at any time of the year.
5.5. Conditions for
According to (7) and (8) if is calculated using solar irradiance and temperature values of summer season, example October/November, then to get the value of at this season is maximum with a value of 1.0. For the same PV system or module, to adjust its calculated output for the purpose of winter performance the should be divided by 0.6457. The obtained after adjustment can now be used to resize the system to ensure that it will deliver such adjusted power in winter.
If the is calculated using solar irradiance and temperature values of winter season, the value of will remain maximum throughout, that is value of 1. In this case is taken as . This means that the system designed or sized using winter weather data (irradiance and temperature) is capable of delivering required output power throughout the year including during summer season and there is no need for any performance adjustment
6. Conclusion
According to the results obtained the module maximum output power in summer (around November/ December) is higher than the maximum power in winter (June / July). To ensure that PV system or module produce required amount of power throughout the year a performance adjustment factor was derived to be used in calculations for determining power output in winter. Further work will involve experimental setup to refine performance adjustment factor with other variables considered.
Conflict of Interest
The authors declare no conflict of interest.
- K. Tsamaase, J. Sakala, E. Rakgati, I. Zibani, K. Motshidisi, “Solar PV Module Voltage Output and Maximum Power Yearly profile using Simulink-based Model,” in 2021 10th International Conference on Renewable Energy Research and Application(ICRERA), 26-29, 2021, doi: 10.1109/ICRERA52334.2021.9598794
- C.B.Honsberg, S.G.Bowden, “Photovoltaics Educationte,” www.pveducation.org, 2019.
- H. Ibrahim, H. Anani, “Variations of PV module parameters with irradiance and temperature,” in 9th International Conference on Sustainability in Energy and Buildings, 5-7, 2017, doi:10.1016/j.egypro.2017.09.617
- T. M Silverman, M. G. Deceglie, I. Subedi, N. J. Podraza, I. M. Slauch, V. E. Ferry, I. M Slauch, “Reducing Operating Temperature in Photovoltaic Modules,” Photovoltaics, 8(2), 532-540, 2018, doi.org/10.1109/JPHOTOV.2017.2779842
- H. Singh, D. Kaur, P. S. Cheema, “Optimal design of Photovoltaic Power System for a residential load,” in International Conference on Inventive Systems and Control (ICISC), 19-20, 2017, doi: 10.1109/ICISC.2017.8068595
- Y. Wang, Y. Liu, C. Wang, Z. Li, X. Sheng, H. Lee, N. Chang, H. Yang, “Storage-Less and Converter-Less Photovoltaic Energy Harvesting With Maximum Power Point Tracking for Internet of Things,” Computer-aided design of integrated circuits and systems, 35(2), 173 – 186, 2016, doi:10.1109/TCAD.2015.2446937
- T. Abu Dabbousa, I. Al-Reqeb, S.Mansour, M. Ammirrul Atiqi Mohd Zainuri, “The Effect of Tilting a PV Array by Monthly or Seasonal Optimal Tilt Angles on Energy Yield of a Solar PV System,” in 2021 International Conference on Electric Power Engineering (ICEPE), 23-24, 2021, doi:10.1109/ICEPE-P51568.2021.9423475
- P.Hao, Y. Zhang, “An Improved Method for Parameter Identification and Performance Estimation of PV Modules From Manufacturer Datasheet Based On Temperature-Dependent Single-Diode Model,” Photovoltaics, 11(6), 1446 – 1457, 2021, doi:10.1109/JPHOTOV.2021.3114592
- P. Natarajan, and R. Muthu, “Performance Improvement of PV Module at Higher Temperature Operation,” Engineering science and technology, 2(5), 2012, doi: ISSN 2250-3498
- S. T. Kim, S. Bae, Y. C. Kang, J. W. Park, “ Energy Management Based on the Photovoltaic HPCS With an Energy Storage Device,” Industrial electronics, 62(7), 4608 – 4617, 2015, doi: 10.1109/TIE.2014.2370941
- V. Tamrakar, S.C. Gupta, Y. Sawle, “Single-diode PV cell modeling and study of characteristics of single and two-diode equivalent circuit,” Electrical and electronics, 4(3), 13-24, 2015, dio: 10.14810/elelij.2015.4302,
- H. Park, Y. Kim, H. Kim, “PV Cell Model by Single-diode Electrical Equivalent Circuit” Electrical engineering and technology, 11(5), 1323-1331, doi: 11(5): doi:10.5370/JEET.2016.11.5.1323,
- T. Ahmed, T. Gonçalves, M. Tlemcani, “Single diode model parameters analysis of photovoltaic cell,” in 2016 IEEE International Conference on Renewable Energy Research and Applications (ICRERA), 20-23, 2016, doi: 10.1109/ICRERA.2016.7884368,
- B. C. Babu, S. Gurjar, “A Novel Simplified Two-Diode Model of Photovoltaic (PV) Module,” 4(4), 1156-1161, 2014, doi: 10.1109/JPHOTOV.2014.2316371
- N. Islam Sarkar, “Effect of various model parameters on solar photovoltaic cell simulation: a SPICE analysis,” Sarkar Renewables, 3(13), 2016, doi: 10.1186/s40807-016-0035-3
- H. K. Mehta, H. Warke, K. Kukadiya, A. K. Panchal, “Accurate Expressions for Single-Diode-Model Solar Cell Parameterization,” Photovoltaics, 9(3), 803-810, 2019, doi: 10.1109/JPHOTOV.2019.2896264
- Department of Meteorological Services, Plot No. 54216, Corner of Metsimotlhaba/Maaloso Roads, meteo@gov.bw. Botswana. 2021.
- Longitude and latitude finder. 2021. www.latlong.net
- V. Herbort, R. von Schwerin, B. Compton, L. Brecht, H. te Heesen, “Insolation dependent solar module performance evaluation from PV monitoring data,” in 38th IEEE Photovoltaic Specialists Conference, 3-8, 2012, doi:10.1109/PVSC.2012.6317834
- M. Islam, M. Mehedi Hasan Shawon, S. Akter, A. Chowdhury, S. Islam Khan, M. Rahman, “Performance Investigation of Poly Si and Mono Si PV Modules: A Comparative Study,” in International Conference on Energy and Power Engineering (ICEPE), 14-16, 2019. doi: 10.1109/CEPE.2019.8726598