The use of Integrated Geophysical Methods to Assess the Petroleum Reservoir in Doba Basin, Chad
Volume 7, Issue 4, Page No 34-41, 2022
Author’s Name: Diad Ahmad Diad1, Domra Kana Janvier2, Abdelhakim Boukar1,a), Valentin Oyoa2
View Affiliations
1Department of Physics, Teachers Training Higher School of N’Djamena, University of N’Djamena, Chad, P.O. Box 460, N’Djamena, Chad
2Department of Mines, Petroleum and Water Resources Exploration, Faculty of Mines and Petroleum Industries, University of Maroua, P.O. Box 08, Kaele, Cameroon
a)whom correspondence should be addressed. E-mail: boukar.abdelhakim@gmail.com
Adv. Sci. Technol. Eng. Syst. J. 7(4), 34-41 (2022); ![]() DOI: 10.25046/aj070406
DOI: 10.25046/aj070406
Keywords: Static reservoir, Petrophisical parameters, 3D seismic, Well log, Central African rift system, Doba Basin, Chad, Geology, Earth science, Africa

Export Citations
Hydrocarbon exploration and production has been successful in the central region of Doba basin, Chad, north-central Africa. In order to optimize the hydrocarbon production in this area, the combination of seismic and well log datas have been processed and analyzed to better characterize, image and capture the reservoirs. The 3D seismic and well log datas were used to obtain the horizon grids, fault polygons, and petrophysical parameters. The results show continuous and divergent horizons which are associated to differential subsidence and thickening of series on the inclined bedrock. The reservoir is an anticlinal structure where the hydrocarbons are trapped, in particular with reservoir levels interposed between the two stratigraphic sequences. Four mayors fault that cross the reservoir have been identified. The calculation of the average percentage of the encountered facies enabled to highlight the high percentage of sands compared to clays and clayey sands. Porosities are uniform in clays and sands in the two out of three wells, and higher in coarse sands. The permeabilities are average in sands and clays, but decrease in the fine sands. The 3-D static reservoir model integrated with structural and petrophysical parameters gives a better understanding of spatial distribution of the discrete and continuous reservoir properties. This work contributes to a future prediction of the reservoir performance, characteristics and production behavior in Doba basin.
Received: 13 December 2021, Accepted: 20 February 2022, Published Online: 23 July 2022
1. Introduction
According to the national report of Chad, the petroleum production started in 2003 and reached its peak in 2004 (8.7 Mt). However, it has decreased steadily since 2006 (5.7 Mt in 2011), despite the commissioning of the new fields. This decrease is due to the technical difficulties and upwelling, which caused production to stop on several fields. This decline in production is mainly caused by the depletion of the fields. To remedy this deficit, the Chadian State has promoted several other blocks. The prospecting of these blocks begins with a better geological and petrophysical knowledge of the neighboring fields or in the exploitation of the basin. To contribute to this government-run project, this study proposes to determine a static reservoir model and petrophysical properties of cretaceous basin of Doba using logging and 3D seismic methods. This basin is part of the West African and Central African Rift system. The Lower Cretaceous formations mainly contain lacustrine sediments, the sandstone and mudstone interdicts are major reservoir strata, and above all, a large set of thick schists developed at the top of the formation, the Upper Cretaceous is dominated by the abundant riverine sandstone, with alluvial plain mudstone at the top. The Cenozoic formations contain coarse-grained clastic fluvial sediments.
The use of novel methods of geological and geophysical interpretation gives a realistic result in the oil and gas industry. Consequently, the use of the integrated approach of geology, geo- physics, petrophysics, geostatistics and reservoir engineering for detailed characterization of reservoirs and their properties is a crucial approach, as also demonstrated in existing studies [1]-[3].
Hydrocarbon characterization can be achieved by the integration of seismic, well logs and geological data commonly used independently in hydrocarbon exploration and exploitation studies [4]-[9]. However, the detailed analysis of reservoir depends on how well data integration is performed [10]-[13].
Moreover, the use of seismic attributes such as dip, azimuth, amplitude, envelope, frequency and variance can enhance seismic interpretation [14]-[19] for a proper reservoir characterization. Furthermore, accurate 3D modeling of the reservoir can facilitate estimating of hydrocarbon reserves and determining the efficient way to recover as much of the hydrocarbon as possible for economic resource exploration [20]-[23].
2. Study area and geological setting
The Doba Basin is a sedimentary basin located in southern Chad, central Africa. It has a relatively high outcrop in the north and east, a lower outcrop in the south, a deeper outcrop in the north-west and forms a half bowl in the center, the Figure 1. The coordinates of the study area are 8° 31 ’N and 16° 47’ E. The study area forms a part of the West African and Central African Rift System, stretching across the central part of Africa, from Nigeria to Kenya. It is stored in the shear zone between these two countries.
The Doba Basin is a late Mesozoic sedimentary basin. This basin contains up to 10 km of the non-marine sediments that record the tectonic and climatic evolution of the region from the Lower Cretaceous to the present day. Those include stretching of the African plate during the tectonic plate movements, the orogeny and the dislocation of Gondwana, formed depressions in the center of the African continent which are the part of the West African and Central African rift system. The Doba Trench is the most depressed topographic part of the region. The ultrasound measurements undertaken in order to assess the depth of the Cretaceous sediments under the Continental Terminal detected the basement at 3500 m under the Paleo Chadian sands and sandstones, the Cretaceous marls and the Continental Interlayer. In [24], the author evaluated the respective thicknesses of these layers near Doba as follows: – Continental Terminal: from 0 to 700 m; – Cretaceous marls: from 700 to 1500 m; – Continental Intercalaire: from 1500 to 3500 m.
The presence of Bébo siliceous sandstones that could be linked to the Continental Intercalaire would attest to the existence of a Continental deposit above a highly developed ante-Karro surface. It is on the same surface, perhaps already deformed, that the Benue transgression would take place from west to east to the depressed area that started developing in the Doba region. The end of the Cretaceous transgression was accompanied by folds and dislocations as evidenced by faulted synclines of Léré-Figuil and dips of the Lamé series. The Bénoué basin and the Doba pit evolved separately from these deformations. In the West, the evacuation of detrital formations from Tertiary is oriented towards Niger. In the east, on the contrary, it accumulates in the Doba and Sarh pits subject to subsidence.
The Doba Basin has a basement composed of Precambrian metamorphic rocks covered by at most 7,500 m of continental deposits of thinner formations of the Lower Cretaceous (Mangara, Kedeni, Doba and Lower Kome), and thick formations of the Upper Cretaceous (Upper Kome and Miandoum). The Lower Cretaceous formations mainly contain lake sediments, sandstone and mudstone interlits are the major reservoir strata, and above all a large set of thick schists is developed at the top of the formation. The Upper Cretaceous is dominated by the abundant river sandstones, with alluvial plain mudstones at the top. The Cenozoic formations contain coarse-grained clastic fluvial sediments. The Doba pit is made up of the following layers: • Reservoir-Lower Cretaceous rock of Lower Kome, Kedeni and Mangara Formation and Upper Cretaceous of the Miandoum Formation of various arkosic sandstones. • Source-Lower Cretaceous rock of the Doba schists; Lacustrine schists of the first rift with a TOC content of 1 to 4% (organic matter of type I and III) • Cover rock, thick shales developed at the top of the formation, acting as good regional cover rocks.
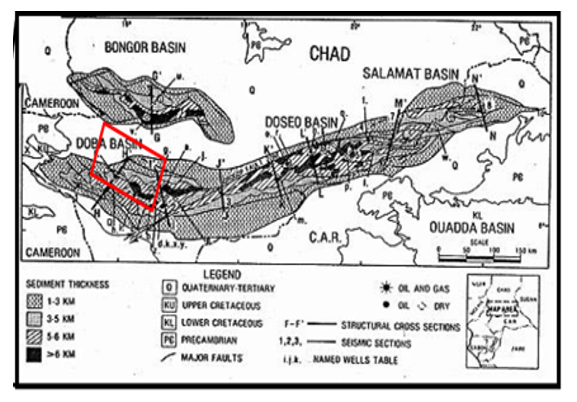
Figure 1: Map of studied location (red box), Doba Basin of Southern Chad which is a part of Central African Rift System, CAS [23].
3. Materials and methods
-
- Materials and data
The implementation of this work was made possible due to the use of available documentation from the previous existing reports on fieldwork and also from existing reports of several oil companies. The computer interpretation and modeling tools included the following software: Golden Surfer, Microsoft Excel, Publisher, Google Earth, Google Map, and Pétrel from Schlumberger. The data used for this study include results of seismic reflection and well logging of the Doba basin in Chad. The logging data used include the following types: Gamma ray, which measures the natural radioactivity of a formation and is expressed in API (American Petroleum Institute); Neutron porosity which measures the porosity of a formation in percentage (%); Permeability which measures the permeability of a formation in milli darcy (mD); The Net to Gross which gives the ratio between the quantified fasciae and the global fasciae (NTG).
- Methodology
The Petrel software was used as a 3D geocellular modeling package to represent the reservoir geology, structure, stratigraphic envelope, reservoir sublayers and faults in 3Dviewshowing structural and properties models. The reservoir volume was divided into a 3D mesh of cells, a typical geocellular model having hundreds of thousands to millions of cells in it. For each cell, a litho facies and rock properties such as porosity was assigned. The seismic data set comprises of both inline and cross line sections. Each well consist of the following well logs: gamma ray, spontaneous potential, calliper, density, neutron, sonic, and resistivity logs.
We extracted the faults using the guided manual picking method, proposed by Simpson and Howard (Simspon and Howard, 1996). The workflow methodology was based on the existing guide in a manual: • The interpreter points a polygonal line of a few points on a vertical section of the cube; • The ends of the line are automatically extended down and up the section; • The sub-vertical line obtained is then automatically readjusted laterally on the section, so that it follows the zones where the attribute marks the fault as accurate as possible; • The fault is now pointed by a line on a vertical section. This line is copied and translated into the adjacent vertical cross-section. • The new line is in its turn readjusted to the attribute of the new section. This approach has the advantage of allowing the interpreter to intervene at any time to rectify a misplaced point. The extraction is therefore well controlled, which makes it possible to obtain a good result, since this method is mostly manual and human-controlled. The multi-well geological correlation was performed in order to relate geophysics to geology. In particular, we performed cutting of the stratigraphic horizons on the well section, for the corrections of the structural model, the parameterization of the speed model, which allowed to transform modelling from the time domain to the depth domain. It was therefore necessary to make a geological correlation of various boreholes carried out. We linked the four wells based on their calculated average porosities on the one hand, the Net-to-Gross ratio, and the river fasciae identified by logging results on the other. The Figure 2 illustrates the workflow.
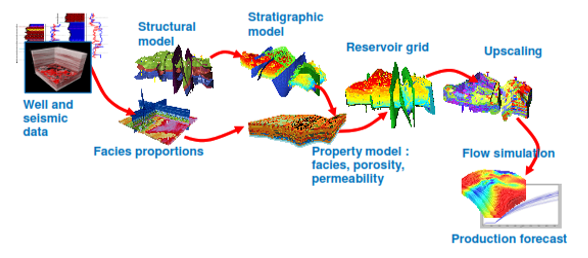
Figure 2 flowchart of methodology used
4. Results
-
- Result of sedimentary interface termination
Upon applying the attribute combination cosine of phase and relative acoustic impedance, we observed the interface termination. This surface was compared to the erosion truncation that we extracted from the seismic cube, as presented in Figure 3.
After analysis, it is possible to see that the structure observed in nature is the same as in our seismic image. Details were not clearly visible on a normal profile without the use of these attributes. This result is a first step towards the extracting of geological objects aimed to derive information that an interpreter is looking for.

Figure 3: Extraction of an interface termination before picking
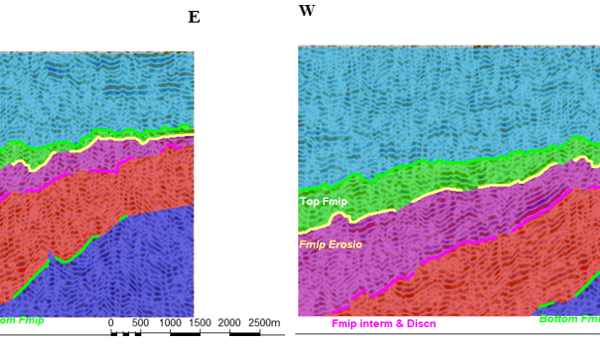
Figure 4: Blocks of cut-out horizons
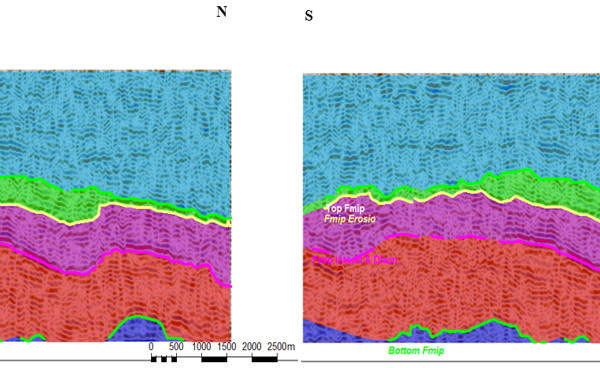
Figure 5: Reconstructed blocks of horizons
- Result of horizon
Based on the performed graphical plotting, we are initiating the projection into space of the horizons being tracked in order to better highlight the stratigraphic sequences of the sedimentary units. From a geological point of view, we can distinguish the two visible sequences. Figure 4 shows the continuous configurations of the divergent types. They refer to a differential subsidence and a thickening of series on an inclined substratum. The continuous configurations of the subparallel types are implying subsidence with a constant rate of sedimentation.
Figure 5 is a visualization of the division made by reconstructing different blocks with a range of colors, each representing a horizon block. We can see here the succession of layers deposition with the migration of off lap breaks which are more distinct in some cases, while less visible in others, see Figure 5.
- Fault extracting results
After applying the ant tracking and meta attribute, we obtained the image to detect and track flaws. However, to avoid errors during manual extraction, we applied Meta attribute after the Ant tracking, in order to improve this detection. The faults appear much clearer and are easily distinguished from the horizons. Figure 6, 7, 8 and 9 demonstrate the obtained results.
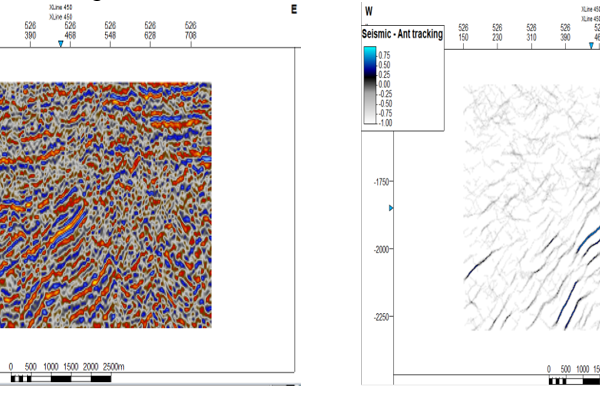
Figure 6: Fault extraction ant tracking on inline
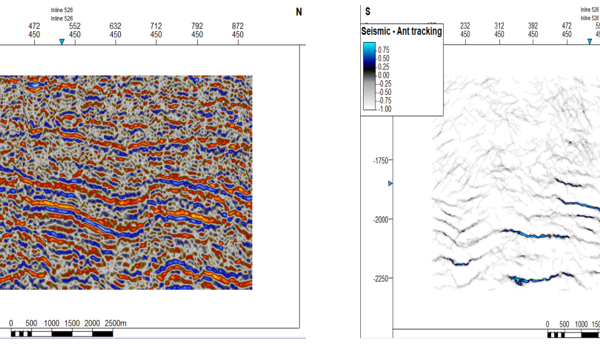
Figure 7: Fault extraction ant tracking on crossline
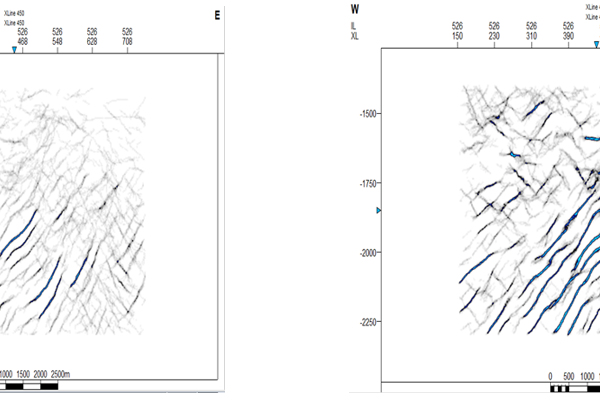
Figure 8: Result of apply the meta attribute on ant tracking (inline)
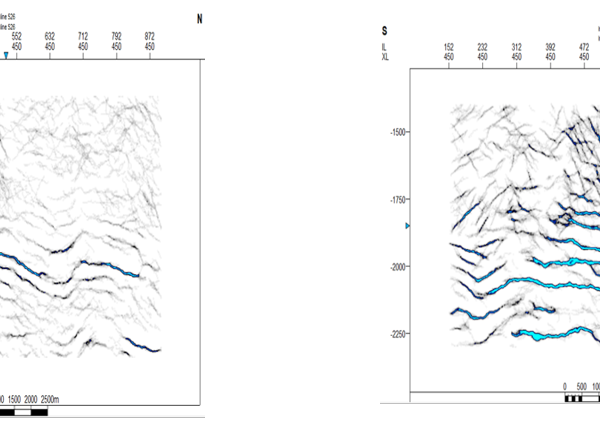
Figure 9: Result of apply the Meta attribute on ant tracking (crossline)
The three-dimensional model of the four major faults is shown in the Figure 10.
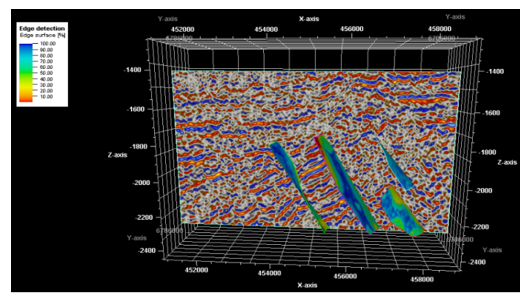
Figure 10: 3D modeling of major faults (inline)
4.4. Result of Top and Bottom of Horizons
The maps of top and bottom horizon show a variation of color on a time scale in milli second (Figure 11). The low values are associated to the first arrivals and could be interpreted as the sub-surface areas, while the high values inform on the depth layers. The pace of the curves show high depressions that refer to a more pronounced folding (turbulence zones) especially on the top horizon, where a complex mixing of the layers occurred.

Figure 11: Top and bottom horizon(a top and b bottom)
The structural model obtained after picking and tracking of geological setting is given in Figure 12. The four major faults have been centralized inside the model. This model can be sued to plot static model.
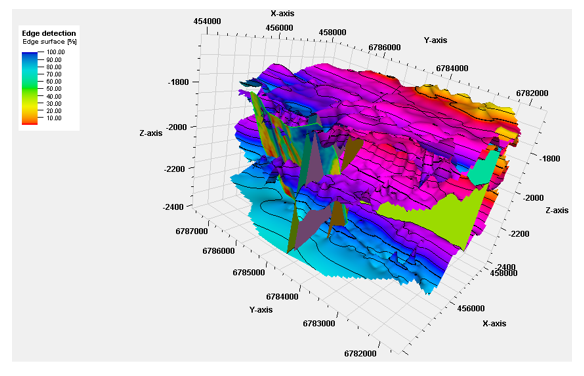
Figure 12: Structural model
4.5. Petrophysical model
From the perspective of relating seismic to geology, it is important to correlate the wells to highlight the geology of the basin and to make the link between the different sedimentary units. Here we presented the three wells drilled in the study area, respectively the A16; B2; B9.For this purpose, our correlation is made according to the identified fascies, the average porosity, and the average Net to Gross ratio.
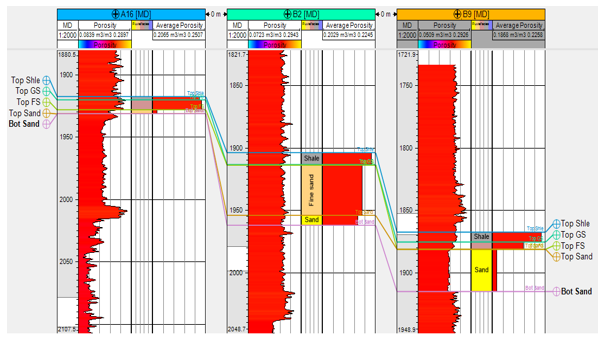
Figure 13: Average fascias per zone in the wells
The Figure 14 below illustrates the average porosity calculated in each well based on the overall porosity records. We can therefore notice high percentage in the coarse sands, decreasing slightly in clays and then becoming medium in sand. However, by applying the calculation of the average porosity in these wells as a function of general porosity, we noticed that coarse sands retain their greater volume ratio compared to middle- or fine-grained sand. However, the proportion of clays is even greater than that of coarse sand.
Here we applied our correlation according to the Net to Gross, which emerges the ratio of a pure fascies on all the fasciates present in order to characterize the quality of the reservoir in question. According to the analysis, we can see a large variation to the right, for clay and coarse sand, which is totally opposite to that of sand which has a large deflection to the left. However, when we calculate the average Net to Gross (Figure 15), the sand which had a large deflection to the left totally drops, but clay, fine sand and coarse sand have a high percentage, with a slightly large peak for coarse sand.
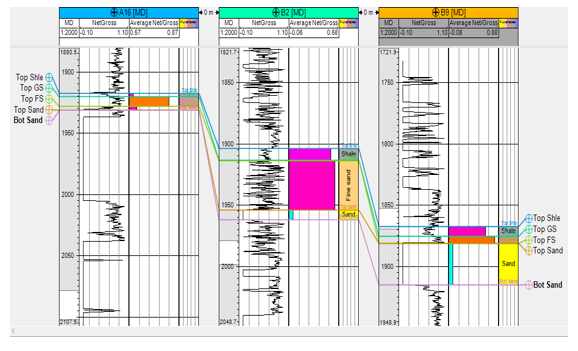
Figure 14: average porosity in each well
Compared to clay, we can therefore conclude that the percentage of the pure coarse sand and pure fine sand are in excess of all the fasciae present, and that implies a sandstone reservoir. The following Figure 15 shows the results.
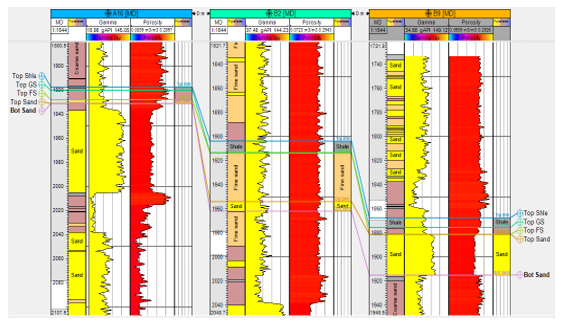
Figure 15: Net to cross average in each well
Following previous calculations, we can move on to the stratigraphic model which consists inplotting the structural model with the petro-physical properties and the fascies. We therefore plot the different zones created on our three wells with the determined fascies and the properties calculated above. We first present the rock volume based on a color scale which gives values of the gross volume. Each color corresponds to any volume, and subsequently the reservoir grid. We present them in the following Figure 16.
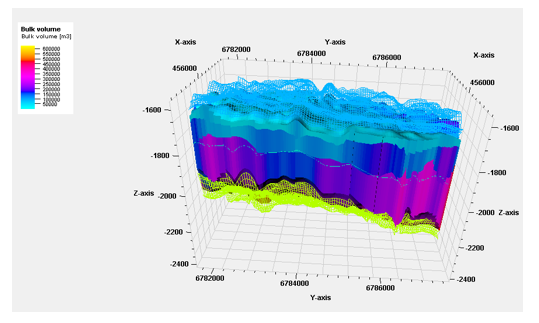
Figure 16: Result of rock volume
Upong modelling fascies and petro-physical properties, the next step included plotting grid. This model is not completed because the physical petro properties and fascies have exceeded the extent of the grid.
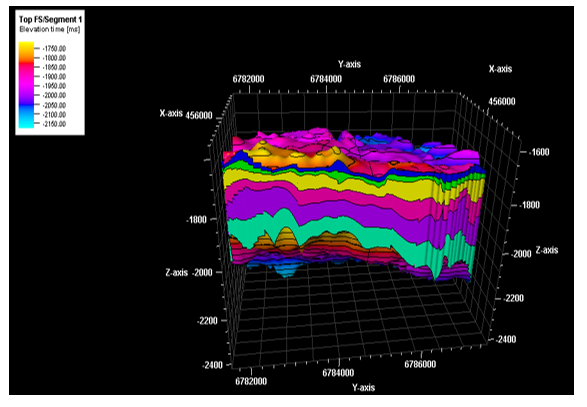
Figure 17: Result of static reservoir model
5. Discussion
The major research question of this study included interpretation of the seismic data of one of the blocks in the Doba basin in Chad. Through this interpretation we observed that the reservoir in question dates from the Cretaceous period and contains clay and sandstone rocks inside. It is affected by tectonic and stratigraphic accidents which allowed us to delimit the reservoir. In fact, it is an anticlinal structure where hydrocarbons are trapped into the two to three reservoir levels interposed between the first stratigraphic sequence and the second, which is subdivided in the two divergent types of the continuous configurations. Thus, this refers to a differential subsidence and a thickening of the series on an inclined substratum.
The continuous configurations of the sub parallel types, imply the subsidence with a constant rate of sedimentation. The calculation of the average percentage of the encountered fasciae enabled to highlight the high percentage of sands compared to clays and clayey sands. The porosities are uniform in normal clays and sands in the two out of three wells, and higher in coarse sands, respectively. The permeability is average in medium-grained sands and clays, but decreases in the fine-grained sands. We also noted that the waterproof roof was not extended over the entire block due to the tight mesh. Therefore, we extended a few more in lines to maximize the reservoir grid while controlling the extension of the porous fasciae in certain areas which did not present trapping structures.
Based on the performed analysis we interpret this area to be a sandstone reservoir, which is an anticline dating from the Cretaceous period. It was developed during the formation of the West African and Central African Rift system, and now extend through the central part of Africa, from Nigeria to Kenya through Chad. Thus, we achieved the major objective of this study, which aimed at a clear reinterpretation of the block. The limitations of the study include the following data shortage. Since our well data did not include specific information regarding resistivity and density, we were unable to determine saturation and from there estimate the reserves in place. It is therefore recommended for future studies to extend the research by including resistivity and density of porous materials for more detailed geological analysis.
6. Conclusion
Seismic and well logs data have been used for static modeling and petrophysical characterization of the reservoirs in Doab field, Chad. The reservoir is an anticlinal structure where the hydrocarbons are trapped, in particular with reservoir levels interposed between the two stratigraphic sequences. In this study we have identified the four major faults that crossed the reservoir. The calculation of the average percentage of the facies demonstrated high percentage of sands compared to clays and clayey sands. The porosities are uniform in clays and sands in the two out of three wells, and higher in coarse sands. The permeability is average in sands and clays, but decreases in fine sands. The 3-D static reservoir model integrated with structural and petrophysical parameters has been plotted and visualized on a series of the presented graphs. This paper contributes to the future exploration of geological resources of Chad, where the presented results could be used for correlation in the field of Doba.
- Y.Z. Ma,, Uncertainty analysis in reservoir characterization and management: how much should we know about what we don’t know? In: Ma, Y.Z., La Pointe, P.R. (Eds.), Uncertainty Analysis and Reservoir Modeling: AAPG Memoir 96, pp. 1–15, 2011.
- O. O. Osinowo,, Ayorinde, J.O., Nwankwo, C.P., Ekeng, O.M., Taiwo, O.B., Reservoir description and characterization of Eni eld o shore Niger Delta, southern Nigeria. J. Petrol. Explor. Prod. Technol. 8 (2), 381–397., https://doi.org/10.1007/s13202-017-0402-7, 2018.
- X.Y. Yu, Y.Z. Ma,, D. Psaila, Pointe, P.L., Gomez, E., Li, S., Reservoir character- ization and modeling: a look back to see the way forward. AAPG Mem. 96, 289–309, 2011.
- A.W. Mode, Anyiam, A.O., Reservoir characterization: implications from petro- physical data of the “Paradise-Field”, Niger Delta, Nigeria. Pac. J. Sci. Technol. 8 (2), 194–202, 2007.
- A.P., Aizebeokhai, I. Olayinka, Structural and stratigraphic mapping of Emi eld, oshore Niger Delta. J. Geol. Min. Res. 3 (2), 25–38, 2011.
- A.O. Adelu, Sanuade, O.A., Oboh, E.G., O eh, E.O., Adewale, T., Mumuni, O.S., Oladapo, I.M., Omolaiye, E.G., Hydrocarbon eld evaluation: case study of ‘Tadelu’ eld shallow o shore Western Niger Delta, Nigeria. Arabian J. Geosci. 9 (2), 116. https://doi.org/10.1007/s12517-015-2028-8, 2016.
- O.A. Sanuade, A.O. Akanji, Olaojo, A.A., Oyeyemi, K.D., Seismic interpretation and petrophysical evaluation of SH eld, Niger Delta. J. Petrol. Explor. Prod. Technol. 8 (1), 51–60, 2017b.
- Sanuade, O.A., Kaka, S.I., Sequence strati graphic analysis of the Otu Field, onshore Niger Delta using 3D seismic data and borehole logs. Geol. Q. 61 (1), 106–123. https://doi.org/10.7306/gq.1318, 2017.
- A.O. Akanji, O.A. Sanuade, Kaka, S.I., Balogun, I.D., Integration of 3D seismic and well log data for the exploration of kini eld, o shore Niger delta. Petrol. Coal 60 (4), 752–761, 2018.
- S. Chopra, R.J. Michelena, Introduction to Reservoir Characterization. Special edition of The Leading Edge, pp. 35–37, 2011.
- T.A. Adagunodo, L.A. Sunmonu, M.A. Adabanija, Reservoir characterization and seal integrity of Jemir eld in Niger Delta, Nigeria. J. Afr. Earth Sci. 129, 779–791, 2017.
- O. O. Osinowo, J.O. Ayorinde, C.P. Nwankwo, O.M. Ekeng, O.B. Taiwo, Reservoir description and characterization of Eni eld o shore Niger Delta, southern Nigeria. J. Petrol. Explor. Prod. Technol. 8 (2), 381–397. https://doi.org/10.1007/s13202-017-0402-7, 2018.
- Y.C. Ajisafe, B.D. Ako, 3-D seismic attributes for reservoir characterization of “Y” field Niger Delta, Nigeria. IOSR J. Appl. Geol. Geophys. 1 (2), 23–31, 2013.
- E.A. Ayolabi, A.O. Adigun, The use of seismic attributes to enhance structural interpretation of Z- eld, onshore Niger Delta. Earth Sci. Res. 2 (2), 223–238, 2013.
- E. Jegede, B.D. Ako, Adetokunbo, P., Edigbue, P., Abe, S.J., Seismic stratigraphy and attribute analysis of an o shore eld, Niger Delta, Nigeria. Arabian J. Geosci. 8 (9), 7537–7549. https://doi.org/10.1007/s12517-014-1665-7, 2014.
- K.D. Oyeyemi, A.P. Aizebeokhai, Seismic attributes analysis for reservoir char- acterization; o shore Niger Delta. Petrol. Coal 57 (6), 619–628, 2015.
- P. Adetokunbo, A.A. Al-Shuhail, S. Al-Dossary, 3D seismic edge detection using magic squares and cubes. Interpretation 4 (3), T271–T280, 2016.
- O.A. Sanuade, S.I. Kaka, Sequence strati graphic analysis of the Otu Field, onshore Niger Delta using 3D seismic data and borehole logs. Geol. Q. 61 (1), 106–123. https://doi.org/10.7306/gq.1318, 2017.
- L. Adeoti, N. Onyekachi, O. Olatinsu, J. Fatoba, M. Bello, Static reservoir modeling using well log and 3-D seismic data in a KN eld, o shore Niger Delta, Nigeria. Int. J. Geosci. 05 (01), 93–106, 2014.
- O. Duvbiama, J. Ikomi, 3D Static Modelling of an O shore Field in the Niger- Delta. Nigeria Annual International Conference and Exhibition Held in Lagos, Nigeria. 31 July – 2 August 2017 SPE-189161-MS, 2017.
- G.O. Emujakporue, Petrophysical properties distribution modelling of an onshore field, Niger Delta, Nigeria. Curr. Res. Geosci. 7 (1), 14–24, 2017.
- Bouteyre G., J. Cabot, J. Dresch; Observations sur les formations du continental terminal et du Quaternaire dans le bassin du Logone (Tchad). Bulletin de la Société Géologique de France 1964;; S7-VI (1): 23–27, doi: https://doi.org/10.2113/gssgfbull.S7-VI.1.23
- R. E. HOWARD, Landmark Graphics Corporation. Method for attribute tracking in seismic data. Brevet American 5, 056 – 066, 1991
- M. (n.d) Aremu, Chad Prepares to Be an Oil Producers. Oil and Gas Online. Retrieved on September, 29th 2015 from http://www.oilandgasonline.com/doc/chad-prepares-to-be-an-oil- producer-0001
Citations by Dimensions
Citations by PlumX
Google Scholar
Crossref Citations
No. of Downloads Per Month
No. of Downloads Per Country