Automated Robotic System for Sample Preparation and Measurement of Heavy Metals in Indoor Dust Using Inductively Coupled Plasma Mass Spectrometry (ICP-MS)
 , Sascha Statkevych 2, Janne Widmer 2, Regina Stoll 3, Thomas Roddelkopf 1, Kerstin Thurow 4
Adv. Sci. Technol. Eng. Syst. J. 7(3), 139–151 (2022);
 DOI: 10.25046/aj070316
Dust is ubiquitous in our daily environment—outdoor and indoor. In modern times, people often spend the majority of their time at home, in offices, at work or in schools. Suspended particles such as tiny crumbs up to long fibers generate indoor dust deposits. Inhouse sources are the interior releasing abraded fibers from carpets, bedding and clothing as well as the human itself distributing skin cells, lost hairs and food residues. External sources are finest sand, pollen, exhaust particles and microorganisms (e.g., dust mites). An exposure to heavy metals in certain concentrations may affect the human health and may lead to intoxication, allergies or carcinogenic effects. The heavy metals amount in indoor dust depends on the environmental conditions, requiring a sampling with adequate sampling points and numbers. High sampling numbers ensure good coverage of the area to be examined. Therefore, fast and reliable measurement methods for identification and quantification of the elemental composition are needed. To meet these requirements, a robotic system for automated sample preparation and determination of heavy metals in indoor dust using ICP-MS was developed. The values for repeatability, recovery rate, within-laboratory precision, measurement precision and the limits of detection and quantification were determined for both, the manual and the automated process. Furthermore, the individual process steps and times were compared. Besides the processing of certified reference material, inhouse dust samples from different origin were prepared and measured to give a first overview of the inhouse dust composition. The results show, that the robot-assisted system is well-suited for the heavy metal screening in indoor dust.
1. Introduction
This paper is an extension of “Robot-assisted Measurement of Heavy Metals in Indoor Dust Using ICP-MS” presented at the IEEE International Instrumentation and Measurement Technology Conference (I2MTC) 2021 in Glasgow (virtual) [1]. The focus of this study is related to the determination of the elemental composition of dust in our close environment. In the daily life, dust is omnipresent—outdoors and indoors. Especially, the indoor air quality should be focused since their contamination can be higher than outdoors [2, 3]. Today, urban people spend more than 90% of their time indoors—at home, in schools, offices etc. [4]. Furthermore, indoor dust contains suspended particles from internal origins such as smoking, cooking, fuel combustion and decorative material (e.g., paints, carpets, furniture etc.) and external origins as soil, mining, smelting, industrial activities and vehicular emissions [4-6]. And the human itself and pets can be a dust source by distributing food residues, loose hair and skin particles as well as fibrous material from clothes. Both, inorganic and organic contaminants (e.g., biological material, pesticides, PCBs, PAHs, and heavy metals) can be found in indoor dust and may be absorbed and accumulated in the human organism. The heavy metal amount in household dust can be elevated in comparison to outdoor dust such as pavement dust, road dust or garden soil [4, 7]. Heavy metals cannot be degraded. An exposure to individual high concentrations can impact the human health significantly. Allergies, signs of poisoning and cancer diseases may result [2, 4, 8-10]. Several carcinogenic effects to the respiratory organs, the cardiovascular and nervous system as well as to the growth development were reported [2]. Heavy metals can be uptaken into the body in different ways—oral, over the respiratory organs or the skin. Particularly, kids are endangered since they often play on floors [2, 11].
Due to the wide variety of origins, heavy metals cannot completely be avoided in household dust. Therefore, a monitoring of heavy metal concentrations to determine influencing factors and potential health risks is required. A review from the year 2016 gives a comprehensive insight into multiple studies to determine heavy metals in indoor dust [2]. A widespread study from the year 2021 is based on more than 127 articles published between 1985 and 2019 and shows the spatial distribution, sources, and consequences of heavy metal concentrations in indoor dust [4].
The high number of studies in the field of heavy metal determination in indoor dust show an increasing demand for fast and reliable sample preparation and measurement methods able to process multiple samples in a short time frame. Such measurement methods are “compound-oriented measurements” following the “concept of the pre-, intra- and post-sensory selectivity” [12]. In the next section of this publication, this concept is explained regarding the heavy metal determination in household dust samples. Furthermore, an overview of conventional elemental measurement techniques for heavy metal determination as well as of current automation approaches is given. The existing gap and the aim of this study is explained. The system concept and the system design is printed in the third section. The materials and methods are described in the fourth section. The fifth section shows the validation results, a comparison of the automated analytical measurement and the manual process, including the results for the first exemplarily dust samples collected at various inhouse places. A summary and a forecast to future investigations are provided in the last section.
2. Heavy Metal Measurement
2.1. Compound-oriented Measurements
From a metrological perspective, the qualitative and quantitative analysis of heavy metals in indoor dust is assigned to “compound-oriented measurements” [12]. A wide variety of elemental (e.g., heavy metals) and compound species is existing, and no specific single sensors are available for the individual species. Therefore, a generally applicable concept was developed for determination of single elements and chemical compounds in complex mixtures to reach the required selectivity [12]. The “concept of the pre-, intra-, and post-sensory selectivity” is mainly focused to species which are included in a complex matrix causing interfering signals [12]. In our case, the heavy metals to be measured are embedded in dust—particles, crystals, fibers, biologic material, cells etc.
The “pre-sensory selectivity” is reached in the first step of the concept. The heavy metals to be determined must be separated from the matrix dust. This includes sampling, homogenizing by milling and mixing, weighing, a microwave-assisted acid digestion and a final dilution. After these sample preparation steps, the heavy metals were transferred from the solid dust matrix into a liquid measurement solution. This separation step takes place before the sensor system (pre-sensory selectivity). Inductively coupled plasma mass spectrometry (ICP-MS) was used to achieve a high degree of “intra-sensory selectivity”. The ICP-MS data must be evaluated, interpreted and visualized in the last step to achieve qualitative (identification of metal species) and quantitative information—the “post-sensory selectivity”. Fig. 1 visualizes the individual process steps for heavy metal measurements in dust samples and shows the relationship to the “concept of the pre-, intra- and post-sensory selectivity”.
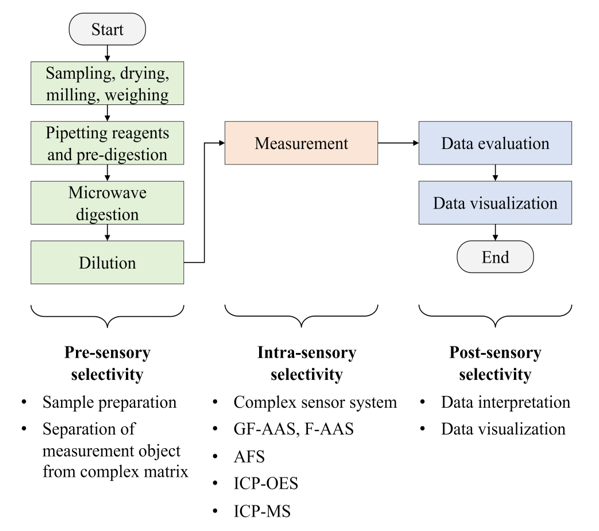
Figure 1: Process steps for heavy metal measurements in dust samples and their relationship to the “concept of the pre-, intra-, and post-sensory selectivity” (abbreviations: GF-AAS—graphite furnace atomic absorption spectroscopy, F-AAS—flame atomic absorption spectroscopy, AFS—atomic fluorescence spectroscopy, ICP-OES—optical emission spectroscopy with inductively coupled plasma, ICP-MS—mass spectrometry with inductively coupled plasma)
2.2. Measurement Methods
The decision for the selection of an analytical measurement technique always depends on the elements (metals) and the aim of investigation [13, 14]. Standardized methods are available from the German Institute for Standardization (Deutsches Institut für Normung e.V., DIN) for the determination of heavy metals in particles of airborne dust, in exhaust gases and atmospheric air [15-17]. The Association of German Engineers (Verein Deutscher Ingenieure, VDI) published standardized methods in German and English for the determination of multiple single elements in particulate matter and in suspended matter in ambient air [18-26]. The solid particles require a special sample preparation before the measurement. Some elements, such as arsenic, antimony, and selenium were separated from the dust matrix into their volatile hydrides for measurement in gaseous form [19]. Mercury can be sorbed into amalgam and then be converted into mercury cold vapor for measurement [25]. For the most elements, such as heavy metals, a digestion is required to transfer them from the solid matrix into a liquid form. An acid digestion is a common procedure performed in different ways such as open, thermal or microwave-assisted digestions using a wide variety of acids or acid mixtures (e.g., hydrofluoric acid, aqua regia or nitric acid with hydrogen peroxide) [13, 23]. The qualitative and quantitative determination of heavy metals is mostly performed using optical spectroscopy such as graphite-furnace atomic absorption spectroscopy (GF-AAS), flame atomic absorption spectroscopy (F-AAS), atomic fluorescence spectroscopy (AFS), and optical emission spectroscopy with inductively coupled plasma (ICP-OES). Mass spectrometry (ICP-MS) has gained more and more importance in the last decades and have been established for heavy metal measurements [15-26].
2.3. Automated Sample Preparation and Measurement
Today, screening systems show a high degree of automation in the fields of biotechnology, pharmacy and high-throughput applications. In contrast, the automation degree in the field of compound-oriented measurements is still low. Multiple—and often changing—process steps with complex sub-processes, single vessels varying in size and design, harsh processing environments (e.g., high pressures, high temperatures, toxic reagents, high-concentrated acids, organic solvents etc.) and special laboratory devices such as heating plates, coolers, incubators, shakers, centrifuges etc. must be integrated into the automation system. A further challenge is the flexibility—to run multiple applications at one automation system to make it more economically for analytical laboratories.
Only few automation solutions have been established in elemental measurements. Typically, the existing automation systems are often specialized to an individual application. Mercury analyzers are one example for automated sample preparation, sample introduction and measurement using AAS and AFS—sometimes coupled with the cold vapor technique. The advanced mercury analyzer AMA 254 (LECO company, Geleen, Netherlands) was designed for the determination of mercury trace amounts in liquid and solid samples [6]. It uses a technique of direct combustion to decompose the sample in an oxygen-rich environment and to remove interfering elements. The mercury amount is determined using a gold amalgamator trap and a spectrophotometer [27]. The advantage is a very sensitive mercury determination in different samples (solids and liquids) without additional chemical sample preparation [6]. Another automated mercury analyzer is the DMA-80 L (MLS-MWS Laboratory Solutions, Leutkirch im Allgäu, Germany) which uses the cold vapor technique [28]. Both devices are limited to the element mercury and therefore limited in their flexibility.
ICP-OES and ICP-MS are predestinated for measurement of multiple elements in a short time frame, since they allow simultaneous determination of numerous elements. In general, those instruments process samples in liquid and gaseous state. The measurement of solid samples typically requires a previous sample pretreatment, such as a microwave-assisted acid digestion. One example of a commercial automation system is the MiniLab (Rohasys Robotic and Handling Systems & Rouwette Consultancy, Spaubeek, Netherlands) for the automated sample preparation of solid samples using an aqua regia digestion [29]. Mercury and other heavy metals can then be measured using ICP-OES or ICP-MS. Another example for automation in elemental analysis is the implementation of flow-injection systems for automated sample introduction and adding of the internal standard prior to the measurement using ICP-OES [30]. This automation solution significantly increases the instrument’s performance and precision and is today integrated into the majority of commercial ICP-MS and ICP-OES instruments.
The automation solutions mentioned before are limited in their flexibility—the systems are designed for a special functionality or for a special application. The aim of the authors of this study is the development of flexible automation systems for “compound-oriented measurements”, which are not limited to a special application and which can be applied to elemental and structural measurement tasks. A first version of the robotic system was introduced for the sample preparation of waste wood samples and the determination of mercury using ICP-OES and ICP-MS [31-34]. The automation system was extended for the preparation of animal and human bone samples for the determination of calcium and phosphor using ICP-MS to support the recent osteoporosis research [35]. For a further enhancement of the methodological scope, the system was modified and extended to perform the sample preparation for both elemental and structural measurements. Incrustations of clogged biliary endoprostheses as well as pig bile were automatically prepared for the determination of trace metals using ICP-MS and for the determination of cholesterol using GC/MS to support the development of more compatible biliary endoprostheses [36-39]. The robotic system was recently extended to perform the sample preparation of human tissue samples for subsequent heavy metal measurements to support arthrosis treatment by joint implants [40, 41].
This study is focused on the investigation of the close indoor environment. The robotic system was expanded to include an automated screening setup for heavy metal determination in indoor dust. New labware was designed and integrated. New sample processing procedures for the individual automation stations and process control methods were developed. The method development was challenging since common sample preparation procedures for dust samples include a digestion using hydrofluoric acid—recommended for certain heavy metals [13, 14, 42, 43]. Special trained staff as well as special safety devices for the laboratory equipment and instruments are therefore required. In this study, an automated screening method for the determination of heavy metals in indoor dust samples was developed as previously presented [1, 44]. This includes the development of the manual sample preparation method and ICP-MS measurement method [1, 44]. The sample pretreatment (microwave-assisted digestion) was done with nitric acid and hydrogen peroxide; the use of hydrofluoric acid was avoided. Samples with conspicuous results acquired in the screening can then be confirmed by the manual standard method with hydrofluoric acid. As a result, overall processing times and financial resources can be reduced. Furthermore, this study presents a very flexible robot-assisted sample preparation system, which is adaptable to multiple application areas. This promising automation concept enables small and middle analytical laboratories to install such a robotic system and to use it for different tasks, increasing the overall laboratories’ efficiency, economy, and safety.
3. System Concept and System Design
3.1. Robotic Sample Preparation System
The robotic sample preparation system was designed according to the automation concept of the “central system integrator” with a decentralized, open structure [45, 46]. For connecting the individual automation stations (e.g., storage system, different liquid handling devices etc.) two ORCA laboratory robots (Beckman Coulter, Krefeld, Germany) were integrated. These two articulated robots move on orthogonal linear rails and transfer labware with samples and reagents between the stations. A labware transfer station is mounted at the crossing area of the linear rails, enabling the take-over of labware from one robot to the other one. A barcode reader is included for identification of the labware. Two further stations are used for liquid handling and dosing. The Biomek 2000 (Beckman Coulter, Krefeld, Germany) is a liquid handling station for dosing liquids in volumes up to 1,000 µL. The single-vial liquid handler is used for higher liquid volumes (max. 10 mL). Especially in dilution tasks, this large-volume dispenser reduces pipetting steps and processing time. The automation system was designed in a decentralized structure distributed over three laboratories. The microwave digestion device Mars 5 (CEM, Kamp-Lintfort, Germany) is located in a separate laboratory close to the robotic system. The measurement instrument ICP-MS 7700x (Agilent Technologies, Waldbronn, Germany) is installed in another laboratory. The automation system and the additional instruments are equipped with a labware transfer station. These stations allow the access by both—by laboratory assistants and alternatively by mobile robots. The storage system consists of 196 positions for labware in the standard microplate footprint to provide chemicals, standards and labware required for the process run. Figure 2 shows the robotic sample preparation system as a 3D CAD drawing.
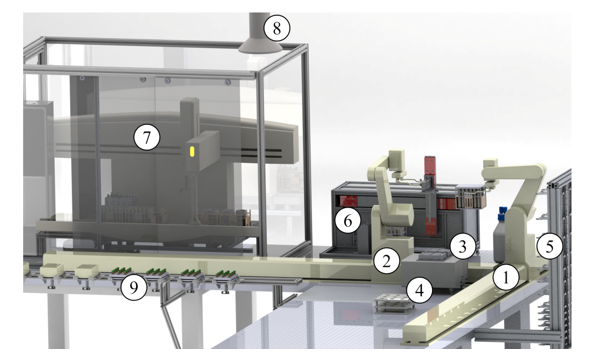
Figure 2: Robotic system for automated sample preparation—laboratory robots moving on linear rail (1) in front of the storage system and (2) in front of liquid handling stations, (3) labware transfer station between two robots, (4) additional rack and thermo shaker on workbench, (5) storage system for chemicals and labware, (6) single-vial liquid handler, (7) liquid handler Biomek 2000 with safety housing and, (8) exhaust system, (9) labware transfer station to laboratory staff or to mobile robots
In general, the labware required in sample preparation tasks for analytical measurements (e.g., microwave vessels, autosampler vials) are not designed in the standard microplate format. Several single vessels, beakers, flasks, and vials with different designs, volumes, lids, and screw caps are required. To ensure a safe labware handling by the ORCA laboratory robots, several racks were designed in the standard microplate format to arrange multiple single vessels. For the sample preparation process of dust samples four racks each with six microwave digestion vessels Xpress (vol. 25 mL, CEM, Kamp-Lintfort, Germany) and one solid lid (cover) for simultaneous covering all six vessels were constructed. These vessels are used to store the powdery samples and for the microwave digestion. Additional covers with six holes were constructed to reduce the evaporation of acid fumes and nitrous gases during the pipetting steps after the microwave digestion [1]. The digestion reagents are provided in another rack with two beakers (PFA, vol. 100 mL) for nitric acid and hydrogen peroxide (the beaker contains a smaller insert with a lower volume of 25 mL). The final—with ultrapure water diluted—measurement solutions are stored in 24 tubes (PP, vol. 14 mL) arranged at a further rack with a solid lid. Table 1 gives an overview of the labware arranged in the special designed racks.
Table 1: Special designed racks in microplate footprint (aluminum body, chemical resistant lid made of PTFE) enabling robotic handling of different numbers of single vessels with various volumes and shapes
| Description | CAD drawing | |
| unlidded
(top view) |
closed
(front view) |
|
| 6 microwave vessels Xpress (vol. 25 mL) | ||
| 2 beakers for storing nitric acid (left: vol. 100 mL) and hydrogen peroxide (right: insert with 25 mL) | ||
| 24 tubes for diluted samples/measurement solutions (vol. 14 mL) | ||
3.2. Multi-level Software System
A multi-level software system is required to schedule and to control multiple automated workflows supported by robotic systems, on measurement instrumentation as well as in interaction with human operators and mobile transportation robots [45]. The overall process with individual subprocesses—sample preparation of dust specimens including robot-assisted liquid handling and microwave digestion, the ICP-MS measurements, transportation steps as well as data processing and visualization—is managed by the high-level workflow management system [47]. The subprocesses supported by robots were controlled by the process control software “SAMI Workstation Ex 4.0” (Beckman Coulter, Krefeld, Germany) representing the middle-level software. The human operator defines the type of the labware, their source position and their destination. Furthermore, the individual substations (e.g., liquid handling) were selected. Finally, the entire workflow of each subprocess is saved in a SAMI method file, which will be executed in the process run. The lowest level of the software system is formed by the device software of the individual substations. The Biomek 2000 software (Beckman Coulter, Krefeld, Germany) is used to control the liquid handler Biomek 2000. The human operator defines the deck layout as well as the detailed pipetting parameters and saves them in a Biomek method file. The single vial-liquid handler is controlled by an inhouse-developed software module [45].
3.3. Automation
The entire automated process of dust sample preparation and measurement is divided in multiple subprocesses. In the first subprocess “Pre-digestion”, the reagents and samples were transported by the ORCA laboratory robots to the liquid handler Biomek 2000. The reagents are added to the solid samples and the pre-digestion over 20 min is performed using the Biomek 2000. In the second subprocess “Microwave digestion” a human operator closes the microwave vessels, starts the automated digestion run and opens the vessels after cooling down. The third subprocess “Dispensing” is carried out in parallel the robotic system. The ORCA laboratory robots transport empty vials to the single-vial liquid handler and ultrapure water is automatically dispensed. Finally, one ORCA laboratory robot transports the rack with water to the Biomek 2000. In the fourth subprocess “Dilution”, the digestion solutions were pipetted into the vials—previously filled with water—and mixed the liquids using the Biomek 2000. After this, the samples are ready for the subprocesses “Measurement” and “Data Evaluation and Visualization”. Two top processes were created—for simultaneously processing of 12 and alternatively 24 samples. A more detailed description of the automated subprocesses is given in section 5.2.
4. Materials and Methods
4.1. Standards and Chemicals
The certified reference material (CRM) of indoor dust SRM 2583 (NIST, Gaithersburg (MD), United States) was purchased from Sigma Aldrich/Merck (Darmstadt, Germany). Nitric acid (HNO3) and 30% stabilized hydrogen peroxide (H2O2)—both in suprapure quality (RotipuranÒ)—were purchased from Carl-Roth (Karlsruhe, Germany). The ICP multi-element standard IV and ICP single-element standards for As, Hg, Lu and Re were from Merck (Darmstadt, Germany).
4.2. Sample Preparation Using Microwave Digestion
The certified reference material SRM 2583 (fine dust powder) was directly weighted (30 mg) into a microwave digestion vessel Xpress with a volume of 25 mL (CEM, Kamp-Lintfort, Germany). Dust samples—collected by the authors at different inhouse locations—were previously dried and pulverized using an oscillating mill MM2000 (Retsch, Haan, Germany). Three stirring balls (PTFE, diameter 6 mm) from Bola (Grünsfeld, Germany) were added to each sample in a microwave digestion vessel. Nitric acid was used as digestion reagent. To correct evaporation effects during the microwave digestion, Rhenium (Re) was added to the nitric acid as internal standard (ISTD) with a concentration of 1.25 mg/L (after sample processing 80 µg/L). A volume of 2.4 mL of HNO3 with ISTD and 0.6 mL of H2O2 were pipetted to the powdery samples. The vessels were closed after a rest of 20 minutes without lids. The Mars 5 device (CEM, Kamp-Lintfort, Germany) is used for the microwave digestion with the following temperature-time program: room temperature to 180 °C (356 °F) in 20 min, 180 °C to 220 °C (428 °F) in 20 min and a hold time at 220 °C (428 °F) for 20 min. After cooling down and opening the vessels, the samples were diluted with ultrapure water.
4.3. ICP-MS Measurement Parameters
The ICP-MS 7700x was operated with the autosampler ASX-500 (Cetac, Omaha (NE), United States) for automated sample introduction. The data were acquired using the MassHunter Workstation Software for 7700 ICP-MS G7201C Version C.01.04 (Agilent Technologies, Waldbronn, Germany) and the data interpretation and statistical evaluations were done using the in-house developed software module “Analytical Data Evaluation” (ADE)—a web application running at all operating systems [48, 49].
The calibration was generated with five standard solutions (concentrations 1, 5, 10, 50 and 100 µg/L for Li, Be, V, Cr, Co, Ni, As, Sr, Ag, Cd, Tl, and Pb). Mercury was added to the respective standard solution with 0.01, 0.05, 0.10, 0.50 and 1.00 µg/L. The ICP-MS was operated with the following parameters: 1,550 W RF power, 10 mm sample depth, 1.05 L/min nebulizer gas flow, 0.10 rps nebulizer pump speed, 13 °C (55.4 °C) spray chamber temperature, argon as plasma and nebulizer gas, and 4.3 mL/min collision cell helium flow. The data were acquired with three repetitions (0.3 sec integration time). The autosampler probe was flushed after each measurement first with HNO3/HCl (5%/1%) followed by HNO3 (8%). After the last measurement, the probe was finally flushed with water.
5. Results and Discussion
5.1. Manual Sample Preparation and Measurement
The manual sample preparation and measurement method was validated before the transfer to the automation system. The validation was focused on several parameters [33, 36, 45]. The repeatability and the recovery rate were determined with 23 standard samples of the certified reference material (CRM) NIST SRM 2583 and one blank—prepared and measured at one day. The within-laboratory precision was determined with ten daily prepared and measured CRM samples—this procedure was performed on five different days. The measurement precision of the ICP-MS was determined by measuring one sample ten times. The limit of detection (LOD) and the limit of quantification (LOQ) were established by measuring ten blanks samples, which previously gone through the whole sample preparation process. The validation results were previously published [44].
5.2. Automated Sample Preparation and Measurement
In the first subprocess “Pre-digestion” the racks providing reagents in beakers and solid samples in microwave digestions vessels were transported from the storage system to the deck of the liquid handling station Biomek 2000 using the two ORCA laboratory robots and the robot transfer station. At the Biomek 2000, the reagents (nitric acid and hydrogen peroxide) were added to the samples. After a rest over 20 min with open vessels, the racks were covered and provided on the sample transfer station. The second subprocess “Microwave digestion” requires the support of a human operator for closing the individual microwave vessels and starting the microwave digestion run. After cooling down, the screw caps of the vessels were manually removed, the vessels arranged in the racks and the racks lidded with a special perforated cover [1].Then the racks were directly provided on the deck of the Biomek 2000. In parallel processing to the microwave digestion, the third subprocess “Dispensing” is carried out using the robotic
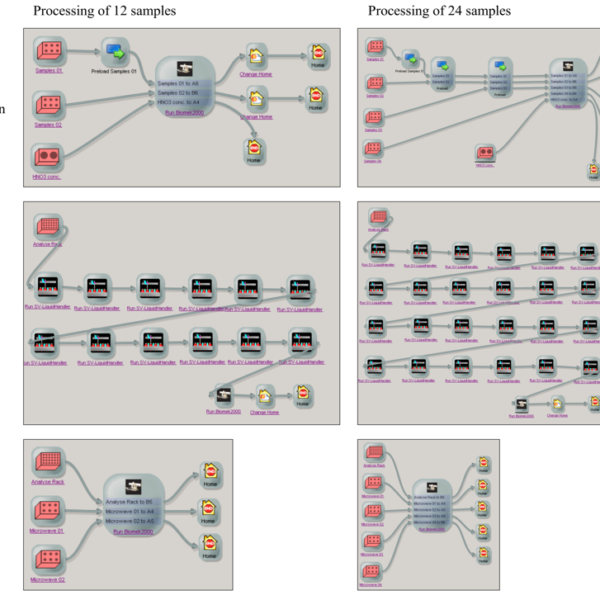
Figure 3: SAMI Ex Editor with subprocesses of the automated preparation of 12 samples arranged on two racks (left) and 24 samples arranged on four racks (right)—Pre-digestion, dispensing and dilution
system. First, the lidded rack with empty vials is transported from the storage system to the deck of the single-vial liquid handler station using the ORCA laboratory robots. The lid is removed by one ORCA laboratory robot, ultrapure water automatically dispensed into the empty vials and the rack is covered again by the robot. Finally, the rack with the water-filled vials is transported by the robot to the deck of the liquid handler Biomek 2000. Figure 3 shows the SAMI methods for the preparation of 12 and 24 samples.
The digestion solutions were diluted with ultrapure water in the fourth subprocess “Dilution” to adjust the acid concentration for the subsequent measurement. The digestion solutions were aspirated through the perforated lids and dispensed into the water-filled vials. The liquids were well mixed by multiple aspiration/dispensing. After this, the rack is lidded and the samples are ready for the subprocesses “Measurement” and “Data Evaluation and Visualization”.
The rack with the measurement solutions is transported to the ICP-MS, which is located in a separate laboratory. The transport can be performed either manually or automated using mobile robots [50].
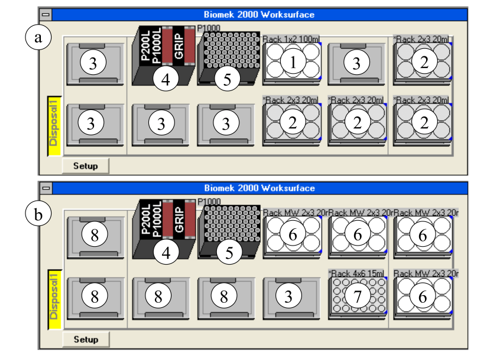
Figure 4: Deck layout of the Biomek 2000 for processing 24 dust samples—(a) pre-digestion, (b) dilution, (1) rack with nitric acid and hydrogen peroxide, (2) lidded racks with samples, (3) free positions for lids, (4) tool rack, (5) tip box, (6) racks with digestion solutions and perforated lids, (7) water filled tubes for measurement solutions, (8) free positions
The sample rack is positioned into the ICP-MS autosampler and the automated sample introduction and measurements are started. After finishing, the data were automatically evaluated [49]. Figure 4 shows the deck layout of the liquid handler Biomek 2000 for the subprocesses “Pre-digestion” and “Dilution” for the processing of 24 dust samples.
5.3. Validation of the Automated Process
The validation parameters were determined similar to the manual method validation. The repeatability and the recovery rate were determined with 23 CRM samples and one blank arranged in four racks. The repeatability showed coefficients of variation (CV) for the elements chromium, arsenic, cadmium, and mercury which were in good accordance to the certified values. The CV values were slightly higher (+0.26%) for lead. The average recovery rates were determined for arsenic with 93.9%, for cadmium with 82.9% and for lead with 82.04%. The average recovery rates of chromium and mercury were lower, with values of 56.3% (Cr) and 66.4% (Hg). To increase the recovery rates, the use of a stronger acid mixture with hydrofluoric acid in the microwave digestion is recommended [13, 14, 42, 43]. In this automation approach, a hydrofluoric acid digestion was avoided for safety reasons. The automated process is performed on a technical system with mechanical and electronical components sensitive to corrosive acids. The technical equipment and the laboratory staff must be protected, and additional safety equipment would be required.
The within-laboratory precision was determined with 11 CRM samples and one blank prepared at five days. Two racks were used in each method run. The resulting CV values are in good accordance to the certified values for Cr, As, and Cd. The concentration uncertainties of the CRM were given for chromium (±27.5%) arsenic (±22.9%) and cadmium (±50.7%). The CV values for the lead concentration were slightly higher than certified. The method presented is a rapid screening method—therefore, a CV value lower than 15% can be accepted. The measurement precision—determined using ten measurements of one sample—showed results in the expected range (<2%). The limits of detection and quantification were determined with the preparation and measurement of 10 blank samples. The LOD values were determined for the measurement solutions with 180.7 ng/L (Cr), 10.2 ng/L (As), 3.7 ng/L (Cd), 6.5 ng/L (Hg), and 14.5 ng/L (Pb) and for the solid dust material with 225.9 µg/kg (Cr), 12.7 µg/kg (As), 4.6 µg/kg (Cd), 8.1 µg/kg (Hg), and 18.2 µg/kg (Pb). The LOQ values were determined for the measurement solutions with 423.2 ng/L (Cr), 25.8 ng/L (As), 9.2 ng/L (Cd), 12.1 ng/L (Hg), and 27.3 ng/L (Pb) and for the solid dust material with 529.0 µg/kg (Cr), 32.2 µg/kg (As), 11.6 µg/kg (Cd), 15.2 µg/kg (Hg), and 34.2 µg/kg (Pb). The validation results for the certified elements Cr, As, Cd, Hg, and Pb are summarized in Table 2.
In this extended version of the study, the results of additional elements are presented (Li, B, V, Co, Ni, Sr, Ag, and Tl). The average concentrations range from 0.045 mg/kg (Tl) to 65.25 mg/kg (Sr). The repeatability showed coefficients of variation ranging from 3.97% (Li) to 13.28% (Ni). Only Ag has a higher CV value of 36.75%. Certified values for these additional elements are not available for the CRM used in this study. For this reason, the values provided have merely informative character. The precision values of the non-certified elements were similar to the certified elements, and this shows the ability of the automated method to measure more than the certified elements. Additional determination of the recovery rate would be required to confirm the true value.
The measurement precision was determined with 10 repetition measurements of the same sample. The LOD and LOQ values were determined with 10 blank samples for both the measurement solutions and the solid dust material. The entire validation results for the non-certified elements are also included in Table 2.
5.4. Comparison of Manual and Automated Measurements and Literature Values
Comparison of the process steps: A volume of 2.4 mL HNO3 is given to the powdery samples. Only one step is needed in manual processing. The liquid handler Biomek 2000 has a maximum pipetting volume of 1 mL. For this reason, three steps each with 0.8 mL are required to add the digestion acid. After the microwave digestion, a volume of 2 mL sample solution is manually diluted with 23 mL water. Therefore, water is dispensed in three steps with volumes of 10 mL, 10 mL, and 3 mL. The sample solution is then added in one step and mixed with the water. This dilution step was miniaturized in the automated procedure. The single-vial liquid handler dispenses a volume of 5.75 mL water in one step. Then a volume of 0.5 mL sample solution is added to the water and mixed by the Biomek 2000. This miniaturization has an additional advantage. Due to the smaller total volume of the final measurement solutions—vials with a volume of 30 mL were reduced to vials with 14 mL—more vials can be arranged on one rack.
Only six large volume vials can be placed on one rack, but 24 low-volume vials. This allows a higher sample throughput due to the reduced transportation steps for multiple racks. Table 3 summarizes the numbers of manual and automated process steps.
Comparison of the processing times: The entire processing times of the manual and automated processing were determined with the preparation of 12 samples. The duration of the automated measurement process is 15.5 min longer than the manual procedure executed with trained laboratory staff. Typically, the human operator arranges all required equipment on the workbench. Special transportation steps between a storage system and individual liquid handling stations are not required.
Furthermore, the tool change process of the liquid handler Biomek 2000 (e.g., from gripper tool for lid handling to pipetting tool and return) needs additional time. A human uses it hands for lid handling and operating the pipette. This time delay—between manual and automated operation—can be avoided by a suitable process scheduling with parallel and overlapping runs. Nevertheless, the laboratory assistant is free in the time of the automated run and can perform other tasks in parallel. Furthermore, the automated process can run during the staff’s break times. In summary, despite the slightly longer processing time of the automated process, the laboratories efficiency and the throughput can be increased. Table 4 compares the processing times for the individual process steps and for the entire process as well as the operators in the manual and the automated procedure.
Table 2: Validation results of the automated measurement method in comparison to the certified values of the indoor dust CRM NIST SRM 2583
| 7Li | 9Be | 51V | 52Cr | 59Co | 60Ni | 75As | 88Sr | 107Ag | 111Cd | 202Hg | 205Tl | 208Pb | |
| Repeatability (n=23) | |||||||||||||
| Average [mg/kg] | 12.48 | 0.23 | 13.13 | 45.02 | 3.73 | 44.41 | 6.57 | 65.25 | 1.13 | 6.05 | 1.04 | 0.045 | 70.48 |
| STDEV [mg/kg] | 0.49 | 0.02 | 0.54 | 3.09 | 0.33 | 5.90 | 0.26 | 5.02 | 0.41 | 2.15 | 0.11 | 0.004 | 6.11 |
| CV [%] | 3.97 | 7.24 | 4.09 | 6.87 | 8.76 | 13.28 | 3.94 | 7.70 | 36.75 | 35.45 | 10.47 | 7.93 | 8.66 |
| Recovery rate (n=23) | |||||||||||||
| Average [%] | n.a. | n.a. | n.a. | 56.27 | n.a. | n.a. | 93.90 | n.a. | n.a. | 82.89 | 66.44 | n.a. | 82.04 |
| Min [%] | n.a. | n.a. | n.a. | 48.55 | n.a. | n.a. | 86.97 | n.a. | n.a. | 56.11 | 60.58 | n.a. | 71.73 |
| Max [%] | n.a. | n.a. | n.a. | 64.84 | n.a. | n.a. | 100.33 | n.a. | n.a. | 171.37 | 94.01 | n.a. | 99.73 |
| Within-laboratory precision (n=11, 5 days) | |||||||||||||
| Max. average [mg/kg] | 14.98 | 0.29 | 16.15 | 56.18 | 4.46 | 54.10 | 7.42 | 81.51 | 1.29 | 8.31 | 1.43 | 0.061 | 79.15 |
| Min. average [mg/kg] | 13.90 | 0.25 | 15.07 | 50.64 | 3.87 | 45.85 | 6.74 | 70.69 | 0.94 | 6.10 | 0.92 | 0.056 | 68.68 |
| Max. CV [%] | 11.29 | 11.40 | 11.47 | 14.18 | 28.32 | 30.78 | 10.28 | 19.12 | 40.70 | 58.92 | 49.39 | 10.30 | 14.69 |
| Min. CV [%] | 1.85 | 5.37 | 3.16 | 5.77 | 4.88 | 14.65 | 4.04 | 1.17 | 24.50 | 21.88 | 5.26 | 5.20 | 5.70 |
| Measurement precision (n=1, 10 measurements) | |||||||||||||
| CV [%] | 0.59 | 5.41 | 0.94 | 0.66 | 0.72 | 0.77 | 1.16 | 0.46 | 0.74 | 0.80 | 1.99 | 2.58 | 0.41 |
| Analytical LOD and LOQ (in measurement solution) | |||||||||||||
| LOD [ng/L] | 28.1 | 3.8 | 121.5 | 180.7 | 6.3 | 109.4 | 10.2 | 178.6 | 11.7 | 3.7 | 6.5 | 9.8 | 14.5 |
| LOQ [ng/L] | 45.7 | 9.1 | 152.5 | 423.2 | 13.6 | 253.9 | 25.8 | 418.3 | 20.8 | 9.2 | 12.1 | 14.2 | 27.3 |
| Methodical LOD and LOQ (in solid dust samples) | |||||||||||||
| LOD [µg/kg] | 35.1 | 4.8 | 151.8 | 225.9 | 7.9 | 136.7 | 12.7 | 223.3 | 14.7 | 4.6 | 8.1 | 12.3 | 18.2 |
| LOQ [µg/kg] | 57.1 | 11.4 | 190.6 | 529.0 | 16.9 | 317.4 | 32.2 | 522.8 | 26.0 | 11.6 | 15.2 | 17.8 | 34.2 |
| Certified values of NIST SRM 2583 | |||||||||||||
| Average [mg/kg] | n.a. | n.a. | n.a. | 80 | n.a. | n.a. | 7 | n.a. | n.a. | 7.3 | 1.56 | n.a. | 85.9 |
| Uncertainty [mg/kg] | n.a. | n.a. | n.a. | ±22 | n.a. | n.a. | ±1.6 | n.a. | n.a. | ±3.7 | ±0.19 | n.a. | ±7.2 |
| Uncertainty [%] | n.a. | n.a. | n.a. | ±27.5 | n.a. | n.a. | ±22.9 | n.a. | n.a. | ±50.7 | ±12.80 | n.a. | ±8.4 |
Table 3: Manual and automated process steps (1 sample) [1]
| Process Step | Manual | Automated | ||
| Volume
[mL] |
Steps | Volume
[mL] |
Steps | |
| Pipetting HNO3 | 2.40 | 1 | 0.80 | 3 |
| 0.80 | ||||
| 0.80 | ||||
| Pipetting H2O2 | 0.60 | 1 | 0.60 | 1 |
| Dispensing H2O | 10.00 | 3 | 5.75 | 1 |
| 10.00 | ||||
| 3.00 | ||||
| Pipetting digested sample solution | 2.00 | 1 | 0.50 | 1 |
Table 4: Processing times and operators in manual and automated sample preparation and measurement (12 samples) [1]
| Process step | Manually | Automated | ||
| Processing time
[min] |
Operator | Processing time
[min] |
Operator | |
| Initial transport (labware, reagents) | 2.0 | Human laboratory assistant | 3.5 | 2 ORCA laboratory robots |
| Pipetting HNO3 | 1.0 | Human laboratory assistant | 8.5 | Biomek 2000 liquid handler |
| Pipetting H2O2 | 1.0 | Human laboratory assistant | 2.0 | Biomek 2000 liquid handler |
| Pre-digestion | 20.0 | Waiting time | 20.0 | Waiting time |
| Closing vessels (manually) | 2.0 | Human laboratory assistant | 2.0 | Human laboratory assistant |
| Microwave digestion, cool down | 90.0 | Microwave device | 90.0 | Microwave device |
| Opening vessels (manually) | 4.0 | Human laboratory assistant | 4.0 | Human laboratory assistant |
| Dispensing water (performed in parallel to microwave digestion) | (3.5)
not included in calculation |
Human laboratory assistant | (6.5)
not included in calculation |
Single-vial liquid handler |
| Pipetting of digestion solution, mixing | 4.5 | Human laboratory assistant | 10.0 | Biomek 2000 liquid handler |
| ICP-MS measurement (12 samples) | 54.0 | ICP-MS equipped with autosampler | 54.0 | ICP-MS equipped with autosampler |
| Total processing time | 178.5 | 194.0 | ||
Table 5: Measurement results of dust samples collected in laboratories and offices (samples 1-7, 12), in private households (samples 8-11, 21), in old disused garden houses (samples 13-20), and in high school locations (22-32); (n.a.: not acquired)
| No. | 7Li
[mg/kg] |
9Be
[mg/kg] |
51V
[mg/kg] |
52Cr
[mg/kg] |
59Co
[mg/kg] |
60Ni
[mg/kg] |
75As
[mg/kg] |
88Sr
[mg/kg] |
107Ag
[mg/kg] |
111Cd
[mg/kg] |
202Hg
[mg/kg] |
205Tl
[mg/kg] |
208Pb
[mg/kg] |
| 1 | 18.29 | n.a. | n.a. | 34.86 | 0.99 | 5.87 | n.a. | 334.81 | 0.28 | 0.21 | n.a. | n.a. | 9.66 |
| 2 | 26.99 | n.a. | n.a. | 28.42 | 0.58 | 4.43 | n.a. | 15.73 | 0.28 | 0.13 | n.a. | n.a. | 3.41 |
| 3 | 62.28 | n.a. | n.a. | 23.79 | 0.55 | 14.97 | n.a. | 14.52 | 0.35 | 3.87 | n.a. | n.a. | 12.39 |
| 4 | 7.33 | n.a. | n.a. | 97.22 | 1.11 | 9.23 | n.a. | 41.59 | 0.35 | 0.19 | n.a. | n.a. | 13.07 |
| 5 | 12.89 | n.a. | n.a. | 89.73 | 1.77 | 19.60 | n.a. | 22.86 | 0.58 | 0.83 | n.a. | n.a. | 40.13 |
| 6 | 7.80 | n.a. | n.a. | 195.61 | 1.49 | 6.99 | n.a. | 17.22 | 0.39 | 0.23 | n.a. | n.a. | 7.07 |
| 7 | 6.48 | n.a. | n.a. | 63.48 | 0.81 | 4.60 | n.a. | 11.43 | 0.13 | 0.17 | n.a. | n.a. | 3.45 |
| 8 | 7.92 | n.a. | n.a. | 30.67 | 1.14 | 6.87 | n.a. | 37.33 | 0.20 | 0.21 | n.a. | n.a. | 5.13 |
| 9 | 0.76 | n.a. | n.a. | 5.47 | 0.64 | 5.52 | n.a. | 13.24 | 0.18 | 0.20 | n.a. | n.a. | 5.79 |
| 10 | 1.07 | n.a. | n.a. | 5.87 | 0.47 | 6.11 | n.a. | 16.46 | 0.43 | 0.15 | n.a. | n.a. | 6.68 |
| 11 | 2.18 | n.a. | n.a. | 15.12 | 1.30 | 4.03 | n.a. | 17.73 | 0.36 | 0.10 | n.a. | n.a. | 8.09 |
| 12 | 14.61 | n.a. | n.a. | 69.44 | 3.36 | 45.90 | n.a. | 91.79 | 1.59 | 0.84 | n.a. | n.a. | 35.28 |
| 13 | 3.20 | n.a. | n.a. | 39.31 | 1.86 | 6.24 | n.a. | 37.48 | 0.09 | 6.11 | n.a. | n.a. | 2,779.47 |
| 14 | 6.79 | n.a. | n.a. | 36.77 | 14.13 | 14.07 | n.a. | 180.51 | 0.23 | 4.38 | n.a. | n.a. | 158.43 |
| 15 | 6.21 | n.a. | n.a. | 100.81 | 5.33 | 15.20 | n.a. | 98.84 | 0.36 | 2.47 | n.a. | n.a. | 114.51 |
| 16 | 3.65 | n.a. | n.a. | 29.61 | 5.34 | 17.89 | n.a. | 65.91 | 0.46 | 5.94 | n.a. | n.a. | 620.00 |
| 17 | 6.56 | n.a. | n.a. | 227.95 | 6.82 | 129.53 | n.a. | 127.61 | 0.08 | 1.80 | n.a. | n.a. | 164.50 |
| 18 | 10.90 | n.a. | n.a. | 29.78 | 3.83 | 27.52 | n.a. | 183.32 | 0.23 | 5.86 | n.a. | n.a. | 68.08 |
| 19 | 4.21 | n.a. | n.a. | 43.85 | 2.88 | 189.28 | n.a. | 72.15 | 0.34 | 15.39 | n.a. | n.a. | 354.79 |
| 20 | 0.46 | n.a. | n.a. | 13.93 | 0.30 | 1.81 | n.a. | 55.88 | <LOD | 0.04 | n.a. | n.a. | 3.77 |
| 21 | 0.57 | n.a. | n.a. | 10.59 | 0.25 | 2.91 | n.a. | 11.95 | 0.55 | 0.11 | n.a. | n.a. | 3.20 |
| 22 | 2.88 | 0.09 | 5.37 | 49.84 | 1.67 | 48.20 | 1.15 | 33.74 | 2.46 | 0.75 | 0.15 | 0.04 | 13.93 |
| 23 | 3.12 | 0.04 | 2.48 | 54.06 | 4.05 | 13.25 | 9.89 | 40.08 | 2.59 | 1.12 | 0.20 | 0.03 | 53.30 |
| 24 | 1.96 | 0.07 | 2.45 | 56.36 | 1.28 | 14.38 | 0.97 | 46.72 | 5.83 | 1.79 | 0.15 | 0.04 | 20.70 |
| 25 | 13.68 | 0.58 | 10.82 | 37.93 | 4.29 | 10.76 | 5.18 | 54.26 | 1.19 | 0.70 | 0.11 | 0.14 | 9.92 |
| 26 | 3.38 | 0.11 | 3.89 | 86.86 | 1.33 | 8.31 | 0.94 | 46.84 | 0.55 | 0.26 | 0.05 | 0.03 | 7.74 |
| 27 | 7.37 | 0.10 | 4.49 | 41.27 | 2.67 | 78.93 | 0.97 | 57.52 | 4.49 | 0.54 | 0.28 | 0.04 | 21.93 |
| 28 | 0.60 | 0.01 | 0.63 | 117.17 | 1.05 | 8.59 | 0.20 | 10.17 | 2.16 | 0.75 | 0.03 | 0.01 | 3.43 |
| 29 | 3.18 | 0.10 | 3.57 | 64.98 | 1.44 | 16.04 | 0.84 | 44.85 | 0.49 | 1.09 | 0.04 | 0.03 | 23.94 |
| 30 | 3.56 | 0.13 | 6.97 | 81.12 | 3.59 | 16.13 | 1.92 | 73.19 | 0.88 | 1.17 | 0.10 | 0.06 | 196.30 |
| 31 | 2.62 | 0.09 | 2.97 | 122.83 | 1.75 | 8.17 | 0.68 | 33.72 | 1.36 | 0.62 | 0.08 | 0.03 | 9.87 |
| 32 | 11.97 | 0.14 | 7.04 | 67.86 | 5.34 | 263.70 | 2.30 | 158.35 | 34.67 | 3.83 | 9.92 | 0.07 | 273.90 |
Comparison of repeatability and recovery: A close correlation between the validation results of the manual and the automated process was reached. The individual validation results were presented and compared in previous publications [1, 44]. These results show the successful transfer of the manual measurement method to the automation system. In the two measurement processes—manual and automated—relatively high CV values were observed in the determination of the repeatability (35.45%) and the recovery rate (min. 56.11%, 171.37%) for the element cadmium. Reasons can be found in the inhomogeneity of the CRM. The CRM used in this study certifies Cd uncertainties of ±3.7 mg/kg (±50.7%). In the literature, similar results were reported for other dust reference materials such as ERM-CZ120 [14].
5.5. Measurement Results of Collected Dust Samples
The automated measurement system was tested with a wide variety of real samples. Dust samples were collected in rooms of the institute including robotic laboratories, chemical laboratories, analytical laboratories, and offices (samples 1-7, 12), in private households (samples 8-11, 21), in old disused garden houses (samples 13-20), and at several places in a high school including class and storage rooms, cafeteria, auditorium, and the sports hall. The indoor dust was taken with hand gloves and plastic forceps and was stored in plastic containers to avoid contamination during the sampling.
Selected results were previously presented in [1, 44]. Overall, relatively low heavy metal concentrations were acquired, which were within the expected range. Higher concentrations of some heavy metals were found in dust samples collected in old garden houses. Further, elevated heavy metal concentrations were monitored in access-controlled storage cabinets for chemicals. Table 5 summarizes the results—previously published and extended with results of additional heavy metals. In the first 21 samples no recording of the concentrations of Be, V, As, Hg, and Tl is available since these elements were later included into the measurement method to extend the methodological scope. The concentrations of all elements shown in Table 5 were determined for the subsequent sample set (samples 22-32). The measured heavy metal concentrations in the collected indoor dust samples show a wide concentration range. Elevated Pb concentrations were determined in the samples from old garden houses.
Elevated As and Hg concentrations were monitored in dust collected in storage cabinets of chemicals. The concentrations of Fe were higher than the highest calibrations standard in all samples measured. If the aim of investigation is determination of Fe, then an additional dilution step must be included in the sample preparation to adjust the concentration in the measurement solutions to the typical working range of the ICP-MS detector. In this study, the determination of Fe was not the focus and no additional dilution was performed. Figure 5 shows the mass spectra of a calibration standard with an element concentration of 100 µg/L and of a dust sample collected in an old garden house (sample 14). An exemplarily overview of the heavy metal concentrations (Li, Cr, Co, and Sr) in different samples gives Figure 6.
A more detailed exploration of the heavy metal distribution requires the analysis of a higher sample number per location. This will be subject to future investigations. The results of this study show the suitability and performance of the automated sample pretreatment and the analytical measurement setup for its application in the determination of heavy metals in indoor dust—and possibly in outdoor dust.
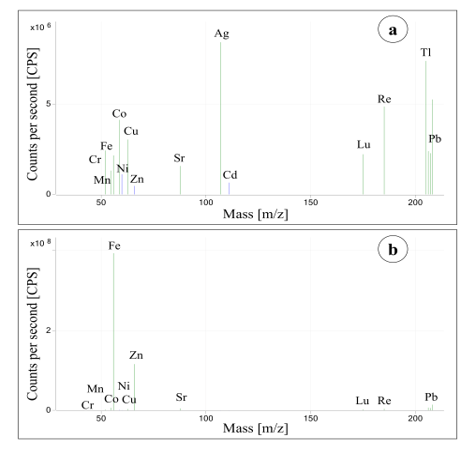
Figure 5: ICP-MS mass spectra—(a) calibration standard with element concentrations of 100 µg/L, (b) collected dust sample 14.
6. Conclusion
In this extended paper, the entire study of the development and application of an automated robot-assisted system for determination of multiple heavy metals in indoor dust was presented. The study started with the development and the validation of the manual sample preparation (microwave-assisted acid digestion) of dust samples and the measurement method (ICP-MS measurements). The manual procedure was validated with the following parameters determined using certified reference material: repeatability, recovery rates, within-laboratory precision, measurement precision as well as the limit of detection (LOD) and the limit of quantification (LOQ). In the next step, the automation system was extended, new racks for the used labware were designed and manufactured and new processes were created in the three-level software system. The manual procedure was not identical transferred to the automation system. The subprocess dilution was miniaturized resulting in a higher sample throughput by using a higher number of smaller vessels. Furthermore, the integration of the single-vial liquid handler allows the dispensing of a large volume ultrapure water in one step, reducing pipetting uncertainties. The automated procedure was identically validated and compared with the manual processing.
The developed measurement method can be understood and used as a screening procedure to prepare and measure a high number of dust samples in a relative short time frame. The processing time of the automated process is approx. 15 min longer than the manual procedure. But while running the automated process, the laboratory staff is free for other tasks operated in parallel. The method validation for both the manual and the automated procedure was performed using certified reference material. The results of the two methods were compared with the certified values for Cr, Cd, As, Hg, and Pb. Close results were reached for As, Cd, and Pb. The recovery rates of Cr and Hg were lower than certified, but they are acceptable for a screening method. Conspicuous samples found in the screening can then be analyzed by the standard method using a stronger acid mixture in the microwave digestion procedure.
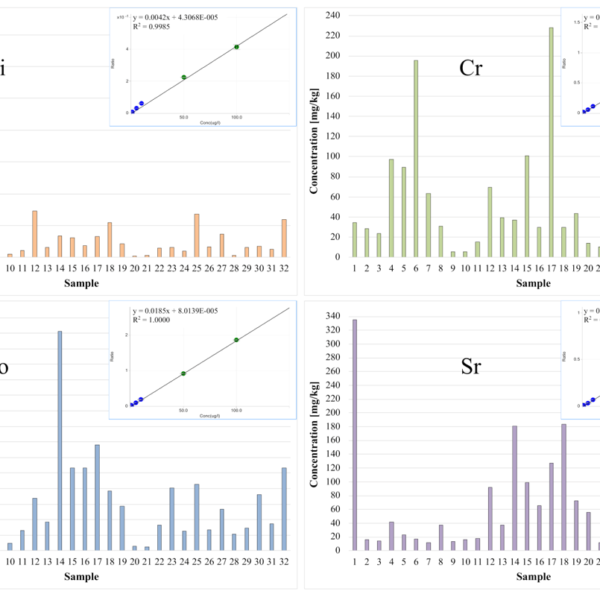
Figure 6: Calibration data and concentrations of the elements Li, Cr, Co, and Sr measured in dust samples which were collected in laboratories and offices (samples 1-7, 12), in private households (samples 8-11, 21), in old disused garden houses (samples 13-20), and in high school locations (samples22-32)
Besides the five elements certified in the CRM, additional elements were measured and validated (except for the determination of the recovery rate). Depending on the element concentration, the recorded CV values show that the automated measurement method is also suitable to screen more than the certified elements.
The automation of the entire process—sample preparation and measurement—has multiple advantages. The human operator is protected from potential hazards caused by harmful reagents such as high concentrated nitric acid and hydrogen peroxide, toxic samples and sample solutions as well as harmful nitrous gases. The laboratory staff is free from highly repetitive tasks like pipetting for multiple times. Other laboratory tasks can be executed in parallel. Overall, this increases the sample throughput as well as the laboratories performance and safety.
The automated measurement system presented is ready for its application in large studies with a high number of samples. In this study, the sample preparation and measurement of collected inhouse dust samples give a first overview of the element concentrations and show the performance of the automation. In further studies, a suitable design of experiment for the desired location is needed together with well-planned sampling methods to acquire large data sets of the area to be investigated. The automation system is here a contribution to the current exploration of the distribution of heavy metals inhouse and for a safer and healthier daily life. Furthermore, the system presented can also be applied in environmental studies screening outdoor dust.
Conflict of Interest
The authors declare no conflict of interest.
Acknowledgment
The authors thank Dr. C. Kupke for organizing the project “Jugend Forscht” (German youth science competition) with the Innerstädtisches Gymnasium (Senior High School) in Rostock, Germany. Special thanks are expressed to H. Engelhardt, Dipl.‑Ing. L. Woinar, and Dr. S. Junginger for technical support and suggestions, as well as to S. Horn and B.Sc. A. Reichelt for their excellent laboratory assistance.
- H. Fleischer, J. Widmer, S. Statkevych, R. Stoll, T. Roddelkopf, K. Thurow, “Robot-assisted Measurement of Heavy Metals in Indoor Dust Using ICP-MS,” in 2021 IEEE International Instrumentation and Measurement Technology Conference (I2MTC), 1-6, 2021, doi: 10.1109/I2MTC50364.2021.9459859.
- S. Y. Tan, S. M. Praveena, E. Z. Abidin, M. S. Cheema, “A review of heavy metals in indoor dust and its human health-risk implications,” Reviews on environmental health, 31(4), 447-456, 2016, doi: 10.1515/reveh-2016-0026.
- N. Bukowiecki, M. Hill, R. Gehrig, C. N. Zwicky, P. Lienemann, F. Hegedüs, G. Falkenberg, E. Weingartner, U. Baltensperger, “Trace Metals in Ambient Air: Hourly Size-Segregated Mass Concentrations Determined by Synchrotron-XRF,” Environmental Science & Technology, 39(15), 5754-5762, 2005, doi: 10.1021/es048089m.
- T. Shi, Y. Wang, “Heavy metals in indoor dust: Spatial distribution, influencing factors, and potential health risks,” Science of the total Environment, 755(2021), 2021, doi: 10.1016/j.scitotenv.2020.142367.
- S. T. Y. Tong, “Indoor and outdoor household dust contamination in Cincinnati, Ohio, USA,” Environmental Geochemistry and Health, 20(3), 123-133, 1998, doi: 10.1023/A:1006561832381.
- R. Millan, T. Schmid, M. J. Sierra, S. Carrasco-Gil, M. Villadóniga, C. Rico, D. M. S. Ledesma, F. J. D. Puente, “Spatial variation of biological and pedological properties in an area affected by a metallurgical mercury plant: Almadenejos (Spain),” Applied Geochemistry, 26(2), 174-181, 2011, doi: 10.1016/j.apgeochem.2010.11.016.
- D. J. A. Davies, J. M. Watt, I. Thornton, “Lead levels in Birmingham dusts and soils,” The Science of the Total Environment, 67(2-3), 177-185, 1987, doi: 10.1016/0048-9697(87)90210-5.
- J. Patocka, K. Cerný, “Inorganic lead toxicology,” Acta medica (Hradec Králové) / Universitas Carolina, Facultas Medica Hradec Králové, 46(2), 65-72, 2003, doi: 10.14712/18059694.2019.8.
- C. D. Klaassen, J. Liu, B. A. Diwan, “Metallothionein protection of cadmium toxicity,” Toxicology and Applied Pharmacology, 238(3), 215-220, 2009, doi: 10.1016/j.taap.2009.03.026.
- M. P. Waalkes, “Cadmium carcinogenesis in review,” Journal of Inorganic Biochemistry, 79(1-4), 241-244, 2000, doi: 10.1016/S0162-0134(00)00009-X.
- D. J. A. Davies, I. Thornton, J. M. Watt, E. B. Culbard, P. G. Harvey, H. T. Delves, J. C. Sherlock, G. A. Smart, J. F. A. Thomas, M. J. Quinn, “Lead intake and blood lead in two-year-old U.K. urban children,” The Science of the Total Environment, 90(C), 13-29, 1990, doi: 10.1016/0048-9697(90)90182-T.
- H. Fleischer, K. Thurow, “Compound-oriented Measurement Processes: Elements, Molecules, Structures,” in 2020 IEEE International Instrumentation and Measurement Technology Conference (I2MTC), 1-6, 2020, doi: 10.1109/I2MTC43012.2020.9128468.
- R. Lumpp, M. Klein, E. Bieber, F. Bunzel, U. Eckermann, C. Frels, W. Günther, C. Hagemann, C. Koch, A. Olschewski, C. Temme, “Comparison of different digestion methods for elemental analysis of airborne dust and dust deposition,” Gefahrstoffe – Reinhaltung der Luft, 72(1/2), 64-71, 2012 (article in German with an abstract in English).
- R. Lumpp, M. Klein, K. Berger, E. Bieber, F. Bunzel, M. Ernst, C. Frels, W. Günther, C. Hagemann, C. Koch, A. Olschewski, “A study on the certified reference material ERM®-CZ120 – Results of round robin tests,” Gefahrstoffe – Reinhaltung der Luft, 75(1/2), 35-40, 2015 (article in German with an abstract in English).
- Deutsches Institut für Normung e.V., “Ambient air quality – Standard method for the measurement of Pb, Cd, As and Ni in the PM10 fraction of suspended particulate matter,” (DIN EN 14902), 2005.
- Deutsches Institut für Normung e.V., “Stationary Source Emissions – Determination of the total emission of As, Cd, Cr, Co, Cu, Mn, Ni, Pb, Sb, Tl and V,” (DIN EN 14385), 2004.
- Deutsches Institut für Normung e.V., “Ambient air quality – Standard for determination of arsenic, cadmium, lead and nickel in atmospheric deposition,” (DIN EN 15841), 2010.
- Verein Deutscher Ingenieure, “Chemical Analyis of Particulate Matter – Determination of Ba, Be, Cd, Co, Cr, Cu, Ni, Pb, Sr, V, Zn in Particulate Emissions by Atomic Spectrometric Methods,” (VDI 2268 Part 1), 1987.
- Verein Deutscher Ingenieure, “Chemical Analysis of Particulate Matter – Determination of Arsenic, Antimony and Selenium in Dust Emissions by Atomic Absorption Spectrometry after Separation of their Volatile Hydrides,” (VDI 2268 Part 2), 1990.
- Verein Deutscher Ingenieure, “Chemical Analysis of Particulate Matter – Determination of Arsenic, Antimony and Selenium in Dust Emissions by Graphite-Furnace Atomic Absorption Spectrometry,” (VDI 2268 Part 4), 1990.
- Verein Deutscher Ingenieure, “Determination of suspended matter in ambient air – Measurement of the element concentration after sampling on filters – Determination of Al, As, Ba, Ca, Cd, Co, Cr, Cu, Fe, K, Mg, Mn, Na, Ni, Pb, Sb, Se, Sn, Tl, V, and Zn by GF-AAS, ICP-OES, or ICP-MS,” (VDI 2267 Part 1), 2019.
- Verein Deutscher Ingenieure, “Determination of suspended matter in ambient air – Measurement of Al, As, Ba, Ca, Cd, Co, Cr, Cu, Fe, K, Mg, Mn, Na, Ni, Pb, Sb, Se, Sn, Tl, V, and Zn as part of the atmospheric deposition after sampling with bulk and wet-only collectors using GF-AAS, ICP-OES, and ICP-MS,” (VDI 2267 Part 2), 2019.
- Verein Deutscher Ingenieure, “Determination of suspended matter in ambient air – Digestion variants for dust samples for subsequent determination of the mass concentration of Al, As, Ba, Ca, Cd, Co, Cr, Cu, Fe, K, Mg, Mn, Na, Ni, Pb, Sb, Se, Sn, Tl, V and Zn,” (VDI 2267 Part 3), 2015.
- Verein Deutscher Ingenieure, “Determination of suspended particles in ambient air – Measurement of the mass concentrationof mercury – Sampling by sorption as amalgam and determination by atomic absorption spectrometry (AAS),” (VDI 2267 Part 8), 2000.
- Verein Deutscher Ingenieure, “Determination of suspended particulate matter in ambient air – Measurement of the mass concentration of mercury – Sampling by sorption as amalgam and determination by atomic fluorescence spectrometry (AFS),” (VDI 2267 Part 9), 2002.
- Verein Deutscher Ingenieure, “Determination of suspended particulate matter in ambient air – Measurement of the mass concentration of As, Ba, Cd, Co, Cr, Cu, Ni, Pb, Sb, V und Zn as part of dust precipitation by atomic absorption spectrometry (AAS),” (VDI 2267 Part 16), 2007.
- W. A. Willford, R. J. Hesselberg, H. L. Bergman, “Versatile combustion amalgamation technique for the photometric determination of mercury in fish and environmental samples,” Journal of the Association of Official Analytical Chemists, 56(4), 1008-1014, 1973, doi: 10.1093/jaoac/56.4.1008.
- G. Kopp, “Quecksilberanalytik – Für jede Applikation die optimale Methode,” LABO – Instrumentelle Analytik, 2012(6), 20–23, 2012.
- Rohasys Robotic and Handling Systems, Rouwette Consultancy. “Probenvorbereitung für Schwermetallanalysen,” 08.03.2022; http://issuu.com/rouwetteconsultancy/docs/probenvorbereitung_f__r_schwermetal.
- J. W. Milburn, “Automated addition of internal standards for axial-view plasma ICP spectrometry using the Optima 3000 XL,” Atomic Spectroscopy, 17(1), 9–14, 1996.
- H. Fleischer, K. Thurow, “Determination of Total Mercury Content and Trace Metal Analysis in Wood Materials Part 1: ICP-OES Using Mercury Cold Vapor,” American Laboratory, 45(8), 6–9, 2013.
- H. Fleischer, K. Thurow, “Determination of Total Mercury Content in Wood Materials – Part 2: ICP-MS – A Multi-element Method,” American Laboratory, 45(9), 6–11, 2013.
- H. Fleischer, E. Vorberg, K. Thurow, “Determination of Total Mercury Content in Wood Materials – Part 3: Miniaturization Using ICP-MS,” American Laboratory, 46(6), 16–20, 2014.
- E. Vorberg, H. Fleischer, S. Junginger, N. Stoll, K. Thurow, “Automated Sample Preparation for Mercury Analysis in Wood Materials,” IET Science, Measurement and Technology, 10(5), 398-404, 2016, doi: 10.1049/iet-smt.2015.0036.
- H. Fleischer, E. Vorberg, M. Warkentin, D. Behrend, K. Thurow, “Determination of Calcium and Phosphor in Bones Using Microwave Digestion and ICP-MS: Comparison of Manual and Automated Methods using ICP-MS,” 5th IMEKO TC19 Symposium on Environmental Instrumentation and Measurement), 94–99, 2014.
- H. Fleischer, K. Ramani, S. Bauer, M. Warkentin, D. Behrend, K. Thurow, “Determination of Calcium and Trace Metals in Clogged Biliary Endoprostheses Using ICP/MS,” American Laboratory, 49(6), 6-9, 2017.
- H. Fleischer, K. Ramani, K. Blitti, M. Warkentin, D. Behrend, K. Thurow, “Flexible Automation System for Determination of Elemental Composition of Incrustations in Clogged Biliary Endoprostheses Using ICP-MS,” SLAS Technology, 23(1), 83-96, 2018, doi: 10.1177/2472630317727451.
- H. Fleischer, K. Ramani, K. Thurow, “Sample Preparation and Measurement of Cholesterol in Pig Bile Using SPE and GC/MS,” American Laboratory, 52(2), 10-13, 2019.
- H. Fleischer, T. Roddelkopf, R. Stoll, K. Thurow, “Automated Analytical Measurement System for Determination of Cholesterol in Pig Bile,” in 2019 IEEE International Instrumentation and Measurement Technology Conference (I2MTC), 1510-1515, 2019, doi: 10.1109/I2MTC.2019.8826917.
- H. Fleischer, C. Lutter, A. Buttner, W. Mittelmeier, K. Thurow, “Semi-Automated Determination of Heavy Metals in Autopsy Tissue Using Robot-Assisted Sample Preparation and ICP-MS,” Molecules, 26(13, 2021, doi: 10.3390/molecules26133820.
- H. Fleischer, T. Roddelkopf, C. Lutter, A. Büttner, W. Mittelmeier, K. Thurow, “Automation in arthrosis research,” SLAS Technology, 27(1), 97-99, 2022, doi: 10.1016/j.slast.2021.10.009.
- T. Schwank, K. Pitzke, K. Gusbeth, K. Ashley, D. Breuer, “Comparison of Microwave-Assisted Digestion and Consensus Open-Vessel Digestion Procedures for Evaluation of Metalliferous Airborne Particulate Matter,” Annals of Work Exposures and Health, 63(8), 950-964, 2019, doi: 10.1093/annweh/wxz068.
- P. E. Rasmussen, K. S. Subramanian, B. J. Jessiman, “A multi-element profile of house dust in relation to exterior dust and soils in the city of Ottawa, Canada,” Science of the total Environment, 267(1-3), 125-140, 2001, doi: 10.1016/S0048-9697(00)00775-0.
- H. Fleischer, S. Statkevych, J. Widmer, K. Thurow, “Allergene und Schwermetalle in Hausstaub – Bestimmung der elementaren Zusammensetzung mittels ICP-MS,” GIT Labor-Fachzeitschrift, 65(5-6), 36-38, 2021.
- H. Fleischer, K. Thurow, Automation Solutions for Analytical Measurements – Concepts and Applications, Wiley-VCH, 2017.
- H. Fleischer, K. Thurow, “On the Way to Efficient Analytical Measurements: The Future of Robot-Based Measurements,” SLAS Technology, 25(2), 208-211, 2020, doi: 10.1177/2472630319886270.
- S. Neubert, X. Gu, B. Göde, T. Roddelkopf, H. Fleischer, N. Stoll, K. Thurow, “Workflow Management System for the Integration of Mobile Robots in Future Labs of Life Sciences,” Chemie-Ingenieur-Technik, 91(3), 294-304, 2019, doi: 10.1002/cite.201800007.
- H. Fleischer, M. Adam, K. Thurow, “A Cross-platform Modular Software Solution for Automated Data Evaluation Applied in elemental and Structural Mass Spectrometry,” in 2015 IEEE International Conference on Automation Science and Engineering (CASE), 758-763, 2015, doi: 10.1109/CoASE.2015.7294172.
- M. Adam, H. Fleischer, K. Thurow, “Generic and Automated Data Evaluation in Analytical Measurement,” SLAS Technology, 22(2), 186-194, 2017, doi: 10.1177/2211068216672613.
- H. Liu, N. Stoll, S. Junginger, K. Thurow, “Mobile robot for life science automation,” International Journal of Advanced Robotic Systems, 10, 1-14, 2013, doi: 10.5772/56670.