Heuristic Analysis of Overall Performance Measurement Perception and Management in Automotive Industry
Volume 7, Issue 3, Page No 1-11, 2022
Author’s Name: Aicha Lamjahdi1,a), Hafida Bouloiz1, Maryam Gallab2
View Affiliations
1National School of Applied Sciences (ENSA), Systems Engineering and Decision Support Laboratory (LISAD), IBN ZOHR University, Agadir, BP 80000, Morocco
2MINES-RABAT School (ENSMR), Computer Science Department, Rabat, BP 753, Morocco
a)whom correspondence should be addressed. E-mail: aichalamjahdi@gmail.com
Adv. Sci. Technol. Eng. Syst. J. 7(3), 1-11 (2022); ![]() DOI: 10.25046/aj070301
DOI: 10.25046/aj070301
Keywords: Key performance indicators (KPIs), Overall Performance management, Automotive industry, Overall performance measurement, Sustainable manufacturing, Decision making

Export Citations
Overall Performance (OP) measurement is an essential instrument in sustainable manufacturing implementation and management. The effective use of key performance indicators (KPIs) can potentially contribute to identify the firm’s overall performance, provide the crucial gaps between desired results and current actions, and thus facilitate the implementation and execution of improvement strategies. This study attempts to give an insight into the perception of OP measurement and management in the automotive industry and explore the KPIs pertinent to this sector. This research is conducted in automobile organizations based in Morocco. We first carried out a literature review to determine the commonly used indicators of sustainability management in manufacturing. We then conducted a survey on a sample of firms to investigate the OP system management and how the proposed initial set of KPIs is perceived and used in the field. Findings reveal some management problems of the OP measurement system in the automobile sector. It was found that only a minority of companies use dedicated applications to manage their set of indicators. There is a lack of well-defined and standardized KPIs, which generally affect data quality. Moreover, most companies have a minimum percentage of decisions based on KPIs use, and only a few are satisfied with their overall performance measurement systems. However, analysis indicates no substantial differences in the perception of KPIs’ importance among various respondents. Results showed that the most used KPIs are perceived as the most important. Consequently, sixteen indicators under the three dimensions of sustainability were presented as KPIs for OP measurement in the automotive industry. These indicators will hopefully serve the development of an OP management tool to support sustainability in this sector. The study is evenly valuable for other developing countries as Morocco in sustainability implementation in the automobile field.
Received: 07 February 2022, Accepted: 21 April 2022, Published Online: 16 May 2022
1. Introduction
The automotive industry plays a significant role in the world economy’s progress and evolution. It is a highly capitalistic sector, a catalyst of innovation, and an important generator of investments and employment around the world. In Morocco, the industry recorded the highest job creation between 2014 and 2019, with over 29% of the industrial sector’s total job creations, reflecting the strong growth dynamic in which it is part [1]. Its performance is particularly remarkable in exports, ensuring a third of exports for a value of 7 billion dollars, which make it the country’s leading export sector [2]. Thus, Morocco has become the leading car manufacturer in North Africa, with a market share of 38% in 2018 against 5% in 2003 [3].
However, the automotive sector significantly impacts the environment and society [4]. Governments, consumers, and investors are pushing manufacturers to adopt sustainability in the way they work, their culture, and their products. It is a strategic priority and long-term implication that can help companies gain several benefits such as improving product quality, enhancing the company’s image, and increasing market share [5–7]. Similarly, the employees’ interactions and skills improve by adopting the sustainable culture, which is reflected in their communication, motivation, and satisfaction [8]. In [7], the author suggested that cost reduction and better attraction of funding sources are among the essential advantages of sustainability. Thus, eliminating waste sources and adopting sustainable practices results in cost minimization, motivates investors, and helps the company profit from the funding opportunities that are increasingly dedicated to encouraging this strategy in the firms.
To support the sustainability implementation in the manufacturing sector, managers need to monitor the firm’s overall performance [9]. This approach combines the assessment of the economic, social, and environmental performances [10,11]. To fulfill this purpose, manufacturing organizations use performance measurement systems to ensure that they achieve their desired objectives and control possible deviations. Performance measures play an essential role within these systems. They provide detailed information on the current situation of the manufacturing process [12], support realization of improvement actions, and allow to evaluate decisions effectiveness [13]. A large number of manufacturing firms tend to surcharge themselves with performance indicators, which will affect decision-making and defocus fundamental issues that require consistent control and monitoring [14]. Thus, rigorous identification of Key Performance Indicators (KPIs), practically needed, should be a priority for organizations that aim to implement sustainability and assess OP [13,15].
Many researchers have proposed different types of indicators for overall performance measurement. However, a well-defined set of KPIs for OP management in the manufacturing industry has not yet been established to date [16–18]. In [16], the author stressed that this might be attributed to the difference between manufacturing organizations’ characteristics, as each business industry has its special features and work environment. Moreover, in [18], the author confirmed that identifying the appropriate KPIs is affected by managers’ perception of these indicators, which varies depending on different factors such as level of overall experience [19]. Further, many managers still find it challenging to identify the interrelationships between performance indicators. These barriers are added to the main challenges that can hinder the implementation of OP measurement system in the firm due to lack of use of structured tool and platform to assess the OP [20], the implementation complexity, and cost [8, 11] and the lack of qualification and training [16].
This paper aims to explore the perception of OP measurement in the context of automotive companies in Morocco and investigate the substantial KPIs in this field. Therefore, a literature review was carried out to collect the important key performance indicators demonstrated to be used in manufacturing practices. A survey was then conducted to investigate how OP is managed in the automotive firms, the challenges faced and the general adequacy of the OP measurement system used. The effective use of the established KPIs was examined, and the perception of these KPIs by various managers was also captured. Finally, a set of KPIs, perceived as the most relevant for OP measurement and management, was proposed, and the correlation between these indicators was evenly established. This research will be useful for automotive companies to get an overview of OP management and the appropriate KPIs for a meaningful implementation and monitoring of sustainability.
2. Methodology
2.1. Identification of key performance measures: Literature review
OP measurement is considered an indispensable approach to evaluate an organization’s strategy and situate its results compared to its goals and targets. It provides essential information needed and supports decision building to achieve organization strategic objectives [12, 20]. Thus, this approach is essentially based on identifying, evaluating, and monitoring appropriate indicators and metrics that enable a detailed description of performance progress in the firm[15]. Different studies in the literature have suggested various sets of metrics for overall performance measurement. Thus, in [12] the author proposed eleven dimensions with 106 metrics for overall performance management in different manufacturing organizations in Pakistan. In [21], the researchers adopted the Triple Bottom Line (TBL) to define 18 indicators for lean manufacturing integration in the Brazilian industry. Similarly, in [22] the authors identified 41 indicators based on the TBL to develop an AHP model for sustainability assessment in the automotive sector. In [23], the authors defined a pool of 43 indicators to get an overview of sustainable scheduling in manufacturing industries.
From our review of literature [24], we have proposed an initial catalog of KPIs commonly considered by authors as necessary for OP management. We have adopted the TBL of sustainable management consisting of three dimensions- economic, environmental, and social. The economic dimension aims to ensure financial performance through an enhanced long-term income that exceeds the organization‘s charges and expenditures [25]. Thus, from the literature, the most popular indicators of the economic dimension measure quality of products and services, cost reduction, net profit, one time delivery, and investments in innovation and research and development (R&D). Quality of products and services refers to a firm’s capacity to meet customer specifications and expectations [12, 26, 27]. Cost reduction relates to manufacturing and organization costs decreasing, including material cost, labor cost, and operational and capital costs [23, 28]. Net profit indicator measures the profit gained through the firm’s activities [28]. One time delivery refers to the rate of parts delivered on time compared to the total number of units ordered in a predefined period [12]. It is considered a major factor of firm performance to increase customer service level and strengthen its competitive position in the market [12,29]. Similarly, investments in innovation and research and development measure is considered an essential aspect of firm’s economic health. It ensures the organization’s commitment to innovation that grantees its sustainability and growth [11, 28].
The environmental dimension addresses the rational use of natural resources within an organization’s activities [21]. According to several authors, it covers indicators related to resource consumption, emissions impacts, waste management, and environmental certification. Resources consumption indicators seek to optimize energy and water during manufacturing operations [30, 31]. Emissions impacts criteria measure the impact of polluting emissions produced on the environment, involving the amount of greenhouse gases generated [32]. Waste management aims to minimize the solid and liquid waste produced and monitor its treatment during the production process [23]. Thus, environmental certification is considered an important driver of environmental performance improvement by the firm and a relevant way to prove its commitment to environmental policy [29].
The social dimension is related to employees’ social welfare and the surrounding community in which operate the organization [21,32]. Authors in the literature categorized this dimension through various measures, including injury rate, occupational health, safety, ratio of training hours, level of employee satisfaction, and investments in community development activities. Injury rate and occupational health and safety reflect mainly the work conditions in the firm, they measure the effect of the manufacturing process on worker health and safety and provide an overview of the social performance level in the workplace [23,33,34]. The training hours ratio is associated with employees’ career development and reflects the firm’s strategy in its staff’s professional evolution [11,32]. Thus, employee satisfaction is considered an important factor to build and strengthen the firm’s overall performance given the strong relationship between workers and the firm’s efficiency and productivity [12,32]. It ensures employee well-being within the organization and supports decision-making for working environment improvement [32,33]. In [32], the authors confirmed that investments in community development activities criteria help assess the firm’s impact on the surrounding community and support its involvement in community advancement projects.
Table1 outlines the literature on the relevant indicators for overall performance management.
2.2. Automotive industry survey
In an attempt to explore the established catalog of KPIs in the automotive sector, an industrial survey in Morocco-based automotive companies was carried out. A questionnaire made up of four parts was then used for this purpose. The first part consists of background information, such as the firm’s size, product type, and respondents’ experience in the automotive industry. The second part aims to provide an insight into the measurement systems management in terms of adequacy, challenges that affect the process, type of calculation and pilotage system used, and the percentage of decisions made as a result of KPIs use. The third part investigates the KPIs used in practice in the automotive industry. The last part focuses on the perception of each proposed KPI’s importance, from respondents’ point of view, based on their experiences and their firms’ practices.
The questionnaire was submitted to a group of experts in the sustainable management field for a preliminary test. Ten copies were distributed to three researchers and seven practitioners in other automotive companies that were not part of the sample. This test allowed verification and validation of the questionnaire through the improvement of the questions and the statements’ clarity and accuracy to avoid possible misinterpretations.
This survey population was selected in January 2020 from the Ministry of Industry, Trade, and Green and Digital Economy (MITGDE) automotive directory. The ministry directory was used due to its diverse and updated automotive companies’ database, which provides a reliable and well-represented sampling reference. Thus, the study was conducted among project managers, deputy project managers, and other senior experts in the surveyed firms. They are high-ranking informants that most consider the KPIs management approach to control and manage their projects.
The survey was sent to respondents by email that explained its objective and ensured their anonymity. Some undelivered questionnaires by email, were issued to the respondents through the business online platform Linkedin, which provided more interactivity with the respondents and contributed significantly to raising the response rate.
3. Results and discussions
3.1. Background of respondents
The questionnaire was delivered to 127 automotive firms in Morocco. Thus, 51 replies were received, which resulted in a response rate of 40%. This rate seems to be acceptable. According to the authors in [35] a lot of this type of study, in the literature, obtain less than 30% response rate. The table 2 presents the background of respondents.
Of the study sample, over half of the respondents (53%) were project managers, 29% were deputy project managers, 18% were directors and senior professionals and the remaining 10% of ‘others’ consisted of production managers, quality control managers and process engineers. For the years of respondents’ experience in the automotive sector, over 66% had from 6 to 10 years’ experience in the field, then 21.6% with more than 10 years and finally 11.8% with 1 to 5 years in the sector.
The majority of respondents (58.8%) were from large companies categorized in this research as having an annual turnover equal to or greater than $ 20 million[36]. The other 41.2% were from Small and Medium-sized Enterprises (SMEs) having an annual turnover between 1 and 20 million dollars [36]. Almost 23% of the companies surveyed manufactured plastic and rubber parts, 21.6 % produced automotive wiring equipments, 17.6 % manufactured metal equipments, 11.8% manufactured mechanical equipments, 5.9% manufactured electrical and electronic equipments and 19,6% manufactured other automotive equipments. This diversity in product type of the sample firms showed that the automotive sector population is well represented in this study. Furthermore, 86% of the companies were certified to IATF 16949 that provides specifications for quality system management for the automobile industry.
Besides, 44% are certified to ISO 14001, the environmental management standard, 28% were certified to ISO 45001 related to health and safety management, 13% were certified to ISO 9001, and 2% were certified to ISO 26000 related to corporate social responsibility implementation. This implies the companies rely on essential standards in the management of their overall performance.
3.2. Perception of KPIs management in automotive industry
The objective of this section is to check how the KPIs are managed and how they support performance management in automotive companies. For this aim, the respondents were asked which system they use to manage their set of KPIs, which challenges are faced in their KPIs monitoring process, the
Table 1: Relevant indicators for performance management in literature
| Overall Performance dimensions | Indicators | Authors |
| Economic | Quality of products and services | [21] ; [28] ; [12] ;[37];[26];[29]; [38];[30];[27] |
| Material cost | [23] ; [21]; [28]; [31]; [12]; [37]; [26]; [39]; [40]; [38]; [41] | |
| Labour cost | [23] ; [28]; [31]; [12]; [37]; [39]; [40]; [41] | |
| Operational and capital costs | [23] ; [28]; [31]; [12]; [37]; [26]; [39]; [29]; [38]; [30]; [27] | |
| Net profit | [23] ; [21]; [12]; [39]; [30]; [27]; [42]; [41] | |
| Rate of one time delivery | [12]; [37]; [26]; [29]; [38]; [30]; [27] | |
| Investments in innovation and research and development | [21]; [12]; [37]; [26]; [39]; [30]; [27] | |
| Environmental | Total water consumption | [23] ; [21];[28]; [31]; [4]; [39]; [40]; [29]; [33]; [30] |
| Total energy consumption | [23] ; [21]; [28]; [31]; [4]; [26]; [39]; [40]; [29]; [33]; [30] | |
| Amount of greenhouse gases generated | [23] ; [28]; [31]; [4]; [26]; [39]; [40]; [29] ; [33]; [30] | |
| Solid and liquid waste produced | [23] ; [31]; [37]; [39] ; [29]; [33] | |
| Disposal of waste | [23] ; [21]; [28]; [31]; [26]; [29]; [27] | |
| Environmental certification | [12]; [26]; [29]; [38]; [30] ; [27] | |
| Social | Injury rate | [23] ; [31]; [12]; [26]; [40]; [29]; [33]; [27] |
| Occupational health and safety | [23] ; [21]; [28]; [31]; [12]; [37]; [26]; [39]; [40]; [29]; [33]; [38] ; [30] ; [27] | |
| Ratio of training hours | [23] ; [21]; [31]; [37]; [40]; [33] | |
| Level of employee satisfaction | [21]; [28]; [31]; [12]; [37]; [39]; [33] | |
| Investments in community development activities | [21]; [31]; [12]; [26]; [39]; [29]; [33] ; [30] |
percentage of changes and decisions based on KPIs use, and the adequacy of their system of performance measurement.
As shown in Figure 1, over half of the respondents’ companies (56.9 %) use spreadsheets or manual processes to control and monitor their KPIs, 29.4% use on-premise financial software modules, and only 13.7 % use advanced applications. This indicates a significant lack of management tools that help save time, which could be reinvested in value-adding activities. Moreover, the majority of respondents (56,9%), as shown in Figure 2, stated that “Too many indicators” is the challenge that most affects them in the process of monitoring KPIs, followed by “too many departments involved” challenge with 41.2%, then “Not enough time” challenge with 21.6%. This finding confirms the OP management complexity advocated in the literature [8,11,20] due to the multiplicity of metrics and departments involved, which leads to enormous difficulties for managers.
For the percentage of decisions and changes based on KPIs use (Figure 3), the greatest percentage of respondents (39.2%) have less than 25%. Only 17.6% have over 75% of changes and decisions established based on KPIs deployment. This unexpected result contrasts with the role of decision support and change orientation in which KPIs use is supposed to help managers, as confirmed in the literature [13].

Figure 1: KPIs management system
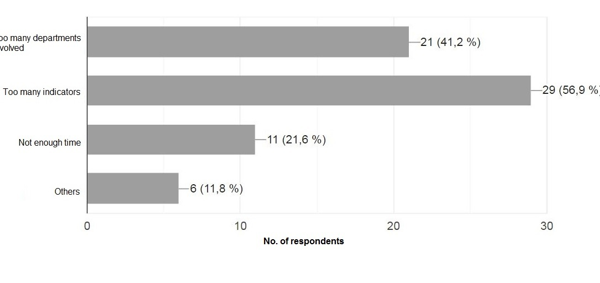
Figure 2: Challenges faced within KPIs management process
Furthermore, as illustrated in Figure 4, 60.8% of those surveyed indicated that their KPIs measurement system needs improvement, while the remaining 39.2% said their measurement system is adequate. This reveals that the majority of managers are not satisfied with the KPIs measurement process in their companies.
Table 2: Background of respondents
| Background of respondents | Frequency | Percentage |
| Respondents job position | ||
| Director/General manager | 9 | 18 |
| Project manager | 27 | 53 |
| Deputy project manager | 10 | 19 |
| Others | 5 | 10 |
| Respondents experience in automotive sector | ||
| 1-5 years | 6 | 11.8 |
| 6-10 years | 34 | 66.7 |
| >10 years | 11 | 21.6 |
| Company turnover | ||
| $ 1-20m | 21 | 41.2 |
| >= $ 20m | 30 | 58.8 |
| Product type | ||
| Automotive wiring | 11 | 21.6 |
| Metal equipments | 9 | 17.6 |
| Mechanical equipments | 6 | 11.8 |
| Electrical and electronic equipments | 3 | 5.9 |
| Plastic and rubber parts | 12 | 23.5 |
| Others | 10 | 19.6 |
| Certification | ||
| IATF 16949 | 43 | 86 |
| ISO 14001 | 22 | 44 |
| ISO 45001 | 14 | 28 |
| ISO 26000 | 1 | 2 |
| ISO 9001 | 7 | 13 |
| Others | 1 | 2 |
These notable findings reveal a significant problem of effectiveness of KPIs management process in automotive companies’ practice. The lack of in-depth and precise definition of metrics and data that should be used coupled with the non-implementation of the appropriate tools of performance management affect the adequacy of system measurement and impact its ability to support decision making in the companies.
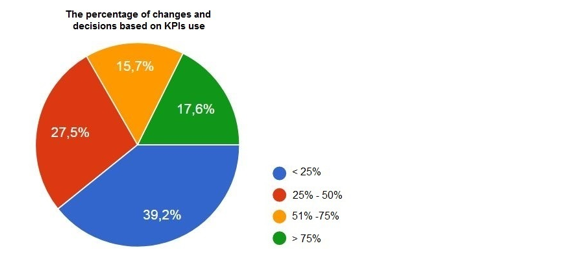
Figure 3: The percentage of changes and decisions based on KPIs use
This ineffectiveness can widen the gap between the firms’ actual needs and the measured indicators and eventually hampered the good governance and the improvement of companies’ overall performance.
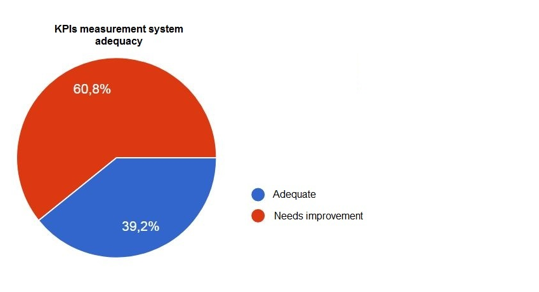
Figure 4: KPIs measurement system adequacy
3.3. Perception of KPIs use in automotive industry practice
In order to examine the use of the proposed set of KPIs in the automotive sector practices, the participants were asked to indicate the metrics they are using to manage their companies’ overall performance. Table 3 presents the results.
As shown in table 3, the “Quality of products and services” is the most used indicator (98%) in the surveyed automotive companies. This is not unexpected since the quality ensures that the firms provide products and services that respect clients’ requirements and expectations [43]. Further, most of the companies are certified to IATF 16949, and they should consider product quality measurement in their priorities while monitoring OP.
The injury rate is the second most used indicator with a rate of 92%. There is also occupational health & safety in the fifth rank with a rate of 75%. This result is evident, given the criticality of risks and dangers within the automotive workplace industry [44] . Economic metrics are used evenly with important rates: one time delivery with 88%, labor cost with 78%, material cost with 71%, and net profit with 57%. Besides, environmental metrics are high ranked between the 18 KPIs proposed, with a usage rate of 69% for total energy consumption and 51% for both total water consumption and solid and liquid waste produced. This may be attributed to the legislation requirements to control the automotive industry’s environmental impact as an important resource consumption source. For the social metrics, as well as injury rate and occupational health & safety, the ratio of training hours is also commonly used with a rate of 61%. Overall, it can be seen, from the results, that companies in the automotive sector, as confirmed previously, focus on the different OP dimensions metrics (social, economic, and environmental) in their practices. However, environmental certification and investments in community development activities are the least used metrics, with 12% and 8%, respectively. This may be due to the complexity of implementation and the high cost of such investments as advocated in the literature [8].
Table 3: Usage of KPIs in automotive industry practices
| Performance indicator | Percentage | Rank |
| Quality of products and services | 98 | 1 |
| Injury rate | 92 | 2 |
| Rate of one time delivery | 88 | 3 |
| Labour cost | 78 | 4 |
| Occupational health and safety | 75 | 5 |
| Material cost | 71 | 6 |
| Total energy consumption | 69 | 7 |
| Ratio of training hours | 61 | 8 |
| Net profit | 57 | 9 |
| Total water consumption | 51 | 10 |
| Solid and liquid waste produced | 51 | 11 |
| Operational and capital costs | 49 | 12 |
| Level of employee satisfaction | 49 | 13 |
| Investments in innovation and research and development | 39 | 14 |
| Disposal of waste | 29 | 15 |
| Amount of greenhouse gases generated | 20 | 16 |
| Environmental certification | 12 | 17 |
| Investments in community development activities | 08 | 18 |
3.4. Perception of KPIs importance in automotive industry
- Analysis of variance ANOVA and T-test results
To investigate automotive companies’ perspective of the to investigate automotive companies’ perspective of the proposed KPIs’ importance for overall performance management, the respondents were asked to rate the importance level of each KPI. A five-point Likert-type scale ranging from 1 (not important at all) to 5 (very important) was used. The analysis of variance (ANOVA) and the t-test were performed to detect if the perceived importance of KPIs is affected by differences between respondent groups. For this purpose, the respondents were categorized under three categories according to experience in the automotive sector, the type of product manufactured, and the company size.
Analysis of variance (ANOVA) and t-test are decision-making techniques for detecting any statistical differences among various means of independent groups [45,46]. The ANOVA is used to compare means of three or more independent groups, whereas the t-test is used when the difference between the means of only two groups are to be studied [46]. Therefore, the analysis of variance (ANOVA) was carried out to investigate the important differences among the “Type of product” groups on one side and the “years’ experience in the automotive sector” groups on the other side. Afterward, the t-test was performed to compare the means between large companies and SMEs, the two groups of “company size” category, surveyed in this study. The table 4 shows the results of these tests.
The null hypothesis for these statistical tests is that the means for all the groups in the same category are supposed to be identical to each other. The null hypothesis is rejected when the p value is less than alpha. The p-value represents the probability of obtaining the observed results, assuming the null hypothesis is true. Alpha is the risk that a null hypothesis will be rejected when it is actually true. When p- value is less than alpha, this means that there is a statistically significant difference in the groups’ means and they may represent separate categories. By convention, alpha is typically set to 0.05 [46]. The test statistic for ANOVA and t-test are respectively the F score and the T score.
As shown in table 4, the ANOVA results suggest that there is no significant difference in respondents’ perception rating of KPIs for “Type of product” groups. Similarly, for “years’ experience in the automotive sector”, respondents’ groups show a general agreement in importance perception rating of KPIs, except for “training hours”. They have a clear significant difference in means at a 95% confidence level (p <.05). Tukey’s post hoc test was then carried out to explore the pairwise comparison differences between “years’ experience” groups for “training hours” indicator. Results show that managers with 6 to 10 years’ experience and those with more than ten years experience give more importance rating to “training hours” in comparison with those with less than five years experience in the field (p <.05).
This is in line with Cox findings [19], which suggests that managers with less experience tend to place more importance on indicators related to the field level, while more experienced managers have a wider company vision where other important performance issues are considered when choosing KPIs for OP assessment. For the t-test, as shown in table 5, results indicate that respondents had a complete agreement about KPIs importance perception when company size was regarded. Taken together, these results suggest that there are no substantial differences in the perceived importance of KPIs among various groups of each category of respondents, namely ’years’ experience in the automotive sector’, “Type of product manufactured” and “Company size”. Thus, respondents in the automotive sector generally tend to have similar views about the proposed KPIs importance to manage and assess overall performance.
Table 4: ANOVA for different categories of respondents groups
| Key performance indicator | Type of product | Experience in automotive sector | ||
| F score | Signification | F score | Signification | |
| Quality of products and services | 0.347 | 0.908 | 1.285 | 0.286 |
| Material cost | 0.954 | 0.467 | 0.688 | 0.507 |
| Labour cost | 0.638 | 0.700 | 1.698 | 0.194 |
| Operational and capital costs | 1.207 | 0.321 | 2.661 | 0.080 |
| Net profit | 0.285 | 0.941 | 2.949 | 0.062 |
| Rate of one time delivery | 0.451 | 0.841 | 0.435 | 0.650 |
| Investments in innovation and research and development | 1.486 | 0.205 | 0.233 | 0.793 |
| Total water consumption | 0.804 | 0.573 | 1.380 | 0.261 |
| Total energy consumption | 1.898 | 0,102 | 1.673 | 0.198 |
| Amount of greenhouse gases generated | 0.298 | 0.935 | 1.750 | 0.185 |
| Solid and liquid waste produced | 1.368 | 0.248 | 0.424 | 0.657 |
| Disposal of waste | 1.426 | 0.226 | 2.516 | 0.091 |
| Environmental certification | 0.796 | 0.578 | 1.912 | 0.159 |
| Injury rate | 0.863 | 0.530 | 0.224 | 0.800 |
| Occupational health and safety | 0.497 | 0.807 | 0.860 | 0.429 |
| Level of employee satisfaction | 0.735 | 0.624 | 0.221 | 0.802 |
| Investments in community development activities | 0.773 | 0.595 | 2.143 | 0.128 |
| Ratio of training hours | 0.978 | 0.452 | 21.303 | 0.001* |
* p < .05
- KPIs importance ranking
The mean importance of KPIs was calculated and ranked, as presented in table 6, for the overall population since no significant differences in perceived KPIs were captured among various respondents groups.
In general, the mean importance values range from 3.37 to 4.82, which implies that all the proposed KPIs are relevant for OP management in the automotive industry. Among the 18 KPIs, quality, one-time delivery, occupational health & safety, labor cost, and material cost are highly ranked. As customers are very demanding on the quality of products and services, companies consider ensuring high quality at minimum costs, a primary objective to improve their competitiveness [12].
Table 5: T-test for company size categories
| Key performance indicator | Mean importance | T-test | ||
| Large entrep-rises | Small and medium-sized enterprises | T score | Signification | |
| Quality of products and services | 4.77 | 4.90 | -1.160 | 0.252 |
| Material cost | 4.40 | 4.45 | -0.267 | 0.790 |
| Labour cost | 4.33 | 4.50 | -0.859 | 0.394 |
| Operational and capital costs | 4.00 | 3.40 | 1.755 | 0.090 |
| Net profit | 4.33 | 4.35 | -0.058 | 0.954 |
| Rate of one time delivery | 4.67 | 4.70 | -0,184 | 0.855 |
| Investments in innovation and research and development | 3.97 | 3.80 | 0.543 | 0.589 |
| Total water consumption | 3.77 | 3.85 | -0.317 | 0.753 |
| Total energy consumption | 3.63 | 3.95 | -0.951 | 0.347 |
| Amount of greenhouse gases generated | 3.87 | 3.95 | -0.262 | 0.795 |
| Solid and liquid waste produced | 3.83 | 4.05 | -0.758 | 0.452 |
| Disposal of waste | 3.87 | 3.45 | 1.356 | 0.182 |
| Environmental certification | 3.27 | 3.50 | -0.836 | 0.407 |
| Injury rate | 4.17 | 4.05 | 0.392 | 0.697 |
| Occupational health and safety | 4.47 | 4.60 | -0.547 | 0.587 |
| Level of employee satisfaction | 4.17 | 4.40 | -0.875 | 0.386 |
| Investments in community development activities | 3.70 | 3.55 | 0.535 | 0.595 |
| Ratio of training hours | 4.27 | 4.25 | 0.074 | 0.942 |
Likewise, time is considered an important factor of a firm’s commitment and performance [47]. Interest in safety is also understandable due to its critical effect on cost, production, and workplace components [13]. These indicators are followed by environmental dimension measures where solid and liquid waste produced is the high ranked. However, investments in community development activities and environmental certification are considered the least important indicators and were ranked at the bottom of the KPIs list in terms of importance perception.
Table 6: T-test for company size categories
| Performance indicator | Mean | Rank |
| Quality of products and services | 4.82 | 1 |
| Rate of one time delivery | 4.69 | 2 |
| Occupational health & safety | 4.53 | 3 |
| Labour cost | 4.41 | 4 |
| Material cost | 4.41 | 5 |
| Net profit | 4.35 | 6 |
| Level of employee satisfaction | 4.27 | 7 |
| Ratio of training hours | 4.27 | 8 |
| Injury rate | 4.12 | 9 |
| Solid and liquid waste produced | 3.94 | 10 |
| Investments in innovation and and research and development | 3.90 | 11 |
| Amount of greenhouse gases generated | 3.90 | 12 |
| Operational and capital costs | 3.78 | 13 |
| Total energy consumption | 3.78 | 14 |
| Total water consumption | 3.78 | 15 |
| Disposal of waste | 3.71 | 16 |
| Investments in community development activities | 3.65 | 17 |
| Environmental certification | 3.37 | 18 |
In comparison with the usage perception results reported in section 3.3, it can be seen that practically almost all the indicators that were most used in automotive practices are perceived as the most important in OP assessment and management in the sector. Quality, time, safety, and cost are the highly perceived indicators in terms of usage and importance for OP management. Investments in community development activities and environmental certification are evenly the least perceived. It is suggested then to remove these two indicators from the initial proposed catalog of KPIs for OP management in the automotive industry. As shown in Figure 5, a total of sixteen measures with three dimensions of economic, social, and environmental have been proposed as the KPIs for OP assessment and management in the automotive industry.
So as to ensure the adequacy and the compliance of the proposed catalog of KPIs with automotive firms’ practices, participants were asked to indicate whether the relevant indicators for overall performance management have been all considered in the proposed KPIs and if their companies are using other indicators that they found important to monitor OP. From the respondents, 80% confirmed that the appropriate metrics for OP management had been all considered. Likewise, the majority indicated that they use indicators from the proposed KPIs, and only 25% use other metrics such as flexibility and finance that they consider important. It is evident that some companies use specific indicators that they consider important for their overall performance depending on their special objectives in the short and long term. Yet, our final set of KPIs established on the basis of this survey can always be adapted to the case of the company that uses it by adding the indicators that it considers necessary for its overall performance management. Otherwise, if some users feel that the proposed set of indicators contains too many KPIs, they can obviously adapt it by eliminating indicators that they consider unnecessary for their OP measurement, based on the opinion of high-ranking managers and experts in sustainability implementation and OP measurement.
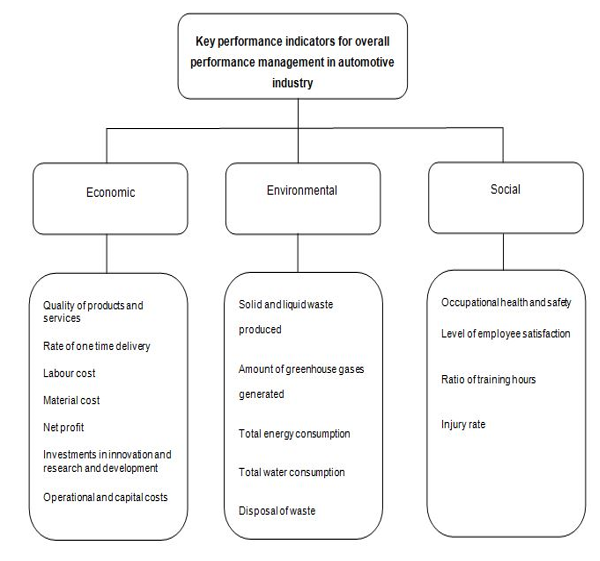
Figure 5: Proposed KPIs for OP management in automotive industry
3.5. Correlation of KPIs
To investigate the impact of the different KPIs on each other, the Pearson rank correlation was performed, using the statistical package SPSS, as shown in table 7. Results show that there generally exist substantial correlations between the various KPIs. For instance, quality is positively correlated with one time delivery, safety, solid and liquid waste produced, labour cost, employee satisfaction, and energy consumption. This emphasizes the importance of these indicators in achieving an automotive firm’s quality. One time delivery is evenly correlated with safety, employee satisfaction, solid and liquid waste produced, amount of GHG generated, and investments in innovation and R&D. This implies that any increase/decrease in these indicators will significantly influence the delivery performance of the company. Safety also has a significant correlation with employee satisfaction. This may be attributed to the important impact of safety on people in the organization as advocated in [13]. Overall, it can be seen that most of the KPIs are significantly related to each other, which signifies that they forge substantial linkages and shall not be studied separately. In other words, these KPIs must be considered as diverse features of the same overall performance.
Table 7. Correlation test between the different KPIs
| KPIs | Quality of products and services | Material cost | Labour cost | Operational and capital costs | Net profit | Rate of one time delivery | Investments in innovation and research and development | Total water consumption | Total energy consumption | Amount of greenhouse gases generated | Solid and liquid waste produced | Disposal of waste | Environmental certification | Injury rate | Occupational Health & Safety | Level of employee satisfaction | Investments in community development activities | Ratio of training hours |
| Quality of products and services | 1 | |||||||||||||||||
| Material cost | 0.196 | 1 | ||||||||||||||||
| Labour cost | 0.393** | 0.392** | 1 | |||||||||||||||
| Operational and capital costs | 0.208 | 0.211 | 0.201 | 1 | ||||||||||||||
| Net profit | 0.244 | 0.051 | 0.233 | 0.382** | 1 | |||||||||||||
| Rate of one time delivery | 0.537** | 0.081 | 0.514** | 0.132 | 0.354* | 1 | ||||||||||||
| Investments in innovation and research and development | 0.182 | 0.122 | 0.174 | 0.290* | 0.211 | 0.324* | 1 | |||||||||||
| Total water consumption | 0.003 | 0.088 | 0.250 | -0.007 | -0.003 | 0.092 | 0.211 | 1 | ||||||||||
| Total energy consumption | 0.322* | 0.204 | 0.428** | 0.428** | 0.158 | 0.269 | 0.214 | 0.493** | 1 | |||||||||
| Amount of greenhouse gases generated | 0.175 | 0.176 | 0.472** | -0.018 | 0.185 | 0.403** | 0.328* | 0,757** | 0,511** | 1 | ||||||||
| Solid and liquid waste produced | 0,395** | 0,166 | 0,522** | 0,368** | 0,291* | 0,429** | 0,363** | 0,390** | 0,725** | 0,481** | 1 | |||||||
| Disposal of waste | 0,189 | 0,005 | 0,286* | 0,584** | 0,102 | 0,253 | 0,370** | 0,225 | 0,664** | 0,339* | 0,687** | 1 | ||||||
| Environmental certification | 0,065 | 0,071 | 0,193 | 0,076 | 0,284* | 0,236 | 0,317* | 0,488** | 0,345* | 0,595** | 0,340* | 0,168 | 1 | |||||
| Injury rate | -0,179 | -0,076 | -0,073 | -0,048 | 0,038 | -0,036 | 0,181 | 0,510** | 0,193 | 0,485** | ,067 | 0,163 | 0,613** | 1 | ||||
| Occupational health and safety | 0,430** | 0,221 | 0,498** | 0,146 | 0,257 | 0,564** | 0,429** | 0,155 | 0,371** | 0,436** | 0,597** | 0,360** | 0,299* | -0,004 | 1 | |||
| Level of employee satisfaction | 0,325* | 0,076 | 0,594** | 0,098 | 0,113 | 0,544** | 0,258 | 0,194 | 0,415** | 0,450** | 0,635** | 0,432** | 0,268 | -0,035 | 0,669** | 1 | ||
| Investments in community development activities | -0,105 | -0,183 | -0,018 | 0,133 | -0,057 | 0,046 | 0,346* | 0,537** | 0,238 | 0,488** | 0,211 | 0,368** | 0,365** | 0,436** | 0,114 | 0,249 | 1 | |
| Ratio of training hours | 0,028 | 0,211 | 0,202 | 0,323* | 0,133 | 0,142 | -0,089 | -0,142 | 0,335* | -0,134 | 0,178 | 0,366** | -0,167 | -0,245 | 0,080 | 0,201 | -0,082 | 1 |
** Correlation is significant at the 0.01 level (2-tailed)
* Correlation is significant at the 0.05 level (2-tailed)
4. Conclusions
Sustainability has become a strategic priority for the automotive industry worldwide. Companies preoccupied with adopting this strategy should necessarily manage and monitor their OP [48] and use key performance indicators that ensure they’re achieving their preset targets and goals. However, many of these firms face difficulties in implementing and managing OP measurement systems and tend to surcharge themselves with a lot of KPIs [20]. This study investigates how OP measurement systems are perceived and managed in the Moroccan automotive sector and explores the KPIs relevant to this manufacturing field.
For this purpose, a literature review was first carried out to establish an initial catalog of KPIs commonly used in manufacturing to manage OP. A questionnaire-based survey was then conducted on 51 companies in the Moroccan automotive sector to get an overview about OP management and investigate the established KPIs in this industry.
Findings of the survey reveal a significant problem of effectiveness of OP measurement process in automotive companies’ practice. Results showed that over half of the respondents utilize spreadsheets or manual processes to monitor OP, and only a few respondents use advanced applications. This indicates that there is a significant lack of use of the appropriate tools of overall performance management. Moreover, most respondents declared that “Too many indicators” followed by “Too many departments involved” are the challenges most affect them in the OP monitoring process. This is in line with what was advocated in the literature about the OP management complexity, which results, among others, from the multitude of indicators and departments involved, and causes important difficulties for decision-makers [8,11,20]. The unexpected result was that the most significant respondents have less than 25% of decisions and changes triggered by KPIs deployment. This is in contrast with KPIs’ role supposed to support decision-making in the firm [13]. Further analysis reveals that the major part of managers is not satisfied with their companies’ OP measurement process.
This last part of the study showed the importance of rigorous identification of KPIs practically needed to facilitate OP implementation and management in the automotive sector. For this purpose, we examined the use of the previously proposed catalog of KPIs in the studied sample of firms. The results showed that “Quality of products and services” is the most used indicator with a response rate of 98%, which is consistent with the results of [12] in which the author confirmed that automobile organizations put more focus on product quality according to client demand. In general, it was found that the automotive companies use the different OP dimensions metrics (social, economic, and environmental) in their practices. Despite this, it was seen that environmental certification and investments in community development activities are the least used indicators, probably due to the complexity of implementation and the high cost of such assets [8].
Conflict of Interest
The authors declare no conflict of interest.
- Ministry of Industry, The industry created 288,126 jobs between 2014 and 2017 and is positioned as a major job provider, 2017.
- J. Deveaux, Morocco: the automobile confirms itself as a major player in the economy, 2020.
- M. Diop, Automotive: How Morocco snatched Africa’s number 1 spot from South Africa., 1, 2018.
- G. Scur, A.M. De Mello, L. Schreiner, F.J. das Neves, “Eco-design requirements in heavyweight vehicle development – a case study of the impact of the Euro 5 emissions standard on the Brazilian industry,” Innovation & Management Review, 16(4), 404–422, 2019, doi:10.1108/INMR-08-2018-0063.
- A.N. Nambiar, “Challenges in Sustainable Manufacturing,” in Proceedings of the 2010 International Conference on Industrial Engineering and Operations Management, Dhaka, Bangladesh, January 9-10, 10–15, 2010.
- E.L. Psomas, C. Fotopoulos, D. Kafetzopoulos, “Motives, difficulties and benefits in implementing the ISO 14001 Environmental Management System,” Management of Environmental Quality: An International Journal, 22(4), 502–521, 2011, doi:http://dx.doi.org/10.1108/14777831111136090.
- I. Gavronski, G. Ferrer, E.L. Paiva, “ISO 14001 certification in Brazil: motivations and benefits,” Journal of Cleaner Production, 16(1), 87–94, 2008, doi:10.1016/j.jclepro.2006.11.002.
- M.L. Martín-Peña, E. Díaz-Garrido, J.M. Sánchez-López, “Analysis of benefits and difficulties associated with firms ’ Environmental Management Systems : The case of the Spanish automotive industry,” Journal of Cleaner Production, 70(May), 220–230, 2014, doi:10.1016/j.jclepro.2014.01.085.
- M. Capron, F. Quairel, “An Assessment of Sustainable Development Strategies of the Firm: The attractive Utopia of Global Performance [Evaluer les stratégies de développement durable des entreprises : l’utopie mobilisatric],” Review of the Responsible Organization, 1, 5–17, 2006, doi:10.3917/ror.001.0005.
- A. Renaud, N. Berland, “Companies overall performance measurement [Mesure de la performance globale des entreprises.],” Accounting and Environment, CD-Rom. halshs-00544875 HAL, 2007.
- A. Lamjahdi, H. Bouloiz, M. Gallab, “Toward a model to apprehend the complexity of manufacturing firm ’ s overall performance,” International Journal of Engineering Business Management, 12, 1–20, 2020, doi:10.1177/1847979020901982.
- M. Ishaq Bhatti, H.M. Awan, “The key performance indicators (KPIs) and their impact on overall organizational performance,” Quality and Quantity, 48(6), 3127–3143, 2014, doi:10.1007/s11135-013-9945-y.
- P.N. Muchiri, L. Pintelon, H. Martin, A.M. De Meyer, “Empirical analysis of maintenance performance measurement in Belgian industries,” International Journal of Production Research, 48(20), 5905–5924, 2010, doi:10.1080/00207540903160766.
- G. Marsden, C. Kelly, C. Snell, “Selecting indicators for strategic performance management,” Transportation Research Record, (1956), 21–29, 2006, doi:10.3141/1956-03.
- M.R. Galankashi, S.A. Helmi, P. Hashemzahi, “Supplier selection in automobile industry: A mixed balanced scorecard-fuzzy AHP approach,” Alexandria Engineering Journal, 55(1), 93–100, 2016, doi:10.1016/j.aej.2016.01.005.
- S. Singh, E.U. Olugu, S.N. Musa, “Development of Sustainable Manufacturing Performance Evaluation Expert System for Small and Medium Enterprises,” Procedia CIRP, 40, 609–614, 2016, doi:10.1016/j.procir.2016.01.142.
- E. Amrina, U. Andalas, S. Yusof, “Manufacturing performance evaluation tool for Malaysian automotive small and medium-sized enterprises,” International Journal of Business Science and Applied Management, (January), 195–213, 2010.
- S. Toor, S.O. Ogunlana, “Beyond the ‘ iron triangle ’: Stakeholder perception of key performance indicators ( KPIs ) for large-scale public sector development projects,” International Journal of Project Management, 28(3), 228–236, 2010, doi:10.1016/j.ijproman.2009.05.005.
- R.F. Cox, R.R.A. Issa, M. Asce, D. Ahrens, “Management ’ s Perception of Key Performance Indicators for Construction,” Journal of Construction Engineering and Management, (April), 142–151, 2003.
- K.K.B. Hon, “Performance and Evaluation of Manufacturing Systems,” CIRP Annals – Manufacturing Technology, 54(1), 139–154, 2005.
- L. Helleno, A. Jos, “Integrating sustainability indicators and Lean Manufacturing to assess manufacturing processes : Application case studies in Brazilian industry,” 153, 2017, doi:10.1016/j.jclepro.2016.12.072.
- E. Amrina, S.M. Yusof, “An AHP based-model for sustainable manufacturing performance evaluation in automotive industry,” in Proceedings of the International Symposium on the Analytic Hierarchy Process, 2013.
- M. Akbar, T. Irohara, “Scheduling for sustainable manufacturing: A review,” Journal of Cleaner Production, 2018, doi:10.1016/j.jclepro.2018.09.100.
- A. Lamjahdi, H. Bouloiz, M. Gallab, “Overall performance indicators for sustainability assessment and management in mining industry,” in 2021 7th International Conference on Optimization and Applications, ICOA, IEEE, Wolfenbüttel, Germany: 1–6, 2021, doi:10.1109/ICOA51614.2021.9442635.
- Z. Wang, N. Subramanian, A. Gunasekaran, M.D. Abdulrahman, C. Liu, “Composite sustainable manufacturing practice and performance framework: Chinese auto-parts suppliers’ perspective,” International Journal of Production Economics, 170, 219–233, 2015, doi:10.1016/j.ijpe.2015.09.035.
- E. Chardine-Baumann, V. Botta-Genoulaz, “A framework for sustainable performance assessment of supply chain management practices,” Computers and Industrial Engineering, 76(1), 138–147, 2014, doi:10.1016/j.cie.2014.07.029.
- M.K. Lim, M. Tseng, K. Hua, T. Dat, “Knowledge management in sustainable supply chain management : Improving performance through an interpretive structural modelling approach,” Journal of Cleaner Production, 162, 806–816, 2017, doi:10.1016/j.jclepro.2017.06.056.
- R. Henao, W. Sarache, I. Gómez, “Lean Manufacturing and Sustainable Performance : Trends and Future Challenges,” 2018, doi:10.1016/j.jclepro.2018.10.116.
- K. Govindan, R. Khodaverdi, A. Jafarian, “A fuzzy multi criteria approach for measuring sustainability performance of a supplier based on triple bottom line approach,” Journal of Cleaner Production, 47, 345–354, 2013, doi:10.1016/j.jclepro.2012.04.014.
- C. Hsu, A. Chang, W. Luo, “Identifying key performance factors for sustainability development of SMEs – integrating QFD and fuzzy MADM methods,” Journal of Cleaner Production, 161, 629–645, 2017, doi:10.1016/j.jclepro.2017.05.063.
- A. Huang, F. Badurdeen, “Metrics-based Approach to Evaluate Sustainable Manufacturing Performance at the Production Line and Plant Levels,” Journal of Cleaner Production, 2018, doi:10.1016/j.jclepro.2018.04.234.
- C.B. Joung, J. Carrell, P. Sarkar, S.C. Feng, “Categorization of indicators for sustainable manufacturing,” Ecological Indicators, 24, 148–157, 2012, doi:10.1016/j.ecolind.2012.05.030.
- M.L. Tseng, “Modeling sustainable production indicators with linguistic preferences,” Journal of Cleaner Production, 40, 46–56, 2013, doi:10.1016/j.jclepro.2010.11.019.
- A. Huang, F. Badurdeen, “Sustainable Manufacturing Performance Evaluation: Integrating Product and Process Metrics for Systems Level Assessment,” Procedia Manufacturing, 8(October 2016), 563–570, 2017, doi:10.1016/j.promfg.2017.02.072.
- A. Cater-Steel, L. Al-Hakim, Information systems research methods, epistemology, and applications, 226–240, 2008, doi:10.4018/978-1-60566-040-0.
- H. El ouazzani, K. Rouggani, “Financing small and medium-sized enterprises: the case of morocco [Le financement des petites et moyennes entreprises : cas du Maroc],” in International conference: Finance, management control and overall performance of organizations, 2018.
- E. Amrina, S. Yusof, “Key Performance Indicators for Sustainable Manufacturing Evaluation in Automotive Companies,” in Proceeding of the 2011 IEEE IEEM, 1093–1097, 2011.
- A.H. Azadnia, M.Z.M. Saman, K.Y. Wong, P. Ghadimi, N. Zakuan, “Sustainable Supplier Selection based on Self-organizing Map Neural Network and Multi Criteria Decision Making Approaches,” Procedia – Social and Behavioral Sciences, 65, 879–884, 2012, doi:10.1016/j.sbspro.2012.11.214.
- C.B. Joung, J. Carrell, P. Sarkar, S.C. Feng, “Categorization of indicators for sustainable manufacturing,” Ecological Indicators, 24, 148–157, 2013, doi:10.1016/j.ecolind.2012.05.030.
- E. Amrina, A.L. Vilsi, “Key Performance Indicators for Sustainable Manufacturing Evaluation in Cement Industry,” Procedia CIRP, 26, 19–23, 2015, doi:10.1016/j.procir.2014.07.173.
- H.X. Tan, Z. Yeo, R. Ng, T.B. Tjandra, B. Song, “A sustainability indicator framework for Singapore small and medium-sized manufacturing enterprises,” in Procedia CIRP, Elsevier B.V.: 132–137, 2015, doi:10.1016/j.procir.2015.01.028.
- R. Usha, G. Angappa, S. Nachiappan, “Supply chain collaboration performance metrics : a conceptual framework,” Benchmarking: An International Journal, 18(6), 856–872, 2014, doi:10.1108/14635771111180734.
- M. Yurdakul, “Measuring a manufacturing system’s performance using Saaty’s system with feedback approach,” Integrated Manufacturing Systems, 13(1), 25–34, 2002, doi:10.1108/09576060210411486.
- A. Ehs, Occupational health and safety-Automotive Industry, 2019.
- S.R. Rao, G. Padmanabhan, “Application of Taguchi methods and ANOVA in optimization of process parameters for metal removal rate in electrochemical machining of Al/5% SiC composites,” International Journal of Engineering Research and Applications (IJERA), 2(3), 192–197, 2012.
- S.F. Sawyer, “Analysis of Variance : The Fundamental Concepts,” Journal of Manual & Manipulative Therapy, 17(2), 27–38, 2009, doi:10.1179/jmt.2009.17.2.27E.
- X.A. Koufteros, M.A. Vonderembse, W.J. Doll, “Developing measures of time-based manufacturing,” Journal of Operations Management, 16(1), 21–41, 1998, doi:10.1016/S0272-6963(97)00027-2.
- S. Arendt, M. Brettel, “Understanding the influence of corporate social responsibility on corporate identity , image , and firm performance,” Management Decision, 48(10), 1469–1492, 2010, doi:10.1108/00251741011090289.
Citations by Dimensions
Citations by PlumX
Google Scholar
Crossref Citations
No. of Downloads Per Month
No. of Downloads Per Country