Analysis of Reading Time and the Number of Characters within One Gazing Point
Volume 6, Issue 6, Page No 137-144, 2021
Author’s Name: Yusuke Nosakaa), Miho Shinohara, Hidemi Ishikawa, Yuko Hoshino, Mitsuho Yamada
View Affiliations
Tokai University, Tokyo, 108-8619, Japan
a)whom correspondence should be addressed. E-mail: yusuke_n@star.tokai-u.jp
Adv. Sci. Technol. Eng. Syst. J. 6(6), 137-144 (2021); ![]() DOI: 10.25046/aj060618
DOI: 10.25046/aj060618
Keywords: Gaze point, Reading time, Display Method
Export Citations
Concomitant with the ubiquity of lightweight electronic terminals, such as smartphones and tablets, e-books have increased in popularity. However, studies have shown that their display method and information-presentation efficiency need improvement. We investigated visual information processing during reading to develop a more efficient display method that presents information in an easier to see fashion than conventional methods. Specifically, we focused on the information- processing ability of the brain within the gazing point during reading to clarify various factors that make a book easier to read such as the minimum display time and line length that can be read accurately and the difference in reading time depending on the font. An experimental method using a “window” was utilized that facilitates changing of the display information in the window by moving the window in conjunction with the eye movement. Using this method, it was found that if the number of characters displayed in the window is more than six and the window display time is 56 ms or more, reading can be performed in the same manner as when the window is not displayed. Thus, here we focused on letter size to investigate the relationship between reading time and font size. Experimental results indicate that among sentences in three font sizes 12, 18, and 24 pt normal reading without any restriction of view is possible when the font size is 18 pt or more. These results suggest that normal reading can be performed even with a very short display time of 56 ms by using characters with a font size of 18 pt or more in Japanese, which is useful for proposing a new display method for e-books. In addition, this experimental method can be applied to languages other than Japanese, and can contribute to the development of an optimum display method for each language.
Received: 18 October 2021, Accepted: 05 December 2021, Published Online: 23 December 2021
1. Introduction
In recent years, small and lightweight electronic terminals, such as smartphones and tablets, have become widespread. Their importance has been increasing because information is digitized and can be accessed from various terminals. Simultaneously, e-books are becoming more widespread, and dedicated terminals and smartphone applications for e-books have appeared. An environment that facilitates the reading of e-books rather than conventional paper books has been established, and the advantages of e-books such as term search function, character size change, and percentage display of the current reading position further support their spread. Studies exist on eye movements related to reading: analyses have been performed on the impact of negative and positive words on reading [1], and the conjecture of the concentration degree from eye movements during reading [2]. In recent years, studies have been conducted on the effectiveness of reading and education using e-books, for example, learning via reading e-books and paper books has been compared and analyzed [3, 4], and effective learning methods using e-books have been developed and evaluated for foreign languages [5, 6].
There are differences in eye movements between reading e-books and conventional paper books. In particular, eye movements when turning pages differ between paper books and e-books, depending on the manner the pages are turned. In the case of e-books, the eye often moves linearly from the end of the page to the beginning of the screen where the next page is displayed, whereas in the case of paper books, it may follow the movement of the paper on the page to be turned [7]. We hypothesized that, by analyzing eye movements during reading, it would be possible to develop new display methods reflecting the acceptance characteristics of human visual information not only in e-books but also in other applications that present visual information on displays.
A previous study clarified the minimum display time and the minimum number of characters required for display within one gazing point required for normal reading. Consequently, in this current study, we investigated the differences in reading time by changing the font size displayed in one gaze point. By clarifying the minimum font size required for normal reading through this study, we hope to propose a display method that enables efficient and fast reading.
The eye movement during reading is a repetition of saccade, which is a high-speed and intermittent eye movement, from one gaze point to the next gaze point [8–11]. During saccade, the visual-information-processing ability is reduced owing to the perceptual phenomenon of saccadic suppression [12–14]. More specifically, the information processing during reading is mainly performed within the gaze period, and it is necessary to examine the information-processing ability within the gaze point to clarify the visual-information-processing ability during reading. However, the only way to analyze the information-processing capacity within the gazing point is to use a “window” that can control the visual information displayed within the gazing point. To this end, we used a device developed in previous research for controlling the display image in the gaze point [15]. By so doing, it is possible to obtain the knowledge necessary for studying a display method that adaptively processes the size and display time of display characters based on the characteristics of human visual information processing.
Previous studies in this area are extremely important for understanding this paper. Thus, Section 2 summarizes the research on the perceptual range (effective field of view) that had a major influence on previous research. In Section 3, we discuss the analyzer [15] and the experimental results on the reading time when the gaze time is limited to 98 ms. Furthermore, the experimental results that clarified the lower limit of the gaze time required for reading are described [16]. Section 4 describes our analysis method and the experimental results obtained for different font sizes. Section 5 concludes the paper and discusses future developments.
2. Effective Field of View during Reading
Humans do not recognize all the information in their field of view, only the part on which they are focused. The size of the effective visual field changes depending on the type of visual work, but the range in which such effective information can be obtained is called the effective field of view [17]. Many experiments have been conducted to investigate the effective field of view, but all of them used estimation methods. Subsequently, by proposing an experimental method using windows [18], the research advanced dramatically by progressing from estimation.
The visual task in this study is reading. The experimental method using a window is a method of changing the display information in the window by moving the window in conjunction with the eye movement. The effective field of view is investigated by moving the window within a period called saccadic suppression in which the function of visual information processing deteriorates in the brain; the window refers to the display range of the image on the display.
2.1. Study Conducted by Saida and Ikeda
In [19], the author acquired the eye movements of their subjects using the limbus tracking method. Limbus tracking is a method of irradiating infrared light near the boundary between the sclera and cornea and measuring eye movements by utilizing the difference in reflectance. The researchers used two TV cameras. They input the acquired X and Y positions of the eyeball into the X-Y oscilloscope and displayed a horizontally long rectangle at that position. The image of the X-Y oscilloscope was recorded with the first camera, and the board on which the text was written with the other camera. The area corresponding to the X and Y positions of the eyeball was switched with a switcher similar to a wipe process using the rectangular image generated by shooting the X-Y oscilloscope from the video of the TV camera that recorded the text. In this way, the window for displaying characters was moved in conjunction with the eye movements. Based on this experiment, Saida and Ikeda indicated that sentences can be read normally, as in the condition without a window, if the characters displayed on the rectangle (window) exceeded 13 characters. This indicates that the processing range of one gazing point is approximately 13 characters.
However, three limitations of this experiment should be noted. (1) The rectangle is displayed directly on the oscilloscope by the output of the eye movement, the gaze point is not detected, and the gaze part is not switched. To clarify the visual information processing at the gazing point, it is necessary to first detect the gazing point and change the image of this area. (2) Because of the camera and cathode-ray tube (CRT) display used, it is expected that afterglow and afterimage would occur, but no description was provided. Therefore, it is not possible to obtain an accurate display time for presenting a window image. (3) The display time of the window changes depending on the gaze time because the window moves in conjunction with the eye movement. Controlling the display time of information at the gazing point is indispensable when considering information processing at the gazing point.
2.2. Studies Conducted by McConkie and Rayner
In [20–23], the author input the eye movements acquired by the limbus tracking method into a PDP-6 minicomputer and controlled the DEC Model 340 display with built-in uppercase and lowercase characters. With this display, they conducted experiments by preparing six types of replacement patterns, such as characters with similar glyphs, in addition to the original text characters displayed at the gazing point. In their studies, they showed that the effective field of view was 13 characters, which is similar to the findings of Saida and Ikeda.
The abovementioned experiment has two issues: (1) The time the previous character remained on the screen at the time of switching was not measured, only a description of short afterglow was provided. However, the experiment was conducted with a CRT using phosphor with the least afterglow, and the authors were aware of the effects of the afterglow. They stated that the letters were not perceived before being covered by the window, and therefore afterglow did not interfere with the experiment. (2) The saccade was not detected, the window image was switched when the eye movement exceeded a certain distance from the left end of the sentence, and the display time of the window image was not controlled. Therefore, it cannot be replaced only for a certain period within the gazing point.
In addition, recent studies using windows introduced research on the perceptual range when learning a language other than the mother tongue [24] and on the perceptual characteristics when the resolution is changed in conjunction with eye movement. Leung investigated the range of perception of Japanese university students learning English as a foreign language while reading English sentences; however, they did not investigate the temporal characteristics of human visual information processing during reading. Loschky and McConkie examined the time to perceive blur or flicker when displayed at different resolutions from the standpoint of user performance, but they did not examine the time required to acquire visual information.
A device has subsequently been developed that can detect eye movements during reading and control the display information around the gazing point. This enables clarification of the amount of information that can be processed within one gazing point and the required processing time [7, 15, 16].
3. Previous Research on Information Processing within the Gazing Point
This study clarifies how the reading time changes depending on the size of the font displayed in the gazing point that occurs during reading. For this experiment, it is necessary to solve the problems described in Section 2, that is, afterimage, afterglow, and real-time detection of gaze point. To this end, the features of the device developed by Kushima for that purpose are explained in Section 3.1. Section 3.2 describes the basic experiments performed to detect the gaze point that occurs during reading in real time, and describes the saccade velocity as the threshold value for detecting saccade in this study using the device described in Section 3.2. Section 3.3 describes the experimental results of using this device to extract the gaze point with the saccade velocity as the threshold, display the window, and change the number of characters displayed in the window. Through this experiment, Kushima clarified the number of characters displayed in a window that allows for reading equivalent to that without a window. Section 3.4 further describes the research results obtained by Nomura regarding the window display time, that is, the minimum gaze time, which enables reading equivalent to that without a window.
Based on these results, Section 4 describes the experimental results of the current study, focusing on the number of characters displayed in the gazing point, the display time, and the font displayed in the window, especially the font size.
3.1. Development of Display Image Control Device
In [15], the author developed an experimental device to solve the problems described in the previous section. Table 1 shows the equipment used, Figures 1 and 2 show the configuration diagram and flowchart, respectively. Figure 3 shows the display for the subjects, and Figure 4 shows the eye movement measuring device, EMR-9.
Table1: Equipment used in the experimental device [15]
| Eye Movement
Measuring Device |
EMR-9
(NAC Imaging Technology) |
| Data Processing PC | OS: Windows 7 Professional |
| CPU: Core i7 3770
@ 3.40 GHz |
|
| Memory: 32GB | |
| Display | CRT Display
(iiyama HM204D A) |
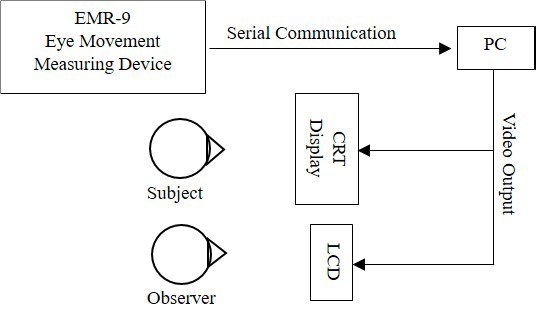 Figure 1: Configuration of the experimental device developed in [15]
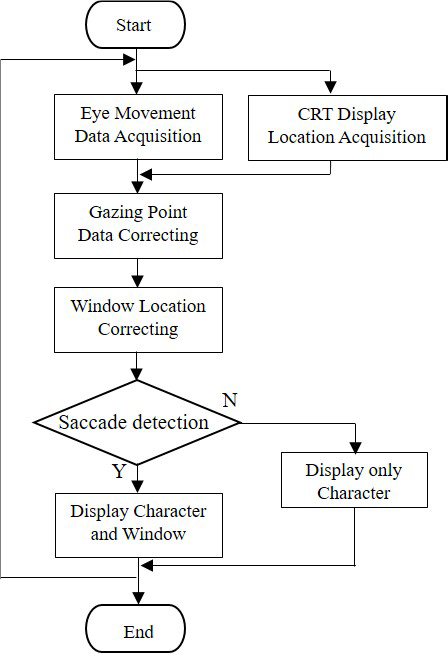 Figure 2: Flowchart of the experimental system developed in [15]
 Figure 3: CRT display for the subject: a rectangle is displayed to estimate the coordinates of the field of view camera.
 Figure 4: Eye movement measuring device EMR-9
It is a compact and lightweight eye tracking device based on the concept of mobility. It is possible to more naturally measure daily behavior without burdening the subject.
Eye movement is input from the eye movement measuring device to the information processing PC, and the saccade is detected by the threshold value described in Section 3.3. The displays consisted of a liquid crystal display for the experimenter and a CRT display for the subject (Figure 3). For the subject display, a short afterglow CRT display (< 1 ms) was used instead of the hold-type liquid crystal display. Since CRT displays are no longer commercially available, they have been maintained and dynamically preserved for such experiments. The text is displayed on the CRT display for the subject, and the image of the field camera of the eye movement measuring device EMR-9 is output on the liquid crystal display for the experimenter to monitor the movement of the line of sight when the subject is reading the text. The software on the information processing PC executes two threads in parallel. One thread acquires the position of the rectangle to be displayed on the CRT display from the image of the field camera of EMR-9 (Figure 3). The other thread acquires eye movement data from EMR-9 via serial communication and calculates the position and movement speed of the gazing point, the angle of rotation of the eye, and the angular acceleration. If a saccade is detected, a window image is presented at the position of the gaze point on the CRT display (lower right of Figure 5); if a saccade is not detected, only the first three characters of each line are displayed as a reference to start reading.
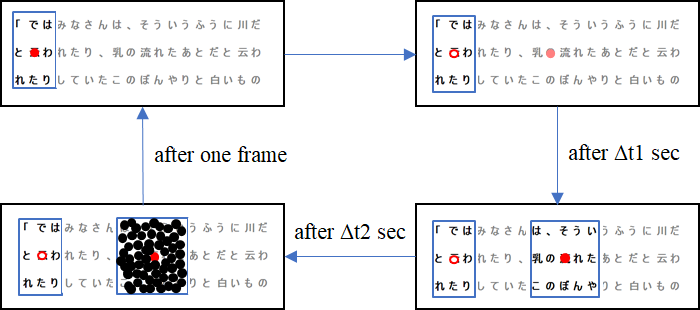 Figure 5: Examples of switching the display image in the window during the experiment
Figure 5 shows an example of switching the display image in the window during the experiment. Figure 6 shows the screen of the corresponding CRT display. The red dot in Figure 5 is the gazing point (the point with only the outline is the previous gazing point), and the blue frame is the range displayed to the subject. When the gazing point moves and a saccade is detected, a window image is displayed after Δt1 seconds of a saccade detection, as shown in the lower right of Figure 5. The displayed window image was cut out from the displayed text based on the size of the window. After displaying the window image for Δt2 seconds, random dots (masking image) are displayed for one frame in the range where the window image is displayed. This process was repeated until the subject finished reading. In the experiment, the experimenter arbitrarily changed the values of Δt1 and Δt2.
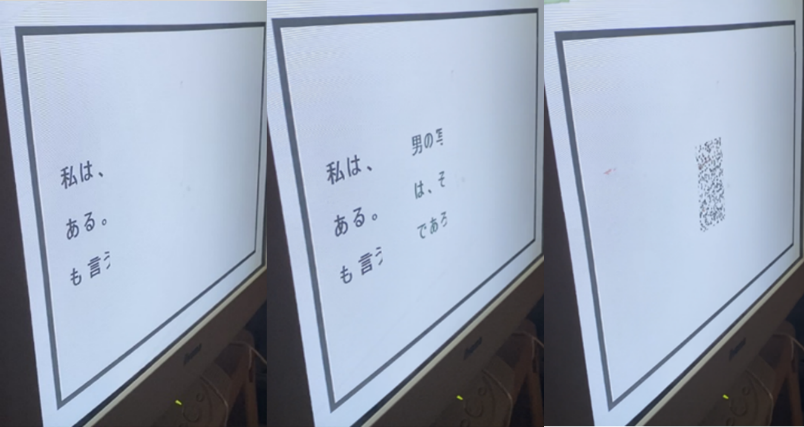 Figure 6: Changes on the CRT screen corresponding to Figure 5
Figure 7 shows the time flow of the process of displaying the window image at the gazing point. The switching of the displayed image in the window must be performed within saccadic suppression, which is the period during which the ability of visual information processing in the brain is reduced. As shown in Figure 7, it takes 52 ms to capture the eye movement data from EMR-9 into the information processing computer. Overall, it takes 85 ms to determine the gazing point. This is within the time range of a saccadic suppression, but considering that saccadic suppression lasts for approximately 200 ms, it is necessary to control the image replacement time of the gaze part in millisecond units. Because the refresh rate of a general display is 60 Hz and drawing is performed approximately every 16.7 ms, it is considered that a delay of 16.7 ms at the maximum will occur. In addition, if the image switching of the gaze part occurs immediately after the drawing of the display is performed, image switching of the gaze part may not occur on the display. To prevent this phenomenon, the author implemented a vertical synchronization function that synchronized the drawing of the display with the drawing of the program.
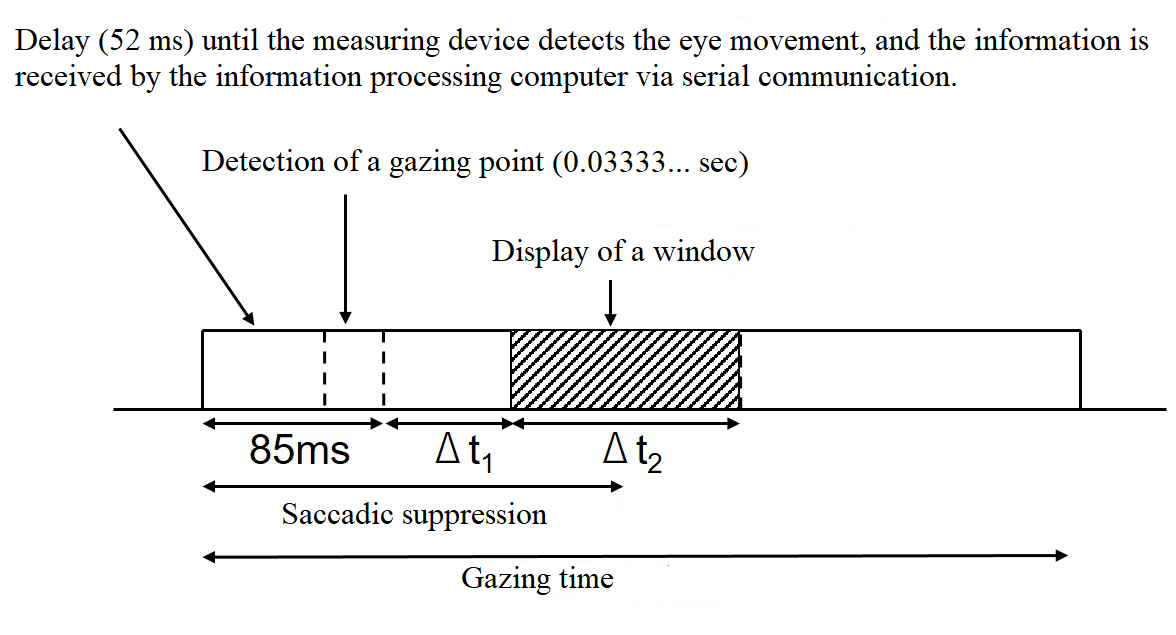 Figure 7: Time flow of the process of displaying the window image in the gazing point
Δt1: time from the detection of saccade until the window image is displayed
Δt2: Time to display the window
3.2. Definition of a Gazing Point
Eye movement during reading is not smooth, but is instead a repetition of gaze and saccade which is an intermittent and high-speed eye movement. In this study, the text was displayed by wiping only the gaze part of the window while reading. For that purpose, it was necessary to extract only the gazing points from the eye movements. Various studies have been conducted to define the gazing point. Even in the state of gaze, the eyeballs are not completely stationary, and small involuntary movements called miniature eye movements occur. Therefore, the author defined a gazing point as including the velocity component of miniature eye movements and smooth pursuit eye movement below a certain velocity [25]. In contract, they studied the definition of the gazing point when gazing at a video image that is constantly moving [26]. Consequently, it has been reported that the definition of the gazing point differs depending on the viewing target, and it is necessary to consider the definition of the gazing point according to the experimental conditions and environment. Thus, we conducted an experiment to define the gazing point in the same experimental environment and conditions as the experiment conducted this time.
In [26, 27], the cases where the eye movement velocities of 5°/ s and 10°/ s or less last for 150 ms or more are extracted as the gazing point. However, with this definition, it takes at least 150 ms to extract the gazing point, and the window cannot be displayed at the same time as the gaze. The viewing angle per character of the text used in this experiment is about 1.2°, and the average interval of saccades is three to five characters in Japanese kana/kanji mixed text [27]. Thus, viewing targets were displayed at three different intervals of 1, 2, and 3° expected from the subject who repeated the gaze to the left and right from the center of the screen every 5 s 10 times, as shown in Figure 8.
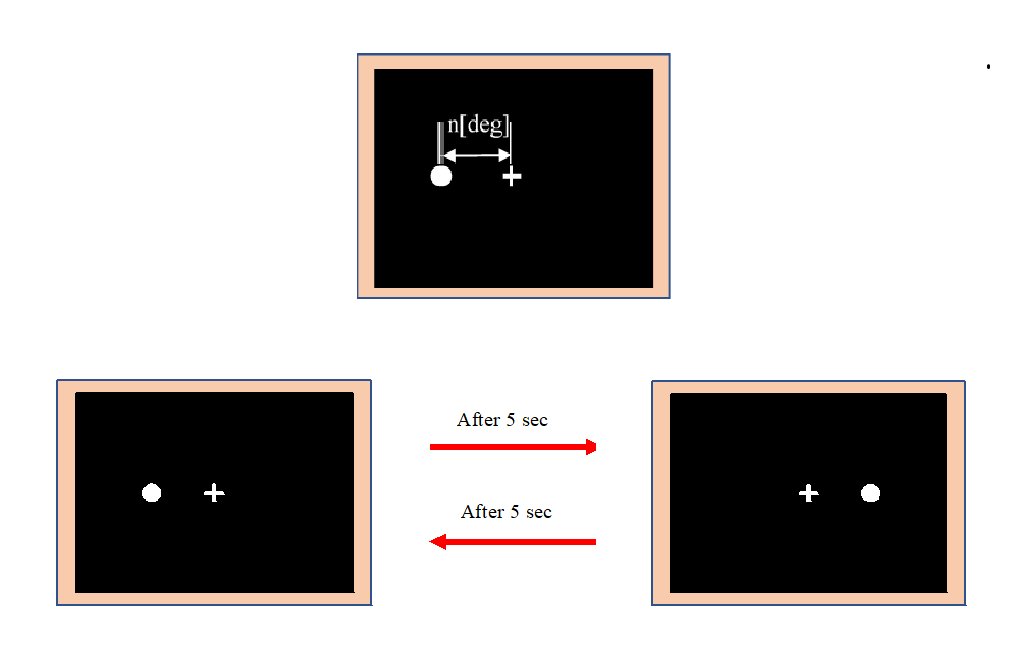 Figure 8: Gaze experiment of moving optotype conducted to determine the speed at which the gaze point is extracted
Based on the measurement results obtained in this manner, the eye movement speed of the threshold value for extracting the start and end of the saccade was changed from 30°/ s to 90°/ s, and the gazing point was extracted. The gazing point was defined as the period from the end of the saccade to the start of the next one. The detection accuracy of the gazing point was verified by comparing the extracted gazing point with the real gazing point.
Figure 9 shows an example in which the gazing point is detected from the eye movement when gazing at a moving target with a viewing angle of 1°. If the threshold speed is appropriate, a total of 20 gazing points, 10 on each side, should be detected. Comparing the eye movement speed thresholds of 42°/ s and 48°/ s, the detection of the gazing point in the red frame failed at 48°/ s, but it was detected accurately at 42°/ s. Similar results were obtained with viewing angles of 2° and 3°. In the studies [15, 16], and the study reported herein, it was judged that saccade started when the eye movement speed exceeded 42°/ s and ended when it was less than 42°/ s. The gazing point was defined as the duration from the end of one saccade to the start of the next saccade.
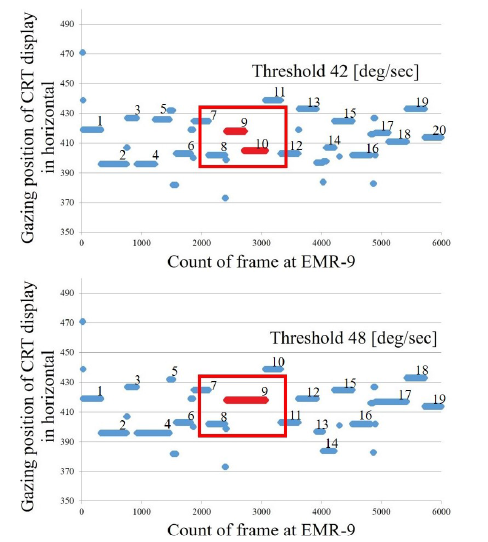 Figure 9: Detecting the gazing point by changing the threshold value for determining the start and end of a saccade (Movement amount of viewing target: 1°, detected gaze point is blue line)
3.3. Number of Characters in a Window
Kushima compared the reading time by increasing or decreasing the number of characters displayed in the window from 3 to 17 characters by two characters using the abovementioned experimental device and definition of gazing point. The image of the text read was an excerpt from a Japanese textbook for third graders. The purpose was to confirm the validity of the definition of the experimental device and the gazing point, and the experiment was conducted by setting the values of Δt1 to 14 ms and Δt2 to 98 ms.
They found that when the window width was greater than nine characters, there was no substantial change in the reading time; that is, when the window display time was 98 ms and nine or more characters were displayed in the window, the reading was the same as without a window [15].
3.4. Minimum Gaze Time
Kushima conducted the experiment with a window display time of only 98 ms. Nomura considered that reading was possible even with a shorter display time, and conducted a similar experiment with a display time of 98 ms or less to investigate the lower limit of the gaze time required for reading. Using the device developed in [15], Δt1 was set to 14 ms, and Δt2 was set to one of six values: 84, 70, 56, 42, 28 and 14 ms. The displayed image contained excerpts from three novels by Aozora Bunko: “Galaxy Railroad Night,” “I am a Cat,” and “Bochan.”
The results showed that when the window display time (Δt2) was short, the reading time was long, and conversely, when the display time was long, the reading time was short. It was also shown that the reading time did not change significantly when the window display time was 56 ms or more and the window width was seven characters or more. Furthermore, the reading time was long and unstable regardless of the window width when the window display time was 42 ms or less [16].
4. Font Size Experiment
Previous studies have shown that when the window display time is 56 ms or more and the window width is seven characters or more, there is no significant difference in reading time with and without a window. The purpose of this experiment is to clarify the font size that enables reading in the same manner as without a window and the relationship between reading time and the font size displayed at one gazing point.
4.1. Experimental Method
Experiments were performed using the same procedure as in [15]. The subjects were seven male students ages 21-22 years from our university. Eight text images were presented to the subjects in order, and the window width was increased by two characters from 3 to 17 characters (up). Then, the window width was presented as reducing by 2 characters from 17 to 3 characters (down). In addition, we prepared three font sizes: 12, 18, and 24 pt. The displayed images were excerpts from the beginnings of novels, “Brothers,” “Restaurant with many orders,” and “Human disqualification,” by Aozora Bunko. We used the early part of each novel so that the difficulty level of reading did not change depending on the content of the text. Figure 10 shows an example of the text from “Brothers.”
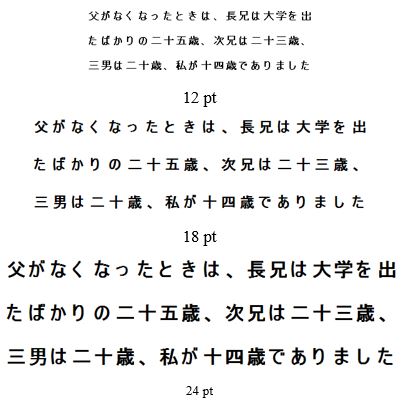 Figure 10: Display examples for each font size (Brothers)
The reading times of the up and down experimental sequences were averaged and compared for each font size. Δt1 was set to 14 ms, which is the same as in the previous study [15], and Δt2 was set to 98 ms, which enables reading without visual field restriction. In addition, to suppress the influence of the presentation order on the experimental results, we adjusted the order in which the images and font sizes were presented to the subjects. To motivate the subjects to fully understand and read the content of the text, the subjects were informed that a confirmation test of comprehension was to be performed after the measurement; this test was conducted after the measurement. This experiment was conducted in accordance with the Tokai University ethical code for human experiments.
4.2. Experimental Results
Figure 11 shows the average reading time for each font size. When the font size was 24 pt, the reading time decreased when the window width expanded from three characters to nine characters, and the fluctuation in reading time was small after nine characters. Similar results were observed at 12 and 18pt. These results are consistent with the results of previous studies [15, 25], and show that if the window width is nine characters or more, normal reading without visual field restriction is possible. From the measured reading time data, analysis of variance was performed based on two factors: font size and window width. The results are shown in Table 2. There was a significant difference at the significance level of 1% in the results of only one factor for each of the font sizes and the window widths. There was no significant difference in the interaction between font and window width sizes.
 Figure 11: Average reading time for each font size
Table 2: Results of ANOVA for font size and window width
| Results | |
| A: Font size | F (2, 144) = 8.577, p < .0001 |
| B: Window width | F (7, 144) = 19.649, p < .0001 |
| A×B | F (14, 144) = 0.940, p = .5183 |
As our focus is on font size, we performed multiple comparisons for the three font sizes 12, 18, and 24 pt; the results are shown in Table 3. There were significant differences between the 12 pt group and both the 18 and 24 pt groups, but there was no significant difference between the 18 and 24 pt groups. These results indicate that when the three font sizes, 12, 18, and 24 pt, are presented, there is no significant change in reading time when the font size is 18 pt or more, and normal reading without visual field limitation is possible.
Table 3: Results of multiple comparisons for font sizes
| Pair | p-value |
| 12pt × 24pt | 0.0003071 |
| 12pt × 18pt | 0.0007033 |
| 18pt × 24pt | 0.8138201 |
4.3. Discussion
Effectively displaying text information on electronic media such as e-books can help to reduce reading time and improve readability. Eye movements during reading are repeated saccades and gaze points. Clarifying the visual information-processing ability during gaze can be useful for proposing a new display method more suitable for information processing in the human brain.
To clarify the visual-information-processing ability in the gazing point, the number of characters displayed in the gazing point and the display time within the gazing point that enable reading similar to normal reading have been investigated by using a window that moves in conjunction with the gazing point.
The experimental results thus have helped to clarify based on the reading time that it is possible to read the same as normal reading without a window by displaying more than six characters for 56 ms or more.
On the other hand, regarding readability, not only in e-books but also in conventional paper books, information of another dimension such as the type and size of the font to be displayed is also involved.
Consequently, in this study, we focused on the size of the font. The smaller the font is, the more information that can be displayed on a limited page, and the more characters that can be displayed in one gazing point. However, it also has the problem of being difficult to read. Therefore, the reading time was evaluated by changing the font size. Our result indicate that there is a significant difference between 12 pt font and 18 and 24 pt font. Furthermore, we were able to obtain knowledge about the display time, number of display characters, and size of the display font.
There are two styles of reading, one is to read and take the time to full absorb all the content, and the other is to read it to get information as quickly as possible. We believe that the results of this study will be useful in proposing a display method for faster and more accurate reading in the latter reading style. Nevertheless, we also believe that this research will be useful for realizing a display environment that facilitates the intake of information and allows more concentration on content even in the former reading style.
The difficulty of studying reading is that it depends on the language. Correct conclusions may not be obtained unless a native language researcher analyzes the native language subject. Therefore, related papers tend to be grouped by language. In the future, it will be important to compare the experimental results between different languages, and we hope that similar research will proceed in other languages with reference to this research result.
5. Conclusion
In recent years, small and lightweight electronic terminals, such as smartphones and tablets, have become widespread. In addition, the spread of e-books is supported by their specific advantages and many associated studies have been conducted. We investigated visual information processing during reading to study a display method that is easier to see and more efficient in presenting information on a display than conventional display methods.
In a previous study, Kushima reported that they developed a measuring device that solves the problems that occurred in experiments to investigate the effective visual field in the past. They also reported that by displaying the image for 98 ms at the time of gazing, regular reading speed was the same as that without visual field limitation. Furthermore, Nomura showed that reading is not possible with the same device at a display time of 42 ms or less and that normal reading is possible by displaying sentences in a window of seven characters at 56 ms.
In this study, to investigate the relationship between reading time and the font size, an experiment was conducted in which sentences were presented in three font sizes, 12, 18, and 24 pt, and the image was displayed for 98 ms at the time of gazing. The results showed that normal reading without any restriction of view is possible when the font size is 18 pt or more.
From the results obtained this time and the results so far, it was shown that by displaying seven or more characters with a size of 18pt or more and for a period of 56ms or more in one gazing point, reading can be performed in the same manner as without a window.
In this study, the result for seven adult male subjects are reported. More participants actually volunteered for the experiment, but the number of subjects for which eye movements could be accurately detected on a character-by-character basis was limited to seven. To increase the number of subjects, it is necessary to improve the eye movement measuring device so that the eye movement can be acquired more easily and accurately.
Furthermore, research is needed that takes into account not only differences in gender and age, but also differences in reading habits. Results may differ between those who read a lot and those who do not. In addition, reading studies may not be evaluated correctly unless native language researchers conduct studies using native language subjects. Thus, the references are biased by language and it is difficult to compare the results between languages. However, the visual information-processing ability within the gazing point may be common to humans even if the language is different. In the future, we hope that this research will be useful for fostering a new culture related to languages, such as displaying the translation results of translation software that takes into account the readability of each language by making comparisons between various languages.
- G. G. Scott, P. J. O’Donnell, S. C. Sereno, “Emotion words affect eye fixations during reading,” Journal of Experimental Psychology, Learning, Memory, and Cognition, 38(3), 783–792, 2012, doi:10.1037/a0027209.
- L. Steindorf, J. Rummel, “Do your eyes give you away? A validation study of eye-movement measures used as indicators for mindless reading,” Behavior Research Methods, 52, 162–176, 2020, doi:10.3758/s13428-019-01214-4.
- M. Pinto, C. Pouliot, J. A. Cordón-García, “E-book reading among Spanish university students,” The Electronic Library, 32(4), 473–492, 2014, doi:10.1108/EL-05-2012-0048.
- J. Lim, G. E. K. Whitehead, YunDeok Choi, “Interactive e-book reading vs. paper-based reading: Comparing the effects of different mediums on middle school students’ reading comprehension,” System, 97, 102434, 2021, doi:10.1016/j.system.2020.102434.
- N. F. Almunawaroh, “The effectiveness of using an e-book in elt: worldwide cases,” journal of teaching & learning english in multicultural contexts (tlemc), E-ISSN: 2541–6383, 4(2), 2020.
- L. Lecailliez, B. Flanagan, M. A. Chen, H. Ogata, “Smart dictionary for e-book reading analytics,” LAK ’20: Proceedings of the Tenth International Conference on Learning Analytics & Knowledge, 89–93, 2020, doi:10.1145/3375462.3375499.
- H. Takahira, R. Ishikawa, K. Kikuchi, T. Shinkawa, M. Yamada, “Analysis of gaze movement while reading e-books,” IEICE Transactions on Fundamentals of Electronics, Communications and Computer Sciences, E97-A (2), 530–533, 2014, doi:10.1587/transfun.E97.A.530.
- E.B. Huey, “Preliminary experiments in the physiology and psychology of reading,” American Journal of Psychology, 9, 575–586, 1898.
- E.B. Huey, “On the psychology and physiology of reading 1,” American Journal of Psychology,12, 292–312, 1900.
- E.R. Hilgard, Pain as a puzzle for psychology and physiology. American Psychologist, 24(2), 103, 1969.
- E.B. Huey, “The psychology and pedagogy of reading,” Macmillan Company (Currently resold at MIT Press), 1908.
- L.N. Thibos, F.E. Cheney, D.J. Walsh, “Retinal limits to the detection and resolution of gratings,” Journal of the Optical Society of America, 1524–1529, 1987.
- R.J. Jacobs, “Visual resolution and contour interaction in the fovea and periphery,” Vision Research, 19, 1187–1195, 1979.
- F.C. Volkmann, A.M. Shick, L.A. Riggs, “Time course of visual inhibition during voluntary saccades,” Journal of the Optical Society of America, 58, 4, 562–569, 1968.
- T. Kushima, M. Suganuma, S. Mochiduki, M. Yamada, “Development of a novel accurate analysis system regarding information processing within the gazing point,” IEICE Transactions on Fundamentals of Electronics, Communications and Computer Sciences, E102-A (9), 1205–1216, 2019, doi:10.1587/transfun.E102.A.1205.
- K. Nomura, Y Furumi, T. Kushima, H. Otomo, S. Mochiduki, M. Yamada, “Analysis of gaze time required for reading,” The Institute of Image Information and Television Engineers (ITE) Annual Convention, 13E-2, 2019.
- T. Hatada, H. Sakata, H. Kusaka, “Psychophysical analysis of the “Sensation of Reality” induced by a visual wide-field display,” SMPTE Journal, 89(8), 560 – 569, 1980, doi:10.5594/J01582.
- M. Saida, “Reading and eye movement,” in Experimental Psychology of Eye Movement, R. Imosaka, Y. Nakamizo, K. Koga eds., 167-197, The University of Nagoya Press, 1993.
- M. Saida, M. Ikeda, “Sentence interpretation with limited field of view,” Clinical Ophthalmology, 29(8), 923–925, 1975.
- G.W. McConkie,K. Rayner, “The span of the effective stimulus during a fixation in reading,” Perception and Psychophysics, 17(6), 578–586, 1975, doi:10.3758/BF03203972.
- K. Rayner, “The perceptual span and peripheral cues in reading,” Cognitive Psychology, 7(1), 65–81, 1975, doi:10.1016/0010-0285(75)90005-5.
- K. Rayner, “Parafoveal identification during a fixation in reading,” Acta Psychologica,39(4), 271–282, 1975, doi:10.1016/0001-6918(75)90011-6.
- C.Y. Leung, M. Sugiura, D. Abe, L. Yoshikawa, “The perceptual span in second language reading: An eye-tracking study using a gaze-contingent moving window paradigm,” Open Journal of Modern Linguistics, 4(5), 585– 594, 2014, doi:10.4236/ojml.2014.45051.
- L.C. Loschky, G.A. McConkie, “User performance with gaze contingent multiresolutional displays,” in Proceeding of the 2000 Symposium on Eye Tracking Research & Applications (ETRA), 97–103, 2000, doi:10.1145/355017.355032.
- M. Yamada, T. Fukuda, “Definition of gazing point for picture analysis and its applications,” IEICE Transactions, J69-D (9), 1335–1342, 1986.
- R. Fukuda, M. Sakuma, E. Nakamura, T. Fukuda, “An experimental consideration on the definition of a fixation point,” The Japanese Journal of Ergonomics, 32(4), 197–204, 1996, doi:10.5100/jje.32.197.
- N. Osaka, “Effect of peripheral visual field size upon eye movements during Japanese text processing,” J. K. O’Regan, A. Levy-Schoen, eds., North-Holland, 1987, doi:10.1016/B978-0-444-70113-8.50063-1.
Citations by Dimensions
Citations by PlumX
Google Scholar
Crossref Citations
No. of Downloads Per Month
No. of Downloads Per Country
