Analysis of Grid Events Influenced by Different Levels of Renewable Integration on Extra-large Power Systems

Adv. Sci. Technol. Eng. Syst. J. 6(5), 43–52 (2021);
 DOI: 10.25046/aj060506
In this work, the impact of implementing a large amount of decentralized renewable energy sources (RES) of different scales on an extra-large power grid is investigated. Three scenarios are created, substituting 10%, 20%, and 30% of the conventional energy production by RES. For this purpose, the initial dynamic model of Continental Europe in combination with the industrial power system application DIgSILENT PowerFactory was used. In order to compare the behavior of different applied scenarios, a performance index was developed to evaluate and rank the effects of network disturbances by means of time-domain simulations. The performance index was designed based on three different criteria that analyze the oscillatory content and thus, the severity of a given event. The initial power flow of the dynamic model was identified as a limiting factor for the integration of RES, therefore two additional power flows were developed following an innovative procedure. Through the methodologies mentioned above, it was found that Turkey is the most sensitive to such changes, which are amplified by increasing implementation of RES and often lead to inter-area oscillation.
1. Introduction
The release of Al Gore’s film “An Inconvenient Truth” in 2006 as a campaign to educate people about environmental awareness in the USA or the protest and notable criticism of the Swedish environmental activist Greta Thunberg to world leaders, that started in 2015, are good examples of events that have helped to draw people’s attention on global warming problems, in particular among the young population. Pollution, climate change, and damage to the earth’s ozone layer are some of the issues on the public agenda of governments around the world. Confinement, the considerable decrease in land and air mobility forced by the ongoing pandemic caused by the COVID-19 virus [1] has demonstrated how a sudden change in human behavior can have a positive impact on our environment. With lock-downs all over the world, major industrial processes at a standstill, lack of massive events, and a home-office policy, the daily routine of millions of people have been affected and might never be the same again. In world capitals such as New York, the measured carbon emissions dropped up to 50%, and satellite images have also shown a decrease in NO2 (nitrogen dioxide) all over Europe, particularly in northern Italy, Spain, and England [2]. Even if it could be proved that the current pandemic situation was a short-term phenomenon, environmental effects have shown that extreme measures provide positive results to reverse global warming. Moreover, it has been also shown that these extreme measures have a direct impact on the way of generating electricity in the upcoming years. In Switzerland, for instance, after a parliament vote and approval of a new referendum, a revision in the legislation entered into force in 2018 in the form of an amendment to the current Energy Strategy 2050, which is a document known as the New Energy Act [3]. The new reform considers measures to increase energy efficiency, measures to increase the use of renewable energy sources (RES) and withdrawal from nuclear energy. Furthermore, the implementation of further and more ambitious measures to the energy sector have not been limited only within the Swiss borders and similar measures have been implemented in parallel throughout the European Union. In December 2019, the European Green Deal [4] was released, containing 50 measures that, similar to those in Switzerland, intent to push the integration of RES in the electrical system and to promote an emissions trading system. An important point to highlight from this document, is the definition of nuclear power plants as an unsustainable source of energy, leading to nuclear phase-out across Europe in the future. As a result of the aforementioned measures, two main challenges for Transmission System Operators (TSOs) in Europe have envisaged namely 1) the decentralization of RES and 2) the exclusion of large rotating masses from the system, presenting a loss of inertia into the system. Regarding the first challenge, a widespread decentralization represents a reshuffle of the energy flow in the transmission system as a result of the installation of RES in remote locations with weak interconnections. With respect to the second problem, existing rotating masses play an important role in the stability of the system as a source of inertia. Switzerland has been privileged with its geography, allowing it to produce more than half of his annual consumption from alpine hydro-power, which also contribute with a non-trivial amount of inertia [5]. However, not every country can benefit from this particular type of energy generation. Nevertheless, it is a fact that load and demand profiles on power systems are changing and thus, its impact must be assessed in order to manage the security of the supply [6, 7]. Contrarily, blackouts like in 2003 in Italy will happen more often [8]. Motivated by these questions, the current conditions of the European transmission power grid and the expected effects on the system as a result of the integration of the aforementioned measures are analyzed in this paper.
Table 1: Number of elements in the dynamic model
| Code | Lines | Buses | Loads | Generators |
| Albania (AL) | 193 | 339 | 110 | 77 |
| Austria (AT) | 123 | 104 | 40 | 31 |
| Bosnia & Herz.(BA) | 312 | 294 | 164 | 37 |
| Belgium (BE) | 178 | 140 | 36 | 52 |
| Bulgaria (BG) | 787 | 798 | 419 | 77 |
| Switz. (CH) | 244 | 193 | 82 | 88 |
| C. Rep. (CZ) | 106 | 288 | 76 | 113 |
| Germany (DE) | 3378 | 3939 | 859 | 898 |
| Denmark (DK) | 250 | 397 | 66 | 71 |
| Spain (ES) | 1338 | 1385 | 646 | 496 |
| France (FR) | 2599 | 2665 | 991 | 1564 |
| Greece (GR) | 1133 | 1312 | 367 | 128 |
| Croatia (HR) | 334 | 329 | 171 | 73 |
| Hungary (HU) | 94 | 120 | 37 | 28 |
| Italy (IT) | 817 | 1264 | 341 | 458 |
| Luxembourg (LU) | 41 | 38 | 11 | 12 |
| Montenegro (ME) | 80 | 94 | 35 | 18 |
| Macedonia (MK) | 146 | 163 | 85 | 25 |
| Nether. (NL) | 905 | 1031 | 244 | 178 |
| Poland (PL) | 988 | 648 | 199 | 140 |
| Portugal (PT) | 365 | 506 | 87 | 158 |
| Romania (RO) | 1194 | 1171 | 654 | 185 |
| Serbia (RS) | 619 | 553 | 303 | 62 |
| Slovenia (SI) | 111 | 230 | 65 | 73 |
| SK Slovakia (SK) | 52 | 48 | 18 | 82 |
| Turkey (TR) | 1943 | 4888 | 1245 | 1022 |
| Europe (EU)* | 9 | 316 | 26 | 1 |
| Total | 18339 | 23253 | 7377 | 6147 |
Ni = Elements not labeled for a specific country.i
The presented studies are based on the initial dynamic model of Continental Europe [9] developed by the European Network of Transmission System Operators (ENTSO-E), which is the more comprehensive representation of the European transmission power grid available today and that has been extensively studied in previous projects [10].
This paper is organized as follows, as background, it is worth mentioning that this document describes an extension of [11], which is based on two additional results in order to give more insight to the main work. In the first section, the Lyapunov exponent is presented [12] and is used as preliminary stability evaluation of the most severe grid events already reported in [13]. Additionally, the characteristics of the dynamic model are provided in detail, as well as a ranking of events in terms of severity. In the subsequent section, three variations of the power system model are fully described. Considering different future scenarios, different levels of RES integration were evaluated [14]. Subsequently, the effects of faults (introduced on Section 2) for each model variation are investigated. Then, the results are analyzed for all simulated scenarios and ranked using the algorithm based on the Lyapunov exponent. From the time series resulting from Root Mean Square (RMS) simulations, special attention is paid to low-frequency fluctuations (in the range of 0.1-1Hz) also known as inter-area oscillations, which are the main problem to solve in extra-large power grids [15, 16]. One disadvantage of the dynamic model used for the analysis in this document is the fact that there is only a single initial power flow available. This constraint plays an important role in the investigation of the stability of the system. To overcome this limitation, new power flow scenarios were developed using an algorithm reported in Section 3.3. Finally, a possible solution will be discussed. The progressive replacement of the rotating masses and the consequent decrease of the grid inertia[17] makes the power grid more vulnerable to faults especially in the eastern part of the grid. Thus, three different approaches are presented using wide-area monitoring to control the inter-area oscillations. New in these methods is the architectural design of the controllers.
2. Background
2.1 The Dynamic Model of Continental Europe
The dimensions of the model, with more than 55,000 interconnected elements distributed over 27 grids (see table 1), is one of the main characteristics and made the selected system very challenging to work with. It is the most comprehensive representation of the continental European power grid, which was developed by ENTSO-E and that we have used to demonstrate the effectiveness of the proposed algorithms. In the following section, multiple variations of the topology of the system will be introduced but first, the base case is presented so it later can be used as reference for the comparison. To do so, different types of contingencies or faults were simulated and the response of the system was analyzed by means of frequency measurements on randomly selected buses at the high voltage level in all countries [9]. Given the size of the model, the number of contingencies to be investigated and thus the number of simulations to be performed, was narrowed down to 184 based on the seven criteria displayed in figure 1.
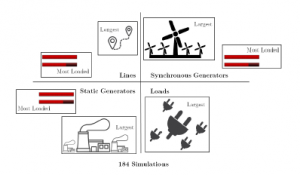
Figure 1: Event selection based on the seven criteria.
2.2 Severity evaluation and ranking of most dangerous events
For the base case, 184 simulations were performed representing one fault of an asset at the time, e.g. 3-phase short circuit on a line or the sudden disconnection of a generator or load. Following the event, the frequency was measured for a period of 20 seconds at 27 busbars randomly selected (one bus of each country). In order to evaluate the impact on the network and to rank the severity, the measurement results of each simulation were compared. To do this, a performance index that analyzed three aspects of the time series was first developed as follows:
- Measuring the damping of the oscillations based on the Lyapunov Exponent [18] with fji as the frequency in the country i at the time j (1),
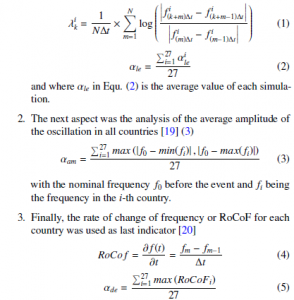
In order to avoid that an individual criteria had more impact on the final index value than others, the individual indicators (αle), (αam) and (αde) were multiplied by a weighting coefficient as shown in Equ. (6).
![]()
The final outcome, resulting from equ. (6) is a scalar that can be used to evaluate the severity of a given contingency.
A partial result is depicted in Figure 3, which displays the severity index for the base case, where the normalized contribution of the criterions defined on Eq. (1-3) to the final index are depicted in blue, red, and green, respectively. The worst event has a magnitude of +1 and as the magnitude decreases its value, the lower the relevance of the subsequent event. Fig. 3 displays the worst events (ranked
175 – 184) and their geographical location is depicted on Figure 2. The inter-area oscillations caused by the sudden disconnection of a large synchronous machine in Turkey, are displayed in Figure 4 for a selected number of countries across Europe, where the severe effects of this fault can be clearly observed. Table 2 summarized the events displayed in Fig. 2 and it can be observed that 9 out of 10 of the most critical faults are related to the sudden loss of a large synchronous generation, in contrast to only one event that was caused by the trip of an important transmission line. It is worth noticing that all machines listed in Table 2 are located in Eastern Europe.
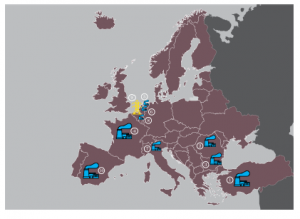
Figure 2: Location of the 10 worst events according to performance value.
Table 2: Performance Value of the ten worst events
| Ranking | Country | Type | Perfomrance Value |
| 184 | TR | Sync. Machine | 1 |
| 183 | RO | Sync. Machine | 0.903 |
| 182 | BG | Sync. Machine | 0.886 |
| 181 | FR | Sync. Machine | 0.699 |
| 180 | NL | Sync. Machine | 0.571 |
| 179 | NL | Sync. Machine | 0.569 |
| 178 | IT | Sync. Machine | 0.559 |
| 177 | BE | Sync. Machine | 0.518 |
| 176 | BE | Line | 0.517 |
| 175 | ES | Sync. Machine | 0.512 |
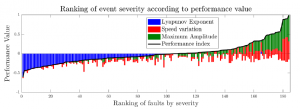
Figure 3: Ranking of events by severity.
3. Stability effects of RES integration
An insight of the results, obtained after the analysis of the base case, confirms the accuracy of the model in comparison with the real system. In this case, the base case corresponds to the conditions of the European power grid in 2016, approximately. In the next step, a modified grid is investigated, where conventional synchronous machines were replaced by decentralized renewable energy sources. In this form, the original dynamic model was topologically changed three times in order to represent different future scenarios.
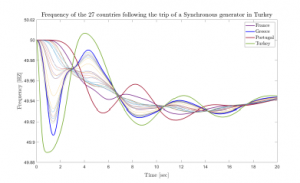
Figure 4: Inter-Area oscillations (0.125Hz) affirmed by the results of a tripped synchronous generator in Turkey.
3.1 Implementation of different levels of RES
Three future scenarios were developed with a systematic increase of RES. First, 10% of the country’s conventional energy production was replaced with RES, this scenario is referred to as S1 in the subsequent sections. Then, a 20% RES penetration was developed and labelled as scenario 2 or S2 and finally a third scenario S3, with 30% of RES integration. It is important to underline that the procedure to achieve an increase in the different levels of RES is not trivial nor simple. In DIgSILENT PowerFactory, the power system software application in which the model was built, is possible to combine renewable energy with existing models in different ways. However, since the focus of this work was to analyze stability phenomena, an accurate representation of renewable devices, namely one to one component representation, was omitted. In other words, there is no distinction between the replacement of conventional generation between Wind, PV or any other technology. The key idea was to substitute rotating masses with static elements and thus, indirectly affect the inertia of the system. Therefore, renewable assets were modelled as static generators connected via static converters [21].
Furthermore, a decentralized renewable generation is assumed [14], which has a direct influence on the topology of the different variants. In this form, synchronous generators representing nuclear power plants, coal-fired power plants and other conventional production, were replaced by several smaller static generators located on multiple locations. The voltage level at which these large quantities of RES were connected played also an important role. In [22] it is recommended to connect new elements at busbars where a load is also attached. In our case, the model has more than 23’000 buses with more than 7’000 loads. The new static generators integrated into the system were selected to operate in the 15kV voltage level.
From the countries considered in the model, not all of them are represented with the same level of detail or do not have a pronounced infrastructure as in Switzerland, Germany or Turkey. As a result, some countries were modelled with fewer amount of synchronous machines. This fact was taken into consideration in the development of scenarios 1, 2 and 3, respectively. Only countries modelled with less than 20 synchronous machines were excluded from the modification. Consequently, only 13 countries were modified and their names are listed in Table 3. The topology of these countries was changed individually to create the new system variations, leading to 39 model variations (13 countries times 3 different variations). In addition, Table 3 displays the amount of sync. machines (Nk) existing in each country and the total amount of active power in MW that these machines contribute. Similarly, this table indicates the static generators (Ni) required in order to replace the energy produced by the conventional machines Nk.
Technically, the 39 variants mentioned above were created and the share of active power to be replaced was calculated for the respective country using an optimization procedure. Next, all synchronous machines available in a given country were analyzed in order to find the fewer amount of synchronous generators to be substituted by RES. Then, the selected machines were replaced by randomly distributed static generators to compensate the same amount of active power. Given that this task involved the modification of hundreds of elements, the procedure was automatized using python. In the same way, all simulations performed (7’000 resulting from analyzing 184 events at the time for 39 variations), were analyzed and compared, using the python interface of DIgSILENT PowerFactory and the results are presented in the following subsection.
Table 3: Transmutations in the selected countries
| Country | RES | Scenario 1
10% |
Scenario 2
20% |
Scenario 3
30% |
|||
| Ni | Nk | MW | Nk | MW | Nk | MW | |
| Austria (AT) | 40 | 4 | 409 | 4 | 1092 | 4 | 1640 |
| Switz. (CH) | 80 | 4 | 712 | 4 | 1458 | 4 | 2186 |
| C. Rep. (CZ) | 76 | 4 | 653 | 4 | 1304 | 4 | 1955 |
| Germany (DE) | 111 | 6 | 5301 | 13 | 8012 | 21 | 14046 |
| Spain (ES) | 646 | 4 | 2620 | 6 | 5241 | 9 | 7861 |
| France (FR) | 956 | 4 | 6600 | 11 | 13185 | 16 | 19784 |
| Greece (GR) | 363 | 4 | 726 | 4 | 1069 | 6 | 1604 |
| Italy (IT) | 319 | 4 | 2025 | 9 | 3211 | 16 | 4030 |
| Nether. (NL) | 166 | 4 | 1538 | 4 | 3076 | 5 | 4630 |
| Poland (PL) | 185 | 4 | 1125 | 4 | 2252 | 5 | 3376 |
| Belgium (BE) | 36 | 4 | 981 | 4 | 1959 | 4 | 2940 |
| Slovenia (SI) | 59 | 4 | 155 | 4 | 517 | 4 | 613 |
| Turkey (TR) | 316 | 5 | 3641 | 14 | 7278 | 23 | 10918 |
Ni = number of static generators, Nk = number of synchronous generators.
3.2 Simulation results using the initial Power Flow
In this section, the 7’000 simulations resulting from the 184 events on the different levels of RES integration are compared against the results of the 184 events on the original model [13] and presented in three parts as follow:
- Scenario 1 (S1) vs. Base case (B). The 13 variations imple-
menting 10% of RES in different countries are compared against the original model.
- Scenario 2 (S2) vs. Base case (B). The 13 variations imple-
menting 20% of RES in different countries are compared against the original model.
- Scenario 3 (S3) vs. Base case (B). The 13 variations imple-
menting 30% of RES in different countries are compared against the original model.
The comparison was performed as follows:
- The measure used to compare scenarios is the absolute value of the difference between the frequencies of each variation and the frequencies of the original model, more details are provided next.
- The main results are presented in the form of 3D-plots where:
- The x− axis depicts the country where the RES were deployed. For simplicity, only the country codes are presented and the country names are listed in Table 3.
- The y− axis provides the simulation number from 1 to 184, which is refers to different types of events (discussed in Section 2) and is summarized below:
- 1-27 severe synchronous machine events
- 28-57 most loaded synchronous generators
- 58-84 most loaded lines
- 85-111 events related to loads
- 112-138 longest lines
- 139-161 largest static generators
- 162-184 most loaded static generators events
- the z− axis corresponds to the sum of the frequency differences, which are given by:
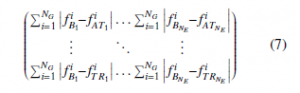
where NG is the number of measurements per simulation (27), NE is the number of events (184), fBi j represents the frequency measured in the i-th country after the jth event for the base case model [13] and fATi j is the frequency measured in the i-th country (Austria in this case) after the j-th event for the n-th scenario (S n) of renewable penetration.
- c) After the frequency differences have been estimated, the stability indexes introduced on equation (6) are calculated for every model variation and then compared against the base case [13] using a heat map. In these graphical representation, the y− axis represents the country where the RES were implemented and the x− axis provides the simulation number related to the type of event as in the 3D plot. The colors of the heat map represent the relation among stability indexes, which are given as:
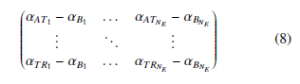
where αBi is the stability index of the base case for the i-th event and αATi is the stability index in the j-th country (Austria in this case) after the i-th event for the n-th scenario (S n) of renewable penetration. It is important to note that:
- An increase in stability is represented by negative values in matrix (8) as a consequence of RES penetration.
- Positive values imply a larger deviation from the base case, leading to a negative impact in terms of stability as a result of the RES implementation.
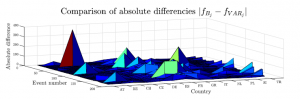
Figure 5: Comparison between scenario 1 (implementation of 10% RES) and the original model by the absolute difference of the frequency.
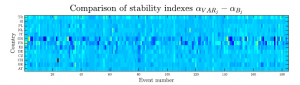
Figure 6: Heatmap visualizing the change in the stability index between scenario 1 (implementation of 10% RES) and the original model.
3.2.1 Scenario 1 (10%) vs. Base Case
Figure 5 shows how the compensation of 4-6 synchronous generators by RES affects the frequency. For this purpose, the results from the base case are compared with those from scenario 1. This corresponds to a 10% increase in energy generated by renewables, which means up to 163 Mvar of reactive power and up to 6.6 GW of active power, depending on the model variation. As mentioned in equation (7), the absolute difference of the frequencies serves as a metric for the comparison. By spanning a surface and plotting the frequency on the z-axis in Figure 5, unevenness indicates deviations from the base case. Apart from a few outliers and small peaks, no major differences can be detected. This observation is backed up by the heat map in Figure 6. Here, changes in the stability index are shown in color. Coloring in the dark blue area represents a negative value and thus indicates a more stable grid. The positive effect of an increment of 10% of RES in some countries, particularly in Greece (GR), is explained by the stability index on equation (6). As predicted on [15], reducing inertia produces an improvement of the rate of change of frequency (RoCoF) and at the same time produces an increase of the damping and the natural frequency. For most of the studied events in Greece, the increase in the RoCoF is lower than the increase on the damping, leading to a smaller value of α.
At this point, an event in the model variation Switzerland shall be briefly discussed. This event can be seen in Figures 5 triggering the largest outlier, as well as in Figure 6 as a dark red colouration. This is not a fault, but a disconnection of a synchronous generator, which is directly connected to the interconnection between Switzerland and Italy. In the ENTSO-E model, this element is subject to market restrictions, so the active power flowing through this line must remain constant. Additionally, one synchronous generator decommissioned in Switzerland was geographically close to this line. As result, the reallocation of the power was changed causing a large variation in the frequency.
3.2.2 Scenario 2 (20%) vs. Base Case
In this comparison, the same pattern is found in relation to the previous case. However, Figure 7 displays more frequency variations, particularly in Germany, Spain, France and Turkey. In the corresponding heat map depicted in Figure 8, it can be observed that Turkey happens to be the most sensible country to the RES variation and this is reflected by the number of times where the magnitude α exceed the value of 5, which is denoted with a turquoise/green color on the heat map. Similarly, it can be seen that 20% of renewable penetration has a positive impact in some events, especially in Greece and Italy because also, in this case, reducing the inertia has a lower negative influence on the RoCoF, than a positive one on the damping and the natural frequency in the system. Finally, it is important to note that similarly as in the previous case, some random negative events in Greece and Italy occur as a result of reallocation of the power after an event with respect to a trip of a static generator and a highly loaded line.
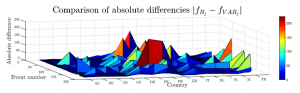
Figure 7: Comparison between scenario 2 (implementation of 20% RES) and the original model by the absolute difference of the frequency.
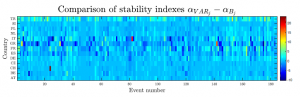
Figure 8: Heat map visualizing the change in the stability index between scenario 2 (implementation of 20% RES) and the original model.
3.2.3 Scenario 3 (30%) vs. Base Case
The largest topological changes were made in the last scenario and the effects on the models can be seen very well in Figure 9 and 10. When looking at the absolute frequency difference in Figure 9, there are clearly more irregularities than in subsection 3.2.1 and 3.2.2. What was only slightly apparent in scenario 2 can now be confirmed in this comparison. Events in countries resembling Germany, France, Spain, Italy and Turkey are most affected by the aggressive implementation of RES and show clear differences to the base case. It is noticeable that in all cases Turkey reacts most sensitively to the network changes. However, it is a fact that Turkey is the country with the highest change in share of renewable energy. The problems in Turkey can be explained by the results shown in Figure 12, where 27 measurements resulting after a severe event in one of the most loaded static generators in Turkey, are displayed (in blue) and the results are compared against the base case (in red). Through these results, it is evident that although the damping of the oscillations is improved for the 30% RES implementation (lines in red), there is a significant degradation of the amplitude and RoCoF compared to the base case (lines in blue). This results in electromechanical oscillations caused by groups of generators oscillating against each other (west versus east), which were already identified using the stability index developed in (6).
3.3 Development of additional power flows
It can be concluded from the results in the previous subsection that massive integration of RES can change the stability of the European power grid. In particular, Turkey is more prone to present stability constraints following RES integration and after analyzing the initial power flow, it can be seen that around 13% of the production in Central Europe comes from Turkey and that 70% of the global production is produced in the western part of Europe namely in France, Germany, Spain, Italy, and the Netherlands. The current generation distribution in the system anticipates the results obtained and opens the following question: does the redistribution of the current ratio play an important role in the stability of the system? The answer is not trivial and one potential solution is to redistribute the current generation and repeat a similar procedure presented in Section 3.2. This solution represented to create new power flow scenarios and to do so, an iterative algorithm to automatically randomly calculate a new set of initial conditions was developed and is explained in the next steps:
- Calculation of the total active power in the model contributed from all participating countries. It is worth mentioning that in this initial approach the reactive power was not change.
- Random reallocation of the active power among the countries of the model, respecting the maximum active power provide from each country.
- Perform a load flow calculation in PowerFactory with the new conditions
- Check if power flow converge (a solution to the new operating conditions exist). If solution exist: algorithm is finish, otherwise return to step 2.
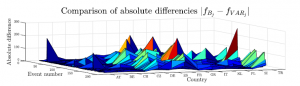
Figure 9: Comparison between scenario 3 (implementation of 30% RES) and the original model by the absolute difference of the frequency.
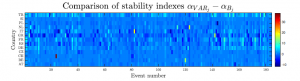
Figure 10: Heatmap visualizing the change in the stability index between scenario 3 (implementation of 30% RES) and the original model.
Given the complexity of the model, more than 500 iterations were required in order to obtain a new power flow. In this document, we present two additional initial power flows and the difference between the base case and the new operating points are depicted in Figure 11. In the first developed power flow (represented in orange bars), the shares of Turkey have been significantly reduced almost by half and the shares of Italy and Spain (Western-Europe) have been increased. In contrast, in the second developed power flow (green bars) the shares of Turkey have significantly increased and the share of Western-Europe has been reduced. After the two power flows were defined, the 184 simulations were performed again. The simulation results have been compared against the simulations performed using the original power flow and the results are summarized in Figure 13. In this figure, the evolution of the stability index (α) between the base case (presented in Section 2), and the RES integration for the new power flows is presented. For each simulation j, the performance index of the base case (αBj ) and of the variation (αVARj ) are calculated and the results are compared in Figure 13, with the x-axis representing P(αVARj − αBj ). To get a better idea of these results, we can refer to Figure 3. In the same way, this ranking is created for each power flow and the performance value is added up.
The results displayed in Figure 13 show that the power flow plays an important role in the stability of the system and that incrementing the balance difference between the western and the eastern part of Europe is not realistic from a stability point of view. Particularly, it was noticed that the most critical event identified in Section 3 (a trip of a synchronous generator in Turkey) is even worst in the new power flow. On the contrary, the second power flow shows that the system becomes more robust or in other words, produces a positive impact on the stability of the system. From the simulations results, it can be concluded that reducing the gap between the East and West seems to be a reasonable solution to improve the stability of the system.
4. Discussion & Future Work
The methodologies and results presented in this document represent a substantial extension to the works presented before [11]. The main objective was to investigate the dynamic behavior of the European power grid before and after the implementation of decentralized renewable energy sources. Thus, in a first part, a performance index was developed with which the measurement results from the numerous simulations could be compared. The final results are covered in the second part of this work. Three phases of RES penetration were investigated; 10%, 20%, and 30% increase respectively, resulting in 39 variations of the initial dynamic model. The 30% variation case caused the greatest amount of stability issues in the system in comparison with the 10% and 20% variation case. In general, the results of 10% and 20% more RES differ very marginally. However, what was already identified as a potential problem in the original model has been confirmed by the three tested and analyzed scenarios; Turkey is one of the most sensitive countries. As the percentage of implemented RES increases, the effects of the outage of a certain sync. machine (see Table 2) are getting worse. These negative effects are namely inter-area oscillations and are not rare, yet to be avoided in such super grids. With the increase of interconnections over longer distances, the risk of groups of generators in different geographical locations starting to oscillate against each other is
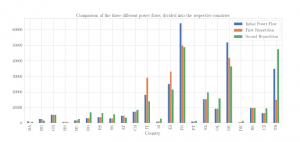
Figure 11: Representation of the three working power flows, divided into the different countries.
increasing respectively, creating electromechanical oscillations over the entire grid (in our case west to east). These events can limit the power transfer capacity and can even lead to a system collapse and blackouts if left undamped [23, 24].
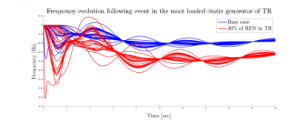
Figure 12: Frequency comparison of grid response to the trip of the most loaded static generator located in Turkey.
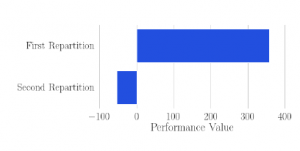
Figure 13: Stability index evolution depending on the initial power flows.
Power system stability problems are a topic that has been discussed for many years. Most approaches refer to the adjustment of Power System Stabilizers (PSS). However, considering the size of the European grid, dynamically adjusting all necessary PSS seems rather unrealistic. With the help of Wide Area Monitoring (WAM) and Wide Area Control (WAC), a different approach could be taken. By synchronously measuring the phase angle of the node voltages and currents via satellite-based Phasor Measurement Units (PMUs) distributed over a large area, a large system can be easily monitored and inter-area oscillations can be quickly detected. Wide Area Daming Controllers (WADC) play a key role in WAMs and help to damp such oscillations faster. The design of the controller is crucial to how efficiently such a WADC works.
In a next step, different methodologies for the design of such WADCs will be investigated and tested based on benchmark models. In a future step, these controllers will be implemented and tested in a real laboratory experiment. An adapted variant of Kundur’s two area system has already been successfully developed in the smart grid laboratory in Winterthur, Switzerland [25]. Furthermore, electromechanical oscillations have been reproduced as well. This laboratory test will then be extended accordingly to enable the use of WACD. But even a test laboratory will eventually reach its limits in terms of size and complexity of a power & transmission grid. Therefore, these test trials are to be complemented by implementing the initial European model into Opal-RTs real-time simulator, coupled with control-in-the-loop to validate the effectiveness of a WADC and address main challenges like measurement noise & errors and control noise during the communication.
Conflict of Interest
The authors declare no conflict of interest.
Acknowledgment
The authors acknowledge the Swiss National Science Foundation (SNSF) under the project number PZENP2 173628 of the program Ambizione Energy Grant (AEG). This research is also part of the activities of SCCER FURIES, which is financially supported by the Swiss Innovation Agency (InnosuisseSCCER program).
- M. E. E. Zowalaty, S. G. Young, J. D. Ja¨rhult, “Environmental impact of the COVID-19 pandemic – a lesson for the future,” Infection Ecology & Epidemiology, 10(1), 1768023, 2020, doi:10.1080/20008686.2020.1768023.
- S. Saadat, D. Rawtani, C. M. Hussain, “Environmental perspective of COVID-19,” Science of The Total Environment, 728, 138870, 2020, doi: https://doi.org/10.1016/j.scitotenv.2020.138870.
- Swiss Federal Office of Energy SFOE, “Energy Strategy 2050 once the new Energy Act is in Force,” PowerPoint Presentation, 2011. [Online].
- European Commission, “The European Green Deal,” PDF Document, 2019. [Online].
- B. Schaefli, P. Manso, M. Fischer, M. Huss, D. Farinotti, “The role of glacier retreat for Swiss hydropower production,” Renewable Energy, 132, 615–627, 2019, doi:https://doi.org/10.1016/j.renene.2018.07.104.
- European Network of Transmission System Operator for Electricity (ENTSO- E), “EC Green paper: A 2030 Framework for climate and energy policies, an ENTSO-E consultation response,” PDF Document, 2014. [Online].
- Swissgrid, “Overview of Ancillary Services,” PDF Document, 2019. [Online].
- A. Berizzi, “The Italian 2003 blackout,” in IEEE Power Engineering Society General Meeting, 2004., 1673–1679 Vol.2, 2004, doi:10.1109/PES.2004. 1373159.
- European Network of Transmission System Operator for Electricity (ENTSO- E), “ENTSO-E Dynamic Model of Continental Europe,” Operation Report, 2019. [Online].
- F. R. Segundo Sevilla, P. Korba, K. Uhlen, E. Hillberg, G. Lindahl, W. Sat- tinger, “Evaluation of the ENTSO-E initial dynamic model of continental Europe subject to parameter variations,” in 2017 IEEE Power Energy Society Innovative Smart Grid Technologies Conference (ISGT), 1–2, 2017, doi:10.1109/ISGT.2017.8085986.
- C. Ru¨eger, J. Dobrowolski, P. Korba, F. R. Segundo Sevilla, “Stability Effects After Massive Integration of Renewable Energy Sources on Extra-Large Power Systems,” in 2020 IEEE PES Transmission Distribution Conference and Exhibition – Latin America (T D LA), 1–6, 2020, doi:10.1109/TDLA47668.2020. 9326181.
- S. Dasgupta, M. Paramasivam, U. Vaidya, V. Ajjarapu, “Real-time monitoring of short-term voltage stability using PMU data,” in 2014 IEEE PES General Meeting — Conference Exposition, 1–1, 2014, doi:10.1109/PESGM.2014.
9198. - C. Ru¨eger, J. Dobrowolski, P. Korba, F. R. Segundo Sevilla, “Lyapunov Expo- nent for Evaluation and Ranking of the Severity of Grid Events on Extra-Large Power Systems,” in 2019 IEEE PES Innovative Smart Grid Technologies Eu- rope (ISGT-Europe), 1–5, 2019, doi:10.1109/ISGTEurope.2019.8905564.
- European Network of Transmission System Operator for Electricity (ENTSO- E), “TYNDP 2016 Scenario Development Report,” PDF Document, 2015. [Online].
- P. Kundur, Investigation of low frequency inter-area oscillation problems in large interconnected power systems, Canadian Electrical Association, Montreal, Canada, 1993.
- V. Vittal, N. Bhatia, A. Fouad, “Analysis of the inter-area mode phenomenon in power systems following large disturbances,” in 1991., IEEE Interna- tional Sympoisum on Circuits and Systems, 982–985 vol.2, 1991, doi: 10.1109/ISCAS.1991.176528.
- P. H. J. Nardelli, M. S. Baptista, C. A. Pomalaza-Raez, P. Cardieri, M. Latva- aho, “Network models for the structures of modern electric power grids,” CoRR, abs/1401.0260, 2014.
- S. Dasgupta, M. Paramasivam, U. Vaidya, V. Ajjarapu, “Real-time monitoring of short-term voltage stability using PMU data,” in 2014 IEEE PES General Meeting — Conference Exposition, 1–1, 2014, doi:10.1109/PESGM.2014. 6939198.
- C. Sourkounis, P. Tourou, “Grid Code Requirements for Wind Power In- tegration in Europe,” Conference Papers in Science, 1, 9, 2013, doi:https:
//doi.org/10.1155/2013/437674. - M. Bollen, M. Ha¨ger, “Power quality: interactions between distributed energy resources,the grid, and other customers,” Leonardo Energy, 1, 2005.
- DIgSILENT, Gomaringen, Germany, DIgSILENT PowerFactory 2018 User Manual, 2018.
- M. Reza, “Stability analysis of transmission system with high penetration of distributed generation,” 2006.
- A. P. G. A. (APG), “Almost Blackout on January 8, APG Publishes Video- Simulation,” Website, 2021. [Online].
- E. N. of Transmission System Operator for Electricity (ENTSO-E), “Analysis of ce inter-area oscillations of 1st december 2016,” PDF Document, 2017. [Online].
- D. Baltensperger, J. Dobrowolski, A. Obushevs, F. R. Segundo Sevilla, P. Korba, “Scaling Version of Kundur’s Two-Areas System for Electromechanical Oscillations Representation,” in 2020 International Symposium on Power Electronics, Electrical Drives, Automation and Motion (SPEEDAM), 243–249, 2020, doi:10.1109/SPEEDAM48782.2020.9161960.