Identification of Genetic Variants for Prioritized miRNA-targeted Genes Associated with Complex Traits
Volume 6, Issue 3, Page No 418-423, 2021
Author’s Name: Isabella He1, Zhaohui Qin2, Yongsheng Bai3,a)
View Affiliations
1Pittsford Mendon High School, 472 Mendon Road, Pittsford, NY 14534, USA
2Department of Biostatistics and Bioinformatics, Emory University, Atlanta, GA 30322, USA
3Next-Gen Intelligent Science Training, Ann Arbor, MI 48105, USA
a)Author to whom correspondence should be addressed. E-mail: bioinformaticsresearchtomorrow@gmail.com
Adv. Sci. Technol. Eng. Syst. J. 6(3), 418-423 (2021); ![]() DOI: 10.25046/aj060346
DOI: 10.25046/aj060346
Keywords: GWAS, BMI, miRNA, variant, 3’UTR
Export Citations
Genome-wide association studies, or GWAS, have reported associations between SNPs and specific diseases/traits. GWAS results contain variants located in different genomic regions, including variants in the 3’UTR. MicroRNAs, or miRNAs, are small noncoding RNAs that bind to the 3’UTRs of genes to regulate gene expression. However, variant(s) that are located in the 3’UTR could impact miRNA binding, thus affecting expression of its targeted gene(s). To specifically elucidate miRNA targeting pairs and binding site variants associated with a specific trait, well-designed downstream analysis along with careful experimental design are necessary. Currently, there is no available state-of-the-art methodology for identifying miRNA targeting pairs and associated variants that could contribute to phenotypes using GWAS. Moreover, it is unrealistic to conduct experiments for elucidating all possible miRNA targeting pairs and binding site variants across the entire genome. In this project, we developed a bioinformatic pipeline to computationally identify genes and their targeting miRNA pairs that are enriched over the miRNA-gene tissue expression network for the studied genetic traits and examined the binding site variants’ impact on Body Mass Index (BMI).
Received: 30 April 2021, Accepted: 05 June 2021, Published Online: 27 June 2021
1. Introduction
GWAS is a powerful approach to identify common variants associated with common diseases/traits in studied populations [1, 2]. Traits may be activated due to genetics or changes in environment, or both.
MicroRNAs (miRNAs), noncoding RNAs with a length between 17-22 nucleotides, exert their impact on gene regulation through targeting mRNAs. To achieve their function, miRNAs bind to the 3’ untranslated regions (3’UTRs) of target mRNAs which can often result in potential suppression of mRNA translation and/or gene expression.
Single-nucleotide polymorphisms (or SNPs) are the most common mutations found in the human genome [3, 4]. SNPs located in the 3’UTRs can potentially disrupt miRNA regulation [5]. A DNA motif is a conserved DNA sequence segment with biological consequences. The identification of a motif located in the 3’UTR could suggest how miRNAs potentially target genes in that region. Analysis of GWAS data by identifying genes or miRNAs that harbor genetic variants could elucidate trait-associated genetic variants [6].
In our experiment, we analyzed multiple traits compiled from GWAS and found BMI to be the most significant trait in the context of the miRNA-gene tissue expression target network. We further investigated several genes located within the region(s) associated with BMI, FADS1 and FADS2 due to their significant relevance to obesity and related conditions [7]. The overarching goal of this study is to identify how the interaction between genes and their targeting miRNAs change due to genetic variations and reveal any underlying biological mechanisms that contribute to the development of complex traits for humans.
2. Experimental Methods
To perform our experiment, we proposed the following approach:
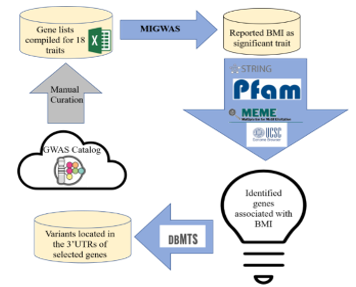 Figure 1: Workflow of variant identification for complex trait BMI
2.1. GWAS Traits Selection
We downloaded the annotation data of GWAS results from 18 traits, all of which had at least 100 associated genes as compiled by PheGenI [6]. All traits were previously described [8]. These traits ranged from autoimmune disorders such as Rheumatoid Arthritis and Asthma to behavior traits such as smoking.
2.2. Trait Relevant miRNA-gene Pairs Identification
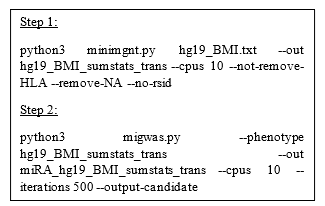 Figure 2: Python code of running MIGWAS
We employed MIGWAS software [9, 10] using default running parameters (2018 Github version: https://github.com/saorisakaue/MIGWAS) to strengthen our analysis regarding all 18 traits and identify significant traits and miRNA-gene pair candidates over the gene tissue expression network. In order to run MIGWAS, we converted the variant genomic coordinate annotations (hg38) provided by PheGenI to the hg19 version. Figure 2 shows the Python pipeline of running MIGWAS.
2.3. Protein-Protein Interaction Examination and Domain Elucidation
We ran STRING database to look for evidence of interaction between the ten candidate genes associated with BMI at the protein level [11]. We also used Pfam to identify if there were any possible domains associated with BMI [12].
2.4. Motif Discovery for miRNA-targeted Genes Relevant to BMI Trait
We applied MEME software (version 5.3) to identify enriched motifs for the 3’UTR sequences retrieved from Ensembl Biomart Database [13, 14]. To run MEME, we stipulated the software parameter for the searched motif width to be between six and twenty base pairs. Also, the number of searched motifs was restricted to report the top six motifs. All other running parameters were kept as default.
2.5. Variant Identification for Selected Genes Associated with BMI
We checked the dbMTS database for reported candidate genes associated with BMI through MIGWAS and pinpointed SNPs located inside each gene’s respective 3’UTRs [5].
3. Results
3.1. Selection of GWAS Results
We acquired the GWAS results of 18 traits with more than 100 associated genes that were reported in our recent study [8]. All selected traits are displayed in Table 1 below.
3.2. MIGWAS Analysis
We identified in particular that one out of the 18 traits, BMI, has a significant association with all tissues (p-value of .0313). There are only three traits which have a p-value reported for trait and tissue association, including BMI, Crohn’s, and Type 1 Diabetes (T1D) (Figure 3).
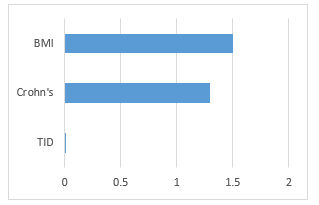 Figure 3: MIGWAS reported p-values (-log base 10 scale) for BMI, Crohn’s disease, and Type 1 Diabetes.
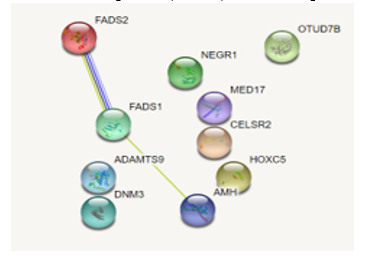 Figure 4: Protein-protein interaction results for all ten genes associated with BMI. Only three genes were found to have interactions with each other (FADS1, FADS2, AMH).
We have identified ten genes that are targeted by five miRNAs as candidate biomarkers in the BMI trait. For Crohn’s, there was only one pair while T1D had two pairs (Table 2).
3.3. String Database Results
Out of the ten genes researched, there are three genes—FADS2, FADS1, and AMH—that interact with each other as reported by the STRING database, as shown in Figure 4. These three genes are also targeted by the same miRNA: hsa-mir-615. The STRING database also reported BMI’s significant associations (FDR < .01) with fatty acid metabolism (hsa01212) and biosynthesis of unsaturated fatty acids (hsa01040) under KEGG pathways. Likewise, the BMI-related GO terms—linoleic acid metabolic process (GO:0043651), alpha-linolenic acid metabolic process (GO:0036109), and unsaturated fatty acid biosynthetic process (GO:0006636)—are also reported by the STRING database.
3.4. Pfam Database Results
The Pfam database reported two domains associated with BMI: Fatty Acid Desaturase (PF00487) and Cytochrome b5-like heme/steroid binding domain (PF00173), as shown in Figure 5.
These results were consistent with the ones reported by the INTERPRO database.
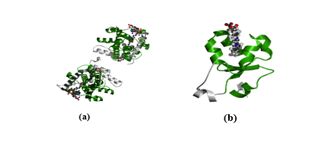 Figure 5: Protein structures of two BMI-associated domains. (a) displays the Fatty Acid Desaturase Domain. (b) displays the Cytochrome b5-like heme/steroid binding domain.
3.5. Motif Identification
Using MEME, we ran all ten of the genes associated with BMI. A motif was discovered containing nine out of these ten genes (ADAMTS9, CELSR2, DNM3, FADS1, FADS2, HOXC5, MED17, NEGR1, OTUD7B), with an e-value of .047 (Figure 6).
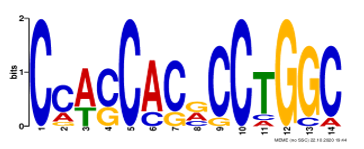 Figure 6: Motif conservation across nine (out of ten) genes associated with BMI
3.6. Variant Identification Results
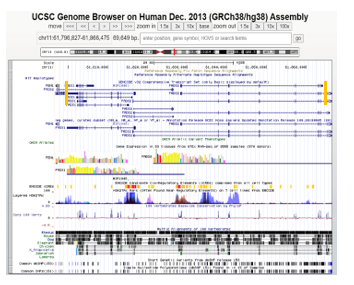 Figure 7: UCSC Genome Browser view for variants located in the genomic regions of FADS1/FADS2. The orange vertical bars placed within the view pinpoint the general motif coordinates defined by MEME. The left bar represents the identified motif region for FADS1 while the right bar represents FADS2’s identified motif region.
To report known common variants contained in miRNA-targeted genes associated with BMI, we checked the UCSC Genome Browser [15]. This region contains multiple known variants (dbSNP 153 Track) that are located inside both FADS1 and FADS2 (see Figure 7 below). Interestingly, FADS1, FADS2, and FEN1 (a neighboring gene) are highly expressed in the adrenal gland. As indicated by GTEx data, CELSR2, FADS1, and FADS2 all are expressed with low amounts in both types of adipose tissue. Since all three genes are targeted by the same miRNA, hsa-miR-615, low expression of these genes in adipose tissues could be due to the repression effect of this miRNA.
3.7. dbMTS Results
To identify miRNA binding-site variants, we checked the dbMTS database [5]. Table 3 shows that multiple variants, which could alter the binding relationship of miRNAs and their targets, are often present in the 3’UTRs of miRNA-targeted genes associated with BMI.
4. Discussion and Interpretation
In this study, we applied cutting-edge bioinformatics tools and databases to select candidate genes/miRNAs associated with complex genetic trait(s), such as BMI.
Using MIGWAS, we analyzed three traits: BMI, Crohn’s, and T1D. While both BMI and Crohn’s had significant p-values in the gene expression network, Crohn’s yielded only one gene/miRNA pair. On the contrary, T1D had a non-significant p-value but yielded 2 gene/miRNA pairs (see Figure 3 and Table 2). We concluded that a significant p-value does not necessarily indicate the existence of more miRNA-gene targeting pairs for specific traits. As a result of this MIGWAS analysis, we focused on investigating BMI as it had many gene/miRNA pairs in comparison to the other two traits mentioned. When performing
this study, we noticed that different tools/databases can analyze data with complementary results from different aspects.
For example, MIGWAS identified CELSR2 containing 3’UTR variants also reported by the PheGenI database. MIGWAS identified two genes (out of nine)—DNM3 and FADS1—that don’t contain 3’UTR variants in the data provided by PheGenI. The other seven genes were not reported by PheGenI [6, 9].
After comparison, dbMTS reported results on nine genes total. Six genes (OTUD7B, DNM3, ADAMTS9, MED17, FADS1, and FADS2) contain 3’UTR variants also reported by MIGWAS. The remaining three genes (CELSR2, HOXC5, and AMH) do not contain 3’UTR variants as dbMTS states.
Using DIANA Tools, we identified two genes (CELSR2 and ADAMTS9) that are targeted by hsa-miR-615 [16]. Although MIGWAS stated that ADAMTS9 was targeted by hsa-miR-330, this is likely due to this gene being targeted by multiple miRNAs. However, wet-lab experiments are needed to validate this conclusion. In addition, the targeting outcome of multiple genes associated with BMI by hsa-miR-615 is significant. Studies show that increased levels of hsa-miR-615 may help inhibit palmitate-induced hepatocyte apoptosis [17]. If saturation levels of palmitate, a type of fatty acid, are increased, this increases the likelihood of developing diseases such as non-alcoholic fatty liver disease, which is correlated with obesity (or a high BMI) [18]. Indeed, CELSR2 was recently discovered to have significant high expression in cancerous tissue than normal tissue. Specifically, hepatocellular carcinoma, a primary liver cancer whose major risk factors include non-alcoholic fatty liver disease [19].
Current literature evidence supports that FADS2 has been discovered to be a drug target gene as well as an miRNA-target gene for rheumatoid arthritis (RA) [10]. However, such evidence reports hsa-miR-4728 as FADS2’s target miRNA instead of hsa-miR-615. This suggests the involvement of both miRNAs in the development of BMI-related illnesses. In addition, multi-omics analysis proves FADS2 is a potential biomarker for BMI. This is consistent with the conclusion that a high BMI leads to increased risk of developing RA, even though the biological mechanism responsible has yet to be identified [20, 21]. In addition, a recent study confirms that the FADS1/2 cluster are significantly associated with fatty acid levels (see Figure 4). This study also reported FADS1 alongside rs174546, matching our corresponding row in Table 3. Unlike our experiment, however, the mentioned study did not employ dbMTS to generate this match [22]. The conservation of both FADS1 and FADS2 in the identified motif (see Figures 6 and 7) further emphasizes the potential importance of these two genes in the association with BMI/development of obesity.
In a recent study, Kuryłowicz and colleagues report that two miRNAs—hsa-miR-615 and hsa-miR-330—and their target genes (of which none are listed in Table 2) are involved in the oncogenesis pathway, otherwise known as the process where healthy cells become cancerous [23]. Shared target miRNAs between a genetic trait (BMI) and cancer suggests that the development of illness as a result of either share similar causal/biological factors. In addition, hsa-miR-615 was found to be highly expressed in the subcutaneous adipose tissue (SAT) of obese patients after surgery-induced weight loss than the SAT of patients with a normal weight, suggesting that there is a difference in molecular pathways/miRNA expression between losing weight and consistently maintaining a healthy weight [23]. This is consistent with the finding that hsa-miR-615 facilitates palmitate production which is correlated with a higher likelihood of developing obesity.
In our previous study, we found a statistically significant association between BMI and the PCDHA10 pathway [8]. PCDHA10 is a gene which codes for different protocadherins (Pcdhs), which play an important role in neural generation [24]. As neuronal development and brain structure have been linked to BMI through existing literature, this could be a reason why the PCDHA10 pathway is associated so strongly with BMI [25]. Although obesity is not identified by MIGWAS as a significant trait in our study, it has been reported to have been strongly associated with BMI and has some significant associations with body temperature [4, 26]. For future research, we would like to examine the popularity of variants located in the binding sites of 3’UTR for the miRNA-gene pairs of additional traits to further investigate the underlying biological mechanisms and causal factors of other genetic diseases, traits, and even cancers.
Conflict of Interest
The authors declare no conflict of interest.
Acknowledgment
We would like to express our deep gratitude to Tianli Jiang and Aryan Thakur for their contributions in curating the comprehensive list of traits from PheGenI.
- K. Norrgard, “Genetic variation and disease: GWAS,” Nature Education 1(1):87, 2008
- https://www.genome.gov/about-genomics/fact-sheets/Genome-Wide-Association-Studies-Fact-Sheet
- A. Auton, L.D. Brooks, R.M. Durbin, E.P. Garrison, H.M. Kang, J.O. Korbel, J.L. Marchini, S. McCarthy, G.A. McVean, G.R. Abecasis, “A global reference for human genetic variation,” The 1000 Genomes Project Consortium, Nature 526, 68–74, 2015, https://doi.org/10.1038/nature15393
- D. Altshuler, P. Donnelly, “A haplotype map of the human genome,” The International HapMap Consortium, Nature 437, 1299–1320, 2005, https://doi.org/10.1038/nature04226
- C. Li, M.D. Swartz, B. Yu, Y. Bai, X. Liu, “dbMTS: a comprehensive database of putative human microRNA target site SNVs and their functional predictions,” bioRxiv. 2019, doi: https://doi.org/10.1101/554485
- E.M. Ramos, D. Hoffman, H.A. Junkins, D. Maglott, K. Ohan, S.T. Sherry, M. Feolo, L.A. Hindorff. “Phenotype-Genotype Integrator (PheGenI): synthesizing genome-wide association study (GWAS) data with existing genomic resources,” Eur J Hum Genet, 22(1):144-147, 2014, doi:10.1038/ejhg.2013.96
- A. Maguolo, C. Zusi, A. Giontella, E.M.D.G. Miraglia, A. Tagetti, C. Fava, A. Morandi, C. Maffeis, “Influence of genetic variants in FADS2 and ELOVL2 genes on BMI and PUFAs homeostasis in children and adolescents with obesity,” Int J Obes (Lond). Aug 25, 2020, doi: 10.1038/s41366-020-00662-9. PMID: 32843713.
- I. He, T. Jiang, A. Thakur, Y. Bai, X. Qin, “Systematic and Comprehensive Survey of Genomic Loci Associated with Complex Diseases and Traits,” Proc. of the 2020 14th IEEE International Conference on Bioinformatics and Biomedicine (BIBM), 1, 1447-1452, 2020 doi: Bookmark: 10.1109/BIBM49941.2020.9313115
- S. Sakaue, J. Hirata, Y. Maeda, E. Kawakami, T. Nii, T. Kishikawa, K. Ishigaki, C. Terao, K. Suzuki, M. Akiyama, et al, “Integration of genetics and miRNA-target gene network identified disease biology implicated in tissue specificity,” Nucleic Acids Res, 46(22):11898-11909, 2018, doi: 10.1093/nar/gky1066
- Y. Okada, T. Muramatsu, N. Suita, M. Kanai, E. Kawakami, V. Iotchkova, N. Soranzo, J. Inazawa, T. Tanaka, “Significant impact of miRNA-target gene networks on genetics of human complex traits,” Sci Rep, 6:22223, 2006.
- D. Szklarczyk, A.L. Gable, D. Lyon, A. Junge, S. Wyder, J. Huerta-Cepas, M. Simonovic, N.T. Doncheva, J.H. Morris, P. Bork, et al, “STRING v11: protein-protein association networks with increased coverage, supporting functional discovery in genome-wide experimental datasets,” Nucleic Acids Res, Jan; 47, 607-613, 2019, doi: 10.1093/nar/gky1131
- R.D. Finn, A. Bateman, J. Clements, P. Coggill, R.Y. Eberhardt, S. R. Eddy, A. Heger, K. Hetherington, L. Holm, J. Mistry, et at, “Pfam: the protein families database,” Nucleic Acids Res, 42(Database issue):D222-D230, 2014, doi:10.1093/nar/gkt1223
- T.L. Bailey, M. Bodén, F.A. Buske, M. Frith, C.E. Grant, L. Clementi, J. Ren, W.W. Li, W.S. Noble, “MEME SUITE: tools for motif discovery and searching,” Nucleic Acids Research, 37:W202-W208, 2009, doi: 10.1093/nar/gkp335
- A.D. Yates, P. Achuthan, W. Akanni, J. Allen, J. Allen, J. Alvarez-Jarreta, M.R. Amode, I.M. Armean, A.G. Azov, R. Bennett, et al. “Ensembl 2020,” Nucleic Acids Research, 48(D1), 08 January 2020, Pages D682-D688, https://doi.org/10.1093/nar/gkz966
- W.J. Kent, C.W. Sugnet, T.S. Furey, K.M. Roskin, T.H. Pringle, A.M. Zahler, D. Haussler, “The human genome browser at UCSC,” Genome Res. 12(6):996-1006, 2002, https://genome.ucsc.edu/index.html
- D. Karagkouni, M.D. Paraskevopoulou, S. Chatzopoulos, I.S. Vlachos, S. Tastsoglou, I. Kanellos, D. Papadimitriou, I. Kavakiotis, S. Maniou, G. Skoufos, et al, “DIANA-TarBase v8: a decade-long collection of experimentally supported miRNA-gene interactions,” Nucleic Acids Res. 2018;46(D1):D239-D245, 2018, doi:10.1093/nar/gkx1141
- Y. Miyamoto, A.S. Mauer, S. Kumar, J.L. Mott, H. Malhi, “Mmu-miR-615-3p Regulates Lipoapoptosis by Inhibiting C/EBP Homologous Protein,” PLoS ONE 9(10), 2014: e109637. https://doi.org/10.1371/journal.pone.0109637
- E. Fabbrini, S. Sullivan, S. Klein, “Obesity and nonalcoholic fatty liver disease: biochemical, metabolic, and clinical implications,” Hepatology. 51(2):679-689, 2010 doi:10.1002/hep.23280
- M. Xu, S. Zhu, R. Xu, N. Lin, “Identification of CELSR2 as a novel prognostic biomarker for hepatocellular carcinoma,” BMC Cancer 20, 313, 2020, https://doi.org/10.1186/s12885-020-06813-5
- X. Feng, X. Xu, Y. Shi, X. Liu, H. Liu, H. Hou, L. Ji, Y. Li, W. Wang, Y. Wang, et al, “Body Mass Index and the Risk of Rheumatoid Arthritis: An Updated Dose-Response Meta-Analysis,” Biomed Res Int, 2019:3579081, doi:10.1155/2019/3579081
- M.D. George, J.F. Baker, “The Obesity Epidemic and Consequences for Rheumatoid Arthritis Care,” Curr Rheumatol Rep, 18(1):6, 2016, doi:10.1007/s11926-015-0550-z
- Z. He, R. Zhang, F. Jiang, H. Zhang, A. Zhao, B. Xu, L. Jin, T. Wang, W. Jia, W. Jia, et al, “FADS1-FADS2 genetic polymorphisms are associated with fatty acid metabolism through changes in DNA methylation and gene expression,” Clin Epigenet 10, 113, 2018, https://doi.org/10.1186/s13148-018-0545-5
- A. Kury?owicz, Z. Wicik, M. Owczarz, M.I. Jonas, M. Kotlarek, M. Swierniak, W. Lisik, M. Jonas, B. Noszczyk, M. Puzianowska-Kuznicka, “NGS Reveals Molecular Pathways Affected by Obesity and Weight Loss-Related Changes in miRNA Levels in Adipose Tissue,” Int J Mol Sci, 19(1):66. Published 2017 Dec 27, 2017, doi: 10.3390/ijms19010066
- K.M. Mah, J.A Weiner, “Regulation of WNT Signaling by Protocadherins,” Seminars in Cell and Developmental Biology, August 2017, doi: 10.1016/j.semcdb.2017.07.043
- P. Vakli, R. Deak-Meszlenyi, T. Auer, Z. Vidnyanskzy, “Predicting Body Mass Index From Structural MRI Brain Images Using a Deep Convolutional Neural Network,” Front. Neuriform, March 2020, https://doi.org/10.3389/fninf.2020.00010
- F. Bastardot, P. Marques-Vidal, P. Vollenweider, “Association of body temperature with obesity. The CoLaus study,” International Journal of Obesity, 43, 1026-1033, 2019
Citations by Dimensions
Citations by PlumX
Google Scholar
Crossref Citations
No. of Downloads Per Month
No. of Downloads Per Country
