Development of an EEG Controlled Wheelchair Using Color Stimuli: A Machine Learning Based Approach

Adv. Sci. Technol. Eng. Syst. J. 6(2), 754–762 (2021);
 DOI: 10.25046/aj060287
Brain-computer interface (BCI) has extensively been used for rehabilitation purposes. Being in the research phase, the brainwave based wheelchair controlled systems suffer from several limitations, e.g., lack of focus on mental activity, complexity in neural behavior in different conditions, and lower accuracy. Being sensitive to the color stimuli, the EEG signal changes promises a better detection. Utilizing the Electroencephalogram (EEG changes due to different color stimuli, a methodology of wheelchair controlled by brainwaves has been presented in this study. Red, Green, Blue (primary colors) and Yellow (secondary color) were chosen as the color stimuli and utilized in a 2 × 2 color window for four-direction command, namely left and right, forward and stop. Alpha, beta, delta and theta EEG rhythms were analyzed, time and frequency domain features were extracted to find the most influential rhythm and accurate classification model. Four classifiers, namely, K- Nearest Neighbor (KNN), Support Vector Machine (SVM), Random Forest Classifier (RFC) and Artificial Neural Networks (ANN) were trained and tested for assessing the performance of each of the EEG rhythm, with a five-fold cross-validation. Four different performance measures, i.e. sensitivity, specificity, accuracy and area under the receiver operating characteristic curve were utilized to examine the wholescale performance. The results suggested that Beta EEG rhythm performs the best apart from all the rhythms for the color stimuli based wheelchair control. While comparing the performance of the classifiers, ANN-based classifier shows the best accuracy of 82.5%, which is higher than the performance of the three other classifiers.
1. Introduction
This paper is an extension of work originally presented in 1st International Conference on Advances in Science, Engineering and Robotics Technology 2019 [1]. The presented paper [1] utilized electroencephalogram (EEG) for wheelchair control using color stimuli where the current article is expanded further to validate the EEG based wheelchair control system using multiple machine learning models. Also, this paper examines the utility of the different color stimulus on the EEG based wheelchair control system.
EEG is a reflection of our neurons activity which is associated with all kind of human behaviours- thoughts, emotional state, eye vision etc. Due to its nature, EEG changes its value of features with respect to different influencer like eye vision. The EEG rhythms are defined by their frequency range, named delta, theta, alpha, beta and gamma corresponds to 1-4 Hz, 4-8 Hz, 8-13 Hz, 13-30 Hz and 36-44 Hz respectively.
To make life easier of the person with quadriplegia and paralyzed patients, many initiatives have been taken, but most of the latest works are eye blink based control systems [2]. But eye blink can not be a good command due to its uneasiness to control. In [2], a system is introduced by means of a different range of attention level and double eye blink (both identified by EEG) to make a brain-controlled wheelchair. Four range of attention level as four direction command and double eye blink as on/off command were used at the preliminary level. Nonetheless, retain the attention level at an indefinite range requires sophisticated long term training, thus making these alike systems less feasible in real-world application. By using an indefinite number of eye blink as logic and cognitive level, a brain-computer interface (BCI) was developed with the wireless operation and interfaced with RS-232C in another study [3]. In order to make more advanced EEG based wheelchair, it was tried to be wireless. Depending on modification and attention; eye blinking signal the system was tried to be constructed in the study.
In some cases, steady-state visually evoked potentials (SSVEP) showed promising results [4]. There are some eye blink pattern-based works, which are also providing very optimistic results [5,6]. Neurosky mindwave headset was utilized in [6], which detected the eye blinks, counted and rendered to Arduino UNO by Bluetooth to control a DC motor and thus the wheelchair. In [6], EEG signal was extracted by MindWave mobile application and sent to the Rasberry pi microprocessor. The output of Rasberry pi and joystick are taken as input for Arduino Mega to control the DC motor through the motor driver. They introduced a virtual map by analyzing familiar wheelchair routes as well. In advance, eye blinking with glancing a model has been proposed in few studies [7,8]. Specifically in [7] autoregressive neural network was built to classify EEG eye signals such as eye blinking, eye glancing in left and right. In [8] Steady-State Visual Evoked Potential (SSVEP) based work and implementation of artificial neural network and support vector machine is introduced to classify flickering frequency lights. Here multiclass support vector machine worked better than ANN while input features was obtained from Fast Fourier Transform.
Most of the previous research on wheelchair control have worked with the eye blink, SSVEP or Internet of Things (IoT). But sill there are very few works on the EEG based wheelchair control. The use of Brain-computer interface (BCI) is currently in the research phase. The existing systems suffer from several limitations, e.g., lack of focus on mental activity, complexity in neural behaviour in different conditions, and lower accuracy. Being sensitive to the color stimuli, the EEG signal changes promises a better detection. A previous study worked with EEG signal for wheelchair control, where time-frequency domain features were extracted from the signals and used for the wheelchair control with a color stimuli pattern. By applying artificial neural network, the study found the beta EEG band as the most influential frequency band where alpha as the least influential band [1]. This study showed promising results but utilized only one classifier (ANN without hyperparameter tuning) for the classification approach and only one performance measure (mean square error) for the assessment of the system [1]. However, considering the sensitivity and specificity metrics are most important for an EEG based control system. As higher sensitivity with lower specificity leads to the higher false decision and the opposite trend causes the missing of a lot of negative states, a compromise between the two metrics is crucial.
The proposed study examines the EEG based wheelchair control using a 2 × 2 matrix shape color screen with the combination of four different colors, being Red, Green, Blue and Yellow. These four different colors have been proven to be sensitive to the EEG signal changes [1], which were designed to indicate the left/right/forward/stop functioning, and were assigned as four numerical values (0,1,2,3) to be considered as ground truth. The principal component analysis (PCA) was conducted to separate the background effect of color stimuli on the EEG signal. After the rhythm separation from EEG, the data analysis and classification was done. The data was recorded using the BIOPAC® data acquisition unit, and the pre-processing and feature extraction was done using the Acqknowledge-4.1® software [9,10].
So far, there is no specified classification model to be used for a specific dataset. Considering the computational complexity and the learning mechanisms, four supervised classification models, namely, K- Nearest Neighbor (KNN), Support Vector Machine (SVM), Random Forest Classifier (RFC) and Artificial Neural Networks (ANN) were trained, tested, and compared for evaluating the performance of each of the EEG rhythm. Being a smaller datest with respect to the number of features, five-fold cross-validation uas used to validate the performance of the classifiers. Four different performance measures (sensitivity, specificity, accuracy, and area under the receiver operating characteristic curve) were utilized to examine the system performance.
The following part of this paper is organized as follows- a brief methodology, including experimental design and tools, then the result section with the findings. Last, the paper was concluded followed by a short discussion on the outcomes.
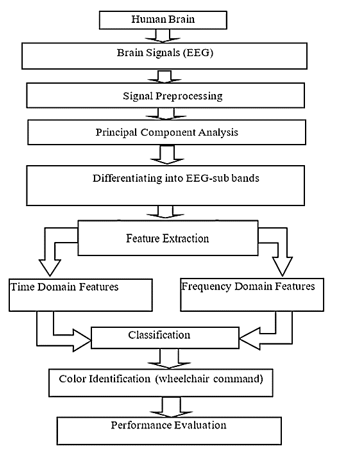 Figure 1: Block diagram for the proposed EEG based wheelchair control system
2. Methodology
2.1. Experimental Design
The roadmap for building an electroencephalogram based wheelchair by color stimuli is shown in figure 1. From the selected three participants, EEG were obtained by the BIOPAC® signal acquisition system. The eye blink artefacts were removed using the EOG blink removal techniques, with the help of Acqknowledge 4.1® software. Then FIR bandpass filter was used to separate bands while PCA for demolishing background effect. Afterwards, total twenty features were extracted for each of the EEG band, which are sensitive to color stimuli and the selected features were supplied towards the machine learning tools as the independent variable. The four different colors were coded to 0-3 as the dependent variable and were labeled for four different color detection. Four different classification models, namely K-nearest neighbours (KNN), support vector machines (SVM), artificial neural network (ANN) and random forest classifier (RFC) classifier models were developed in python 3.6.9 platform in Google Colab platform. Best classifier and rhythm were evaluated by their performance.
2.2. Experimental Equipment
2.2.1. Hardware tool
In this experimentation, BIOPAC MP 36 was used at Biomedical Engineering (BME) lab, KUET, which is shown in figure 2 [1].
2.2.2. Pre-processing and feature extraction software tool
BIOPAC® student Lab Pro and Acqknowledge 4.1® software was used for PCA and feature extraction. Machine learning based classification models were used in the python 3.6.9 version in Google Colab platform.
2.3. Participants
In this experiment, three subjects participated who were male, healthy and not suffering from any color blindness or psychological illness. and they were The color blindness was tested using the Ishihara 38 Plates CVD Test [11,12], to check their vision and to ensure they are not suffering from difficulties in choosing colors, especially the deuteranopic vision (red-green color blindness). Then, the Color stimulus matrix was shown in a computer monitor (21.5″ with a 1920 ×1080 resolution). The color stimuli was consisting of Red, Green, Blue (primary colors) and yellow (one of the secondary colors), which were utilized in a 2 × 2 dimension color window for four-direction command, namely left and right, forward and stop. The participants were instructed to focus on each of the color for 15 seconds long, with their normal blinking. It took 60 seconds (1 minute) in total to complete a full visualization of the four colors. The color matrix sub windows for the specific color were programmed to give a pulse after every 15 seconds, such that the participants can automatically focus on the specified sub-window. In total, 20 trials of 20 minutes were taken for visualization of the four colors sequentially, i.e., red, green, yellow and blue. The electrodes were placed on the right central (C4), and the right occipital (O2) position, with a reference electrode in A2 position.
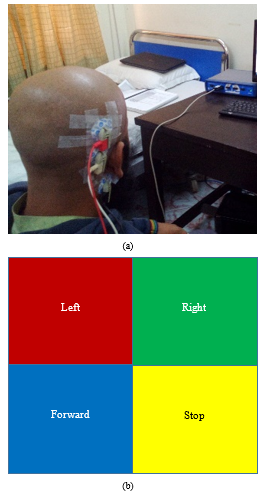 Figure 2. Representational view while conducting an experiment in BME lab, KUET (a) EEG electrode positions (b) Color arrangement in the screen for the wheelchair control system
2.4. Experimental Procedure
2.4.1. Signal Preprocessing
Because of muscle movement, eye blinking, hand movement and the background effect behind the colour stimulus, the primarily obtained EEG signals could have contained noise. Along with line frequency was 50 Hz. To pre-process raw EEG was gone through bandpass finite impulse response (FIR) filter with a range of 0.5 to 44 Hz, as it removes the non-linear trends of the signals. Later the signal was further smoothed, taking a moving average over a small period of the signal. Figure 3 shows the EEG signal representation with in Acqknowledge software.
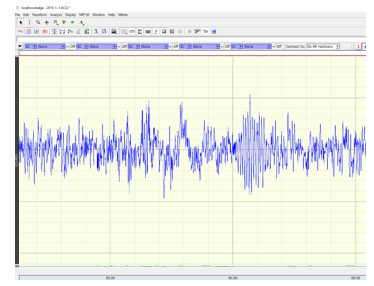 Figure 3. EEG signal representation in Acqknowledge-4.1® software
2.4.2. Principal Component Analysis
As a data reduction tool PCA decomposes input signal to a new signal, removing the components which are not significant. After the signal pre-processing and feature extraction, the PCA was used to select the most significant features, which included standard deviation (STDDEV), skew (sk), kurtosis (k), power spectrum density (PSD) mean, PSD max, PSD skew, Fast Fourier Transform (FFT) mean, FFT max, FFT skew. Total of nine features were chosen out of 20 features based on the PCA analysis. The features were selected based on the threshold that was put on ‘k’ principal components. It is worth noting that most of the selected features were frequency domain features.
2.4.3. Separation of the frequency sub-bands
The build-in bandpass filter was used in Acknowledge 4.1® software to find alpha, beta, delta and theta rhythm. The frequency ranges used for delta, theta, alpha and beta EEG bands are 1-4 Hz, 4-8 Hz, 8-13 Hz, 13-30 Hz, respectively.
2.4.4. Feature Extraction
Total twenty features were extracted in time and frequency domain, including maximum value (Emax), standard deviation (STDDEV), skew (sk), kurtosis (k), moment of order from one to five, Lyapunov exponent, mutual information (m), correlation coefficient (c), power spectrum density (PSD) mean, PSD max, PSD skew, Fast Fourier Transform (FFT) mean, FFT max, FFT skew were extracted for each subject, color, rhythm using the Acknowledge 4.1® software. An epoch size of 1 second was utilized to extract all the EEG features.
2.4.5. Feature Scaling
The features extracted from time and frequency domains have a different range in their magnitude. Different machine learning models work with various features putting them in the same matrix; it is necessary to put all the features in a same range, which is referred to as feature scaling. There are two common types of feature scaling that is done in preliminary data: standardization and normalization [13].
As a part of the normalization process, MinMaxScaling was done in this study in python platform using the MinMaxscaler() function from sklearn library. Here the data is shrunk within a range between [-1,1].
![]() The min-max scaling can be defined by the equation (1), where, is the normalized value of a feature point x, within a range and [13].
The min-max scaling can be defined by the equation (1), where, is the normalized value of a feature point x, within a range and [13].
2.5. Classification
To control a wheelchair on the decision of the appropriate movement, classification is the final step which is done with the help of machine learning models. Machine learning is the application of artificial intelligence, which provides a system capable of learning nature from a given data. There are three categories of Machine Learning models and applications, supervised learning, unsupervised learning and reinforcement learning [14]. Supervised learning is extensively used for the classification and regression problem [14]. Previous studies worked with EEG have used supervised learnings, especially K-Nearest Neighbour [15], Support Vector Machine [16], Random Forest Classifier [17] and Artificial Neural Network [18]. Based on the previous studies, these four classifiers were chosen for the data classification in this research.
2.5.1. K-nearest neighbours (KNN)
KNN is a simple supervised learning algorithm which is very popular and widely used for classification and regression problems. At the very starting point, KNN read the value of K, type of distance D and test data; then it finds the K nearest neighbours D to the test data and thus sets the maximum label class of K to test data. The same process is gone through as an iterative process named looping. In details, it’s algorithm initializes the value of K from 1 (setting as initial iteration value). After loading data, iteration from initial K =1 (generally) to total number of training data point. Then, distances specifically Euclidean distance between test data and each row of training data is measured and sorted in ascending order to get topmost k rows from the sorted array and the most frequent class is returned as the predicted class [19]. The value of K was tuned, and the K for best efficiency was chosen in the classifier model in this research to reduce overfitting.
2.5.2. Support Vector Machines (SVM)
SVM aims to obtain a hyperplane which classifies the data point (data points can be at any side of hyperplane) in feature dimensional space while depending on both linear and non-linear regression. Data points distance across to hyperplane are called support vector whose detection can exchange hyper plane’s location [19]. The model used a Gaussian kernel for SVM classifier in this research due to the non-linear trend of the dataset. Two parameters- ‘C’ and ‘gamma’ was adjusted within a set of values using the grid search algorithm to reduce overfitting.
2.5.3. Random Forest Classifier (RFC)
Random forests are made of individual decision trees with a logic of group of weak learners to finally make a strong learner while the decision trees operate as divided or conquer. A class is predicted from every decision tree and a final class is predicted by model depending on their vote [19]. Two parameters were tuned in the RFC models, namely, ‘n_estimate’, which implies the number of trees in the forest and ‘max-depth’ which signifies the depth of each tree.
2.5.4. Artificial Neural Network (ANN)
An ANN consists of neurons which assess the weighted sum of the inputs contemplating that there is a bias and passes the sum applying activation function such as sigmoid, RBF etc. The research used a feed-forward neural network model (with backpropagation algorithm) which relates input with appropriate output to obtain low squared error (output v/s expected output) by applying gradient descent. The number of hidden layers and the number of neurons in each hidden layer was tuned here in the ANN model. Regularisation was done using the dropout layer with a dropout rate of 0.5 to reduce overfitting.
2.6. Performance Measures
2.6.1. Sensitivity or True Positive Rate (TPR)
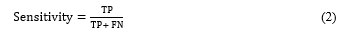
Sensitivity is the proportion of the true positives (desired factor), which is correctly identified from the given test set [20]. The definition of sensitivity can be provided by equation (2), where, TP = True Positive and FN = False Negative.
 2.6.2. Specificity or True Negative Rate (TNR)
Specificity is the proportion of true negative (undesired factor) in which was correctly excluded from the given test sets [20]. The definition of specificity can be provided by equation (3), where TN = True Negative and FP = False Positive.
 2.6.3. Accuracy
Accuracy is defined as the proportion of true results (either true positive or true negative) in an experiment [21,22]. The definition of accuracy can be provided by equation (3), given that TP = True positive, TN= True Negative, FP= False Positive and FN = False Negative
 2.6.4. Area under the receiver operating characteristic (ROC) curve (AUC)
To find out the best compromise between sensitivity and specificity, ROC is plotted. It is a plot of the sensitivity (true positive rate) against the (1- specificity) or false positive rate, where all the possible combination of TPR and FPR are plotted, showing the trade-off between them [16,20,23]. As sensitivity and specificity are two major parameters of performance measures, AUC under ROC always provide a compromise between them.
Five-fold cross-validation was done while evaluating the performance measures. For each of the validation, the dataset was divided in a ratio of 4:1 for training and test data, respectively. The mean value and the standard deviation (SD) were noted, considering the five experimental validations. As the classification is a four-class problem, one versus all method was used in all the classification approach, splitting the four-class problem in binary class. Thus, the mean sensitivity, specificity and AUC was calculated from the obtained confusion matrix.
3. Results
3.1. Data Visualization
The data points found from the selected features were plotted in violin plots to observe the range of each of the features. The following Figure 4 shows that the time and frequency domain features are having a versatile variation in the range in the horizontal box plot. The plots were done for the observation of the entire feature sets. The Maximum value/magnitude (of EEG signal) and the power spectral density maximum value show a greater range than the other features while the PSD mean and FFT (max) are showing the lowest range. Range of the difference features varies among themselves either in the time domain or in the frequency domain. Thus, feature scaling was done on the given dataset.
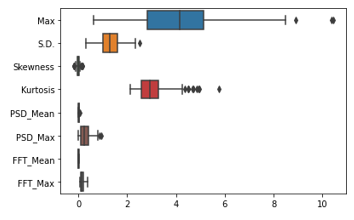 Figure 4: Box plot of part of the EEG beta rhythm features showing the varying magnitude of different features
3.2. Classification Performance
After necessary feature extraction and scaling, all the features were scaled and were supplied towards the machine learning models with necessary parameter tuning. Four different performance measures were evaluated, namely, sensitivity or true positive rate (TPR), specificity or true negative rate (TNR), accuracy and area under the receiver operating characteristic curve (AUC). The obtained results are listed below in Table 1.
3.2.1. Scenario 1: Delta Rhythm
The plots of the performance measures (mean ± SD) obtained from the classification of colours using the delta rhythm features from four different classifiers, KNN, SVM, RFC and ANN, are shown in the following Figure 5. The plots show that the gap between sensitivity and specificity is higher in KNN (gap = 15.3%) and RFC (gap = 7.9%). The gap is less in SVM (2.2%) and ANN (0.3%). Overall, ANN gives an accuracy of 62.8%, which performs the best.
Table 1: Performance measures (mean value) for EEG based wheelchair control using four different classifiers, with a five-fold cross-validation
| EEG Rhythm | Performance Metrics | KNN | SVM | RFC | ANN |
| Delta | Sensitivity | 60.8 | 55.4 | 55.1 | 63.3 |
| Specificity | 45.5 | 57.6 | 47.2 | 63 | |
| Accuracy | 53.5 | 56.2 | 54.6 | 62.8 | |
| AUC | 53.9 | 56.7 | 57 | 69.6 | |
| Theta | Sensitivity | 63.6 | 66 | 60.2 | 80.8 |
| Specificity | 55.6 | 62.8 | 60.6 | 62.1 | |
| Accuracy | 59.6 | 63.9 | 60 | 71.5 | |
| AUC | 59 | 64.5 | 70.6 | 73.2 | |
| Alpha | Sensitivity | 92.3 | 82.1 | 55.7 | 62.1 |
| Specificity | 25 | 62.5 | 60.7 | 52.9 | |
| Accuracy | 59.2 | 72 | 58.2 | 72 | |
| AUC | 55.1 | 71.8 | 68.1 | 63.4 | |
| Beta | Sensitivity | 82.7 | 78.2 | 79 | 88.5 |
| Specificity | 68.4 | 67.2 | 77.5 | 75.3 | |
| Accuracy | 75.4 | 72.7 | 77.5 | 82.5 | |
| AUC | 75 | 76.9 | 88.3 | 89.1 |
3.2.2. Scenario 2: Theta Rhythm
The plots of the performance measures (mean ± SD) obtained from the classification of colours using the Theta rhythm features are shown in the following Figure 6. The plots show that the gap between sensitivity and specificity is higher in ANN (18.8%), KNN (8.05%), and SVM (3.16%). Less gap is observed in the case of RFC (0.4%). Overall, ANN gives an accuracy of 71.5%, which performs the best.
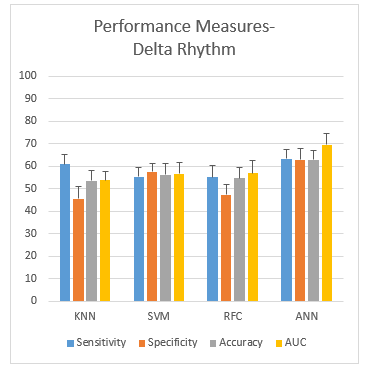 Figure 5: Performance measurement of delta rhythm
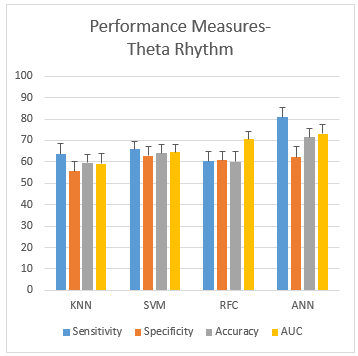 Figure 6: performance measurement of theta rhythm
3.2.3. Scenario 3: Alpha Rhythm
The plots of the performance measures (mean ± SD) obtained from the classification of colours using the Alpha rhythm features are shown in the following Figure 7. The plots show that the gap between sensitivity and specificity is higher in KNN (67.3%), SVM (19.7%) and ANN (9.19%). The gap is lees in RFC (5%). Overall, ANN gives an accuracy of 72%, which performs the best.
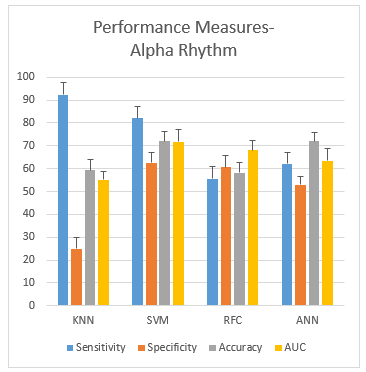 Figure 7: performance measurement of alpha rhythm
3.2.4. Scenario 4: Beta Rhythm
The plots of the performance measures (mean ± SD) obtained from the classification of colours using the Beta rhythm features are shown in the following Figure 8. The plots show that the gap between sensitivity and specificity is higher in KNN (14.3%), ANN (13.2%), and SVM (11%). The gap is lees in RFC (1.45%) and Overall, ANN gives an accuracy of 82.5%, which performs the best.
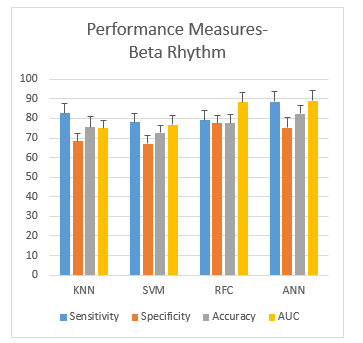 Figure 8: performance measurement of beta rhythm
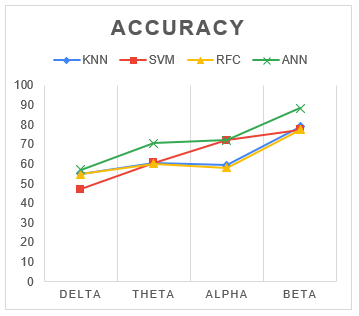 Figure 9: Comparison of accuracy matrics for four different classifiers
3.3. Choosing the best EEG Rhythm
To choose the best EEG frequency band, the overall accuracy measure was considered as the reference metrics as it is difficult to compare different classifiers using several factors. The plots of the accuracy for four different classifiers corresponding to the four different frequency band are shown in Figure 9. From the given figure, it is evident that the accuracy for beta rhythm is better than any other frequency bands for all the four classifiers. So, in the rest of the paper, the Beta EEG rhythm will be considered for further analysis.
3.4. Choosing the best classifier
The plots for the area under the ROC curve for the classifiers built using the Beta EEG features are shown in Figure 10 below. The figure illustrates that the ANN classifiers show the best compromise between sensitivity and specificity, with covering the highest area under the ROC curve (AUC = 0.89). Thus, the next part of the paper will compare the performance of the frequency bands considering ANN classifier.
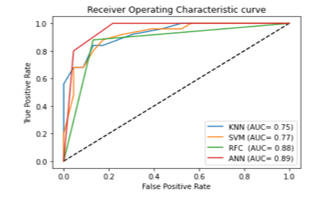 Figure 10: Comparison of AUC for four different classifiers built using the Beta EEG Features.
The plot of the area under the AUC curve for 5 different experiments in 5-fold cross-validation with the Beta rhythm using ANN classifier (see Figure 11). The AUC for beta rhythm-based models ranged from (0.75-0.92), with a mean of 0.89 and standard deviation of 0.07. This signifies that, the beta rhythm shows an excellent performance than the other frequency bands of EEG signal in EEG based wheelchair control using the color stimulus.
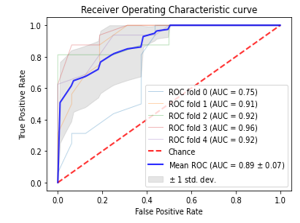 Figure 11: ROC Plots for Beta rhythm-based ANN model with 5-fold CV
4. Discussion
This study used four different classifiers for assessing the performance of the EEG rhythms for EEG based wheelchair control using colour stimuli. The results revealed that Beta rhythm performs the best among the other rhythms while the Alpha rhythm performs the worst. The delta and theta rhythm showed an average performance. The reason behind the better performance of the beta rhythm could be it is more prominent in the concentration while the theta and alpha are responsible for drowsiness and relaxation, respectively. It also revealed that the maximum performance was obtained using the ANN Classifier, with a sensitivity, specificity and accuracy of 88.5%, 75.3% and 82.5%. Moreover, ANN based model with beta EEG based dataset shows promising AUC (0.89), which is a good compromise between sensitivity and specificity. The finding of this study is consistent with the previous study [1], where the authors found the Beta band as the best performing rhythm, though they have used only one classifier (ANN), and one performance metrics (Accuracy). The possible reason behind the best performance of ANN could be the backpropagation algorithms, which is strong enough to learn the inherent features and complex structure of the data. This is likely due to the simultaneous update of the weights while running every iteration for each forward pass and backward pass. The study [1] also achieved a higher accuracy than the current study, which is probably due to not using the cross-validation techniques. Rather, a hold-out validation was used in the previous study [1], which most probably created overfitting problem. The given problems were overcome in the current study.
On the other hand, the Delta rhythm performs the worst (ANN accuracy = 62.8%). However, some difference is found in the obtained results due to different parameter setting in the neural network (such as hidden layers, and the number of neurons). For future implications, three major issues are recommended. First, using the four-colour stimuli that we have used and validated using EEG sub-bands. Second, using the Beta EEG-band power while utilizing the brain-computer interface system for wheelchair control, as it shows comparatively higher performance in identification of the different color stimuli. Third, it is recommended to use the color codes in a small monitor attached with the wheelchair handle, which would help the user to focus on the screen and thus enhance the detection accuracy of the control system. However, the scope of the paper is not out of limitations. The correlation of the EEG signal with different color stimuli was out of the scope of the study; however it could be considered for future research. The study consisted of only three healthy subjects, who are not paralysed. The lower sample size may lack the generalization for proper implication; however future research could be done on large number of sample and involving peoples suffered by paralysis. The background effect is one of the main challenges while using the color stimulus. Inter-individual difference among participants is another factor, which is needed to be considered. As the paper represented a novel methodology of EEG based wheelchair control using four different colours (for left-right/ forward/backward action), research is required to find out the feasibility in real-world condition as well.
5. Conclusion
In order to develop EEG controlled user-friendly wheelchair, using this proposed model, an analysis was done in this study to find out the feasibility of the time and frequency domain features. Here the designed system was obtained after applying several steps- feature scaling, tuning of classifiers and finally with five-fold cross-validation of the developed models. The analysis from the results of the study shows that beta rhythm shows the best accuracy with KNN (75.4%), SVM (72.7%), RFC (77.5%) and ANN (82.5 %). On the other hand, the Beta EEG rhythm offers the lowest accuracy with all classifiers. However, the experiment could be done on a greater number of participants to validate the model based on leave one participant out approach. Also, efficiency will increase with the addition of more EEG channels which can be considered for future work.
Conflict of Interest
The authors declare no conflict of interest.
Acknowledgment
The authors want to acknowledgment the staffs of the Biomedical Engineering Laboratory, KUET, for providing with the signal recording facilities.
- N. Hasan, M.M. Hasan, M.A. Alim, “Design of EEG based wheel chair by using color stimuli and rhythm analysis,” in 2019 1st International Conference on Advances in Science, Engineering and Robotics Technology (ICASERT), IEEE: 1–4, 2019, doi:10.1109/ICASERT.2019.8934493.
- A. Dev, M.A. Rahman, N. Mamun, “Design of an EEG-Based Brain Controlled Wheelchair for Quadriplegic Patients,” in 2018 3rd International Conference for Convergence in Technology (I2CT), IEEE: 1–5, 2018, doi:10.1109/I2CT.2018.8529751.
- J.-S. Lin, K.-C. Chen, W.-C. Yang, “EEG and eye-blinking signals through a Brain-Computer Interface based control for electric wheelchairs with wireless scheme,” in 4th International Conference on New Trends in Information Science and Service Science, IEEE: 731–734, 2010.
- K.-T. Kim, S.-W. Lee, “Towards an EEG-basedIntelligent Wheelchair Driving System with Vibro-tactile Stimuli,” in 2016 IEEE International Conference on Systems, Man, and Cybernetics (SMC), IEEE: 2382–2385, 2016, doi:10.1109/SMC.2016.7844595.
- P. Lahane, S.P. Adavadkar, S.V. Tendulkar, B.V. Shah, S. Singhal, “Innovative Approach to Control Wheelchair for Disabled People Using BCI,” in 2018 3rd International Conference for Convergence in Technology (I2CT), IEEE: 1–5, 2018, doi:10.1109/I2CT.2018.8529473.
- A. Maksud, R.I. Chowdhury, T.T. Chowdhury, S.A. Fattah, C. Shahanaz, S.S. Chowdhury, “Low-cost EEG based electric wheelchair with advanced control features,” in TENCON 2017-2017 IEEE Region 10 Conference, IEEE: 2648–2653, 2017, doi:10.1109/TENCON.2017.8228309.
- H.T. Nguyen, N. Trung, V. Toi, V.-S. Tran, “An autoregressive neural network for recognition of eye commands in an EEG-controlled wheelchair,” in 2013 International Conference on Advanced Technologies for Communications (ATC 2013), IEEE: 333–338, 2013, doi:10.1109/ATC.2013.6698132.
- R. Singla, A. Khosla, R. Jha, “Influence of stimuli colour in SSVEP-based BCI wheelchair control using support vector machines,” Journal of Medical Engineering & Technology, 38(3), 125–134, 2014, doi:https://doi.org/10.3109/03091902.2014.884179.
- D. Acquisition, Analysis with BIOPAC MP Systems, AcqKnowledge 4 Software Guide. pdf, Biopac Systems, Inc. ISO 9001: 2008.
- B.B. flow Monitor, Biopac Systems, Inc. ISO 9001: 2000.
- D. Flück, “Ishihara 38 Plates CVD Test| Colblindor,” Colblindor. WordPress. Nd Web, 7–11, 2016.
- H.M. Marey, N.A. Semary, S.S. Mandour, “Ishihara electronic color blindness test: An evaluation study,” Ophthalmology Research: An International Journal, 67–75, 2015.
- C. Colantuoni, G. Henry, S. Zeger, J. Pevsner, “SNOMAD (Standardization and NOrmalization of MicroArray Data): web-accessible gene expression data analysis,” Bioinformatics, 18(11), 1540–1541, 2002, doi:https://doi.org/10.1093/bioinformatics/18.11.1540.
- F. Pedregosa, G. Varoquaux, A. Gramfort, V. Michel, B. Thirion, O. Grisel, M. Blondel, P. Prettenhofer, R. Weiss, V. Dubourg, “Scikit-learn: Machine learning in Python,” The Journal of Machine Learning Research, 12, 2825–2830, 2011.
- F. Riaz, A. Hassan, S. Rehman, I.K. Niazi, K. Dremstrup, “EMD-based temporal and spectral features for the classification of EEG signals using supervised learning,” IEEE Transactions on Neural Systems and Rehabilitation Engineering, 24(1), 28–35, 2015, doi:10.1109/TNSRE.2015.2441835.
- S. Bhattacharyya, A. Khasnobish, S. Chatterjee, A. Konar, D.N. Tibarewala, “Performance analysis of LDA, QDA and KNN algorithms in left-right limb movement classification from EEG data,” in 2010 International conference on systems in medicine and biology, IEEE: 126–131, 2010.
- H. Lee, S. Choi, “Pca+ hmm+ svm for eeg pattern classification,” in Seventh International Symposium on Signal Processing and Its Applications, 2003. Proceedings., IEEE: 541–544, 2003.
- L. Fraiwan, K. Lweesy, N. Khasawneh, H. Wenz, H. Dickhaus, “Automated sleep stage identification system based on time–frequency analysis of a single EEG channel and random forest classifier,” Computer Methods and Programs in Biomedicine, 108(1), 10–19, 2012, doi:https://doi.org/10.1016/j.cmpb.2011.11.005.
- K. AlSharabi, S. Ibrahim, R. Djemal, A. Alsuwailem, “A DWT-entropy-ANN based architecture for epilepsy diagnosis using EEG signals,” in 2016 2nd International Conference on Advanced Technologies for Signal and Image Processing (ATSIP), IEEE: 288–291, 2016, doi:10.1109/ATSIP.2016.7523093.
- W. Zhu, N. Zeng, N. Wang, “Sensitivity, specificity, accuracy, associated confidence interval and ROC analysis with practical SAS implementations,” NESUG Proceedings: Health Care and Life Sciences, Baltimore, Maryland, 19, 67, 2010.
- A.-M. Šimundić, “Measures of diagnostic accuracy: basic definitions,” Ejifcc, 19(4), 203, 2009.
- A.-M. Šimundić, “Measures of diagnostic accuracy: basic definitions,” Medical and Biological Sciences, 22(4), 61, 2008.
- D. Justin, R.S. Concepcion, A.A. Bandala, E.P. Dadios, “Performance Comparison of Classification Algorithms for Diagnosing Chronic Kidney Disease,” in 2019 IEEE 11th International Conference on Humanoid, Nanotechnology, Information Technology, Communication and Control, Environment, and Management (HNICEM), IEEE: 1–7, doi:10.1109/HNICEM48295.2019.9073568.