
Convolutional Neural Network Based on HOG Feature for Bird Species Detection and Classification
Volume 6, Issue 2, Page No 733-745, 2021
Author’s Name: Susanto Kumar Ghosha), Mohammad Rafiqul Islam
View Affiliations
Computer Science and Engineering Discipline, Khulna University, Khulna 9208, Bangladesh
a)Author to whom correspondence should be addressed. E-mail: susanto_bag@yahoo.com
Adv. Sci. Technol. Eng. Syst. J. 6(2), 733-745 (2021); ![]() DOI: 10.25046/aj060285
DOI: 10.25046/aj060285
Keywords: Bird detection, Bird classification, Gabor filter, HOG feature, CNN, LeNet, ResNet

Export Citations
This work is concerned with the detection and classification of birds that have applications like monitoring extinct and migrated birds. Recent computer vision algorithms can precise this kind of task but still there are some dominant issues like low light, very little differences between subspecies of birds, etc are to be studied. As Convolution Neural Network is a state- of-the-art method with respect to the accuracy of various computer vision related work like object detection, image classification, and segmentation, so CNN based architecture has been proposed to do the experiment for this work. Besides we applied Gaussian and Gabor filters for noise reduction and texture analysis respectively. Histogram of Oriented Gradient (HOG) has been utilized for feature extraction as it is a widely accepted method and it can extract features from all portions of the image. LeNet and ResNet are two good architectures of CNN. In our work, we used the HOG extracted features as input to implement LeNet and ResNet. A standard dataset is used for the experiment and we found that LeNet based CNN gives better results than other methods like ResNet based CNN, SVM, AdaBoost, Random Forest, (we used for the experiment) and other existing state-of-the-art proposed work as well. The experimental results using LeNet based CNN gives 99.6% accuracy with 99.2% F-score , and 96.01% accuracy with 94.14% F-score in detection and classification of birds respectively.
Received: 15 December 2021, Accepted: 09 March 2021, Published Online: 27 March 2021
1. Introduction
Object detection is a work of identifying an object instance of a particular class within an image that deals with detecting the objects such as human, building, car, cat, bird, etc. Typically a few instances of the object remain in the image, however, a large number of possible locations and scales where they can present and that require to anyhow be explored. Any detection can be reported with some forms of pose information. The pose information contains the parameters of a linear or non-linear transformation. Object detection techniques are in two major categories, generative [1], [2] and discriminative [3], [4]. The first type is a probability method for the pose variability of the objects together with an appearance model. The parameters can be determined from training data and the decisions can be made based on ratios of posterior probabilities. The second type usually builds a classifier that can differentiate between images (or sub-images) with the object and those are without the object. The parameters of the classifier are considered to minimize errors in the training data. Object detection techniques have applications in different areas including robotics, medical image analysis, surveillance, and human-computer interaction.
Object recognition refers to a collection of related tasks for identifying objects in digital images. It is a technology in the field of image processing and computer vision for finding and identifying objects in an image or video sequence. It is one of the most important applications of machine learning and deep learning. The goal of this area is to teach machines to learn (understand) the content of an image like a human. Humans recognize a multitude of objects in images with little effort, although the image of the objects may vary somewhat in various viewpoints, in many different sizes and scales, or even when they are translated or rotated. This is a challenging task for computer vision systems. To perform this task many approaches have been proposed over the decades. Machine learning and deep learning are state-of-the-art methods used to detect and recognize the objects in the images.
In recent years, a huge improvement has been made by deep neural networks in detecting and recognizing images [5]. Although face recognition is the most common application area of deep neural network other objects like birds, retinal images are the candidates of the application of deep neural networks for recognition and detection. This is now rapidly used to cope up with various issues and some ecological problems too, our main interest is to recognize and detect birds. In the recognition task, we have tried to recognize crows and hawks.
From the last few years model of fine-grained recognition gained a lot of success in the purposes to solve the bird classification and detection problems [6], [7]. Birds are not a good object for detection as they have different flying positions as well as still positions. This the most difficult task to differentiate birds and other flying objects and it is the dominant cause of accidents in the sky. To rescue from this type of difficult situation the name of the fine-grained model is come first. Except for this image discovery using a camera is an excellent way of preclusion[8], [9]. The drawback of this system is to collect a great number of optical information and a system with high authorization. In this circumstance, for few decades Machine learning algorithms including deep learning algorithms are becoming quite famous and effective for recognition and it is also gaining great performance. Such algorithms are recurrent neural network(RNN), deep neural network, convolutional neural network (CNN), etc. In the contrast, shape, size, color, HOG, Haar-like, discriminative, texture-based features are very popular to gain better results [7], [10]–[12]. Improving results is shown by these deep learning algorithms in various types of competitions for struggle discovering and identify objects as shown in Figure 1.
However, the performance of the deep neural network in different aspects of computer vision problems including detection and classification are very impressive, but in real-world experience bird detection and classification are not easy tasks. In recent time some works considering detection and recognition of birds are done. Some related works are the experiments in [13]–[17]. Akito et.al. raised a model so that it can solve the problem of bird detection in the case of enlarged landscape images for applications in the wind energy industry [13]. Besides, Fagerlund and Seppo tried to build a system with automation for bird classification according to species considering their sound produced in the field [14]. To build architecture for visual categorization Branson, the author proposed a model that takes refuse in human accuracy. Their main concern is to differentiate among bird species [15]. A full model of bird species identification was proposed that would help inexperienced bird watchers. The model works by capturing images [16]. These works are not recent, the accuracy is not that satisfactory and the precession rate is not stable. In the case of low-resolution images of birds, the models are not certain.
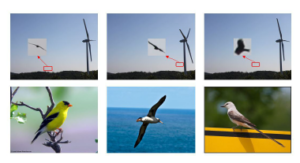
Figure 1: The images of birds taken around a wind farm (upper) [10] are significantly different from the generic image recogni- tion datasets (lower) [7].
A dataset from the neighboring area of a wind farm has been used as a benchmark dataset to find the actual accuracy as well as detection rate in case of low-resolution images of the birds in this work]. In this proposed method, as we know the Gabor filter and HOG features are promising we used these two in this experiment. A convolutional neural network (CNN) has been applied as a classifier. As bird detection is a very useful and important topic, many researchers were done for improving detection accuracy. Widely used methods are Support Vector Machine (SVM), AdaBoost, Decision Tree, Random Forest, Neural Network, and many other established machine learning approaches to detect a Bird. For feature extraction Histogram of Oriented Gradient (HOG), Gabor filter, etc. Using SVM and HOG good accuracy was obtained. From all the mentioned methods, Convolutional Neural Network(CNN), a deep learning approach is gaining much popularity in recent years. Moreover, the Deep learning method is best for its detection accuracy. Convolutional Neural Network is specially designed for the Computer Vision field. It works better on image data. HOG is a widely used feature extraction technique and along with the Gabor filter is used for feature extraction. We have used the Gaussian filter for removing noise and Gabor and HOG for extracting features. The convolutional neural network has worked tremendously well with these two feature extractors.
1.1 Motivation
We proposed the HOG feature based LeNet and ResNet models for the detection and classification task. LeNet and ResNet are two different architectures of Convolutional neural network and these are widely used too. The author used LeNet for road sign image detection and classification and they achieved an accuracy of 96.85% in the detection part and 96.23% in the classification [18]. The author used LeNet for detection and classification tasks and obtained 96.37% of accuracy in detection and 87.00% of accuracy for classification [10]. ResNet is also a promising and well-known
CNN architecture. The author used a hybrid classifier called SEResNet for breast cancer histopathological image classification. They obtained accuracy between 98.87% and 99.34% for the binary classification and achieve accuracy between 90.66% and 93.81% for the multi-class classification [19]. Another work done in white blood cell classification automatically They used ResNet architecture and got a real promising result [20]. From the above discussion, it is a fact that both LeNet and ResNet had a great ability in detection and classification tasks. This is the reason behind choosing LeNet and ResNet for bird detection and classification.
The rest of this paper has been discussed as the following organization. Section 2 briefly discusses similar work for bird detection and classification. Section 3 is a description of our proposed methodology. Section 4 has been written as a description of experimental results that includes experimental setup, implementation details, performance measures, and results. Finally, this work has been concluded in Section 5.
2. Related Works
Bird detection and classification are very important issues in the area of computer vision. Object detection specifically bird detection has received great attention during recent years. Some research papers related to this field are described below.
2.1 Detection of small bird’s semantic segmentation
A model was developed by Akito et.al. for solving the bird detection problem by using enlarged landscape images to apply in the wind energy industry [13]. In this experiment, the CNN model was trained for detection purposes and a method called super pixel-based semantic segmentation was used. To detect small birds they used a successor of CNNs. For better and concurrent detection and recognition of the background, the Super Parsing method was used. A fully FCNs was used for larger areas of images. Then, a combination of all of the detection results is made by a linear SVM. The results of the three methods are merged by using SVM to get high detection performance. The experimental results on an image dataset of birds showed significant high precision and efficiency of the proposed methodology [13]. Their proposed model achieved 87.2% accuracy.
2.2 Bird species recognition using support vector machines
Fagerlund and Seppo tried to build a system with automation for bird classification according to species considering their sound produced in the field condition [14]. In the first step based on the signal level, they classified the birds’ sounds into two specific parameters. Here for the automated recognition of birds, the SVM classification methods were used. A decision tree is another machine learning algorithm for classification and detection tasks that used along with the SVM. The task of classification between two species of birds is performed by the classifying methods. Then the performance of the models is tested according to the previously tested two sets of bird species. The previous test was done with a range of alternative methods. Compare to other existing systems this work suggests identical better or equal performance.
2.3 Bird species categorization using pose normalized deep convolutional nets
The author proposed a model that takes refuse in human accuracy. Their main concern is to differentiate among bird species [15]. They collect the local images of birds and find out features in the first step. A deep convolutional network is used to compute the extracted features to multiple image patches. The pose of the object in an image is described by these features. For learning a compact pose normalization space a graph-based clustering algorithm is presented. The performance of their model was increased for the use of CNN features which are modified by the CUB-200-2011 dataset for each region. They also used different CNN layers for different alignment levels. A similarity-based warping function was used in their method. More numbers of detected key points from the image are used to calculate features. At last, to learn a set of pose regions they introduced an approach. This system explicitly minimizes pixel alignment error and also beneficial for complex pose warping functions [15]. They achieved 75% accuracy on the CUB-200-2011 dataset.
2.4 Bird species identification from an image
A full model of bird species identification was proposed by Aditya, Ameya, and Rohit that would help inexperienced bird watchers. The model works by capturing images [16]. The main concern of this experiment was to identify the qualitative elaboration of various bird species by utilizing different machine learning methods. Actually for solving this problem, three key features were used. Color, pattern and shape features of a particular part of the images were used. For detecting birds in the images two machine learning algorithms
(the KNN and the NaiveBayes classifier) were used. To see the improvement of the Accuracy different feature selection and feature reducing approaches were utilized. Firstly, They used various changing kernels for SVM – Linear and Radial Basis Functions. Then, they applied PCA (reduces feature) and SVM, Logistic Regression, and LDA. After applying feature reduction methods these were applied. After that to remove low variance features and select tree-based univariate feature L1 based method was used. Then to get new feature data by feature selection PCA was used. LDA, Logistic Regression, and SVM were implemented with this data from the previous feature reduction method. They claimed that this technique helped them to increase accuracy [16]. Their proposed model achieved 75.7% accuracy.
2.5 Crow birds detection using HOG and CS-LBP
KidaneMihreteab and Masahiro Iwahashi(2012) Proposed a detector based on features for birds [17]. Using feature extraction methods for crow bird detection is the main target of this research. Here, by combining Histogram of Oriented Gradients(HOG) and CenterSymmetric Local Binary Pattern (CS-LBP) features, the discriminative descriptor feature is produced and applied to the model. The authors used SVM as a machine learning algorithm. Here, they compared the HOG CS-LBP feature and HOG-LBP combination feature and finally, HOG CS-LBP based combination performs better[17]. This proposed model achieved 87% accuracy.
2.6 Detection and species classification of bird with time-lapse image around a wind farm
The author was proposed a model for the detection of the bird. They used time-lapse images around a wind farm for this experiment [10]. Here, two approaches were compared, in their first approach they make a combination of AdaBoost(A machine learning algorithm) and Haar-like or HOG(feature extracting algorithms) and in other methods is made based on Convolutional neural networks (CNN). At last, they compared the accuracy and other performance measures between these two methods [10]. There proposed model achieved 99.2% on bird detection and 87% on bird classification. They experienced that their proposed method will continue to improve bird detection and classification in terms of both accuracy and speed in using for real-time applications.
2.7 Application of Deep-Learning Methods to Bird Detection Using Unmanned Aerial Vehicle Imagery
The author built a bird detection model by using aerial vehicle images [1]. Region-based Convolutional Neural Network (R-CNN), Region-based Fully Convolutional Network (R-FCN), Single Shot
Multi-Box Detector (SSD), Retinanet, and You Only Look Once (YOLO) are used as deep learning algorithms in this experiment. Migratory birds monitoring, counting, and detection of wild birds are mentioned as their experiment’s application. Here 95.44% of accuracy is achieved by the experiment.
2.8 Bird Image Retrieval and Recognition Using a Deep Learning Platform
The endemic bird classifier proposed and achieved 99.00% of accuracy [2]. They used CNN as a classifier algorithm and random flipping, rotation, and shifting are used as preprocessing methods. Skip layer connection can enhance feature quality. The authors proposed to skip layer connections for improving feature extraction.
3. Proposed Methodology
To detect birds from images, we perform the preprocessing steps and extraction of feature vectors from the image. Then the image passes through the classifier where the pre-trained model and weights come from the database. Then the model predicts the result if the image contained any bird. Different combinations of classifier model techniques are investigated to achieve a better result.
3.1 Training Phase
At first in this phase, we took a different number of samples where positive and negative samples are indicating images with birds and non-birds respectively. These positive and negative samples are passed through different phases. Both the training and validation sets are gone through pre-processing and feature extraction processes. The purpose of the training phase is to train the classifier and the validation set is responsible for checking the classifier’s performance. Mainly the purpose of the validation set is to increase accuracy. After that, the classifier has been fed with both training and validation sets.
3.1.1 Preprocessing
In preprocessing steps we have performed the following tasks.
Image Resizing We resized the images to 28×28 and then sent it for further processing.
Filtering [21] Images contain noise and for reducing the noises from images we used Gaussian filter. The benefit of this filter is it can preserve every useful detail when cleaning noise and it also helps to develop a fine-grained detection [21]. The following equation of 1 illustrates the equation of the Gaussian filter.
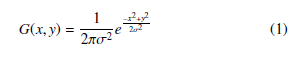
Here, intensities are represented by x and y of the input image, the standard deviation of Gaussian distribution is denoted by σ.
3.1.2 Feature Extraction
Suitable shape information which represents a pattern is found from feature extraction. These features are helped to make classifying tasks simple by a formal procedure. Machines and human eyes can respond differently about these features as features are the machineunderstandable codes. Every feature represents characteristics in an image like shape, position, the existence of a specific object. A normal image cannot be good enough for feature extraction so before feature extraction different preprocessing methods are applied to the raw images. Figure 2 is a flow of feature extraction in our experiment.
Gabor Filter A grayscale image is found from a pre-processed color image by applying the Gabor filter. After applying the Gabor filter the image is sent for HOG feature extraction.
Histogram of Oriented Gradients(HOG) HOG (Histogram of Oriented Gradients) is a feature extraction method that can extract features from every position of the image by constructing a local histogram of the image. In this technique, cells(small connected regions) construct the image. Within each cell, a HOG direction is composed of the pixels. First, the gradient of the input image of size 28×28 is found by utilizing a 16×16 filter. To provide a compact representation the filter describes a patch of an image. Magnitude and direction are two such values that are contained by the gradient of the patch. The overall lighting is a sensitive thing for gradients.
By dividing all pixel values by two we have made the image darker make our descriptor to be neutral to lighting diversity. As a variation of lighting is a barrier we must normalize the histogram in a way that this variation of lighting cannot be affected. By sliding 16×16 cells through all areas of image we can finally find HOG extracted image.
3.2 Classifier
A classifier is defined as a supervised function where the learned attribute is categorical. It is used after the learning procedure to classify new data by giving them the best target attribute. In our methodology, we have worked with CNN.
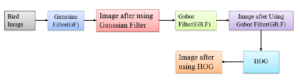
Figure 2: The feature extraction process.
3.2.1 Convolutional Neural Network(CNN)
In the proposed methodology, CNN has been used. Image classification, digit recognition, Indic handwritten script identification, object detection, and face recognition are the application area of CNN where already CNN has performed very well [22]–[26]. Although image detection and classification are not a very easy task for computer vision algorithms as well as machine learning algorithms CNN is very promising according to accuracy [10]. Moreover, CNN has an automatic learning ability and the ability to learn complex models. It works at pixel-level content. CNN works with some simple operation sequences like filtering, local contrast normalization, non-linear activation, local pooling. A dataset with a lot of data and a technique of training called backpropagation are key factors of the performance of CNN. The number of both the Convolutional layer and hidden layer are three in our proposed architecture of CNN. 28×28 sized images are fed into the convolutional layer. The convolutional layer has 3×3 sized 32 filters. Rectified Linear Unit (ReLU) is used as an activation function that is the non-negative part of its all arguments. Only zero or positive values can be passed. Here is the function of ReLU in equation 2:
![]()
Two convolutional layers with 64 and 128 filters respectively are used after that. The filter size is 3×3. After a journey through the convolutional layer, A flattened array is produced from the feature map. Convolution layers and flattening are followed by a fully connected hidden layer. The flattened array is passed through this hidden layer. With activation function ReLU we used 128 neurons in all three hidden layers. The only exception is in the output layer, the sigmoid function is used in the output layer contains. The previously hidden layer is fully connected with this output layer. The sigmoid function exists the value in a range of 0 and 1 that is why the output layer consists of a sigmoid function. Our proposed model has just binary output so the sigmoid function is useful here. Expression of sigmoid function:
![]()
‘No bird’ in the image will be the result for 0 as the output of the output layer and ‘one or more birds’ in the image will be the result for 1 as the output of the output layer. The overview of the proposed CNN model is in Figure 3.
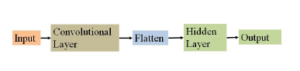
Figure 3: Block diagram of CNN architecture.
In the convolution layer, two sets of information are merged by a mathematical operation and this is called convolution. A feature map is produced by a convolution filter. In our case, 32 × (26×26) filter is used as a convolution filter on (28×28) sized image like Figure 4.
The convolution operation is performed by sliding the filter over the input image. Element-wise matrix multiplication occurred and the results are summed. The summed results are put at every location of the feature map. Every convolution layer is followed by a poling layer Figure 4. Among all pooling methods, max pooling is the most common. In our experiment 32 × (13×13) filters are used after conv1. Pooling is used to dimensionality reduction and max-pooling does this job by taking the maximum value. By sliding over the output from the convolution layer this filter takes maximum value to fill up every location. The input image goes through several convolutions and the pooling layer before feeding it to the flatten layer.
After Convolutional and pooling a fully connected hidden layer is added to wrap the CNN architecture as shown in Figure 5. Before passing through this layer output from pooling is flattening. Flattening is just arranging three-dimensional volumes of numbers into a linear vector. The fully connected hidden layer tasks the output from the flattening layer. In our experiment, 128 nodes are used in every layer of the hidden layer. An activation function is utilized in every layer as well as in the output layer. The hidden layer produces the input for the output layer. The whole model of CNN consisting of Input, Convolutional, Flatten, Fully connected hidden and Output layer is shown in Figure 6.
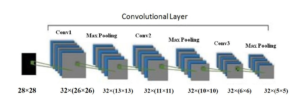
Figure 4: Convolution Layer of CNN.
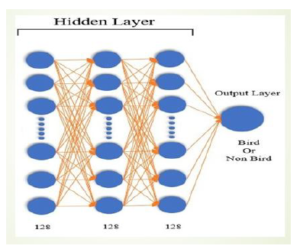
Figure 5: Hidden Layer of CNN.
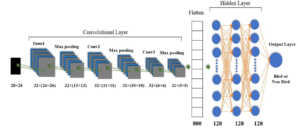
Figure 6: Full Model of CNN.
3.3 Model Parameter and Weights
After doing preprocessing and feature extraction the samples were divided into a training set and validation set where the training set was used for training the classifier and validation set was used for checking the classifier accuracy during training. By checking accuracy the validation set is improving the classifier. Then both sets are fed into the classifier. After finishing the training the model parameters such as 0, 1 and weights are stored in the database. When we predict the result in the testing phase, the pre-trained model parameter and weights are sent to the classifier.
3.4 Testing Phase
we took a different number of positive and negative samples, where positive and negative samples are indicating images with birds and non-birds respectively. Like the training phase, the pre-processing and the feature extraction methods are the same. Then the classifier predicted the result from the extracted features. ‘No bird in the image’ will be the result for 0 as the output of the output layer and ‘one or more birds in the image’ will be the result for 1. Figure 7 illustrates the full workflow of the system architecture. The proposed architecture is similar to the architecture used in our conference paper [27]. However, we have done an extensive experiment using different methods and compared the results.
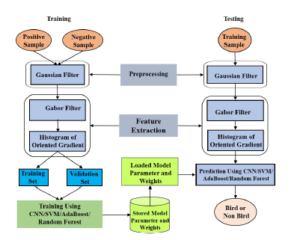
Figure 7: System architecture.
4. Experimental Results
We performed the experiment using dataset taken from link http://bird.nae- lab.org/dataset, which was also used for the experiment in the approach proposed in [10]. Two types of experiments such as bird recognition and classification of species were done here. Detection is treated as classification of birds and non-birds and the classification means differentiation between haws and crows. The haws and crows are the available classes of objects that were included in the dataset, where there is a sufficient amount of information for doing an experiment. The authors of the paper [10] took their images at the wind farm.
4.1 Experimental setup
In the experiment, positive and negative samples were used for training as it is required for the machine learning technique. As in the paper [10], we performed the experiment using both positive and negative samples. For a fair comparison, the 6000 positive samples and 20000 negative samples were used for the experiment. Examples of birds and non-birds are shown n Figure 8. The 5-fold cross-validation process was used to perform the experiment proficiently. In the detection experiment, birds labeled in the dataset were positive samples and non-birds were negative samples [http://bird.naelab.org/-dataset.]. In the detection experiment, birds labeled in the dataset were positive samples and non-birds were negative samples. In the classification experiment, hawks labeled in the dataset were positive samples, and crows were negative samples. Figure 8. We conducted holdout validation using 600 hawks and 200 crows for the training data and the rest of each group for the test data.
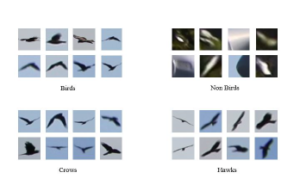
Figure 8: Sample images of the dataset [10].
Table 1: Categories of Images in Dataset [10]
| S/L | Name of class | Number of Images | Total |
| 1 | Birds | 5000 | |
| 2 | Non-birds | 20000 | 29000 |
| 3 | Crows | 1000 | |
| 4 | Hawks | 3000 |
In the classification experiment, hawks labeled in the dataset were positive samples, and crows were negative samples. Classification is a more difficult task than detection on this dataset; thus, to evaluate the behavior of each method in detail, we investigated the effect of image resolution by dividing the positive and negative images into groups based on resolution. Figure 8. We conducted holdout validation using 600 hawks and 200 crows for the training data and the rest of each group for the test data.
In SVM we had to vary parameters called C (regulation parameter) and gamma (kernel co-efficient). We used RBF (radial basis function) as a kernel. We used 5 numbers between 0.25 and 128 as C and 5 numbers between 0.08 and 4 as gamma. In detection at C = 0.1 and gamma = 0.8 SVM performed best and in classification task SVM performed best at C=64.125 and gamma = 0.02. For the AdaBoost algorithm, 100 weak classifiers worked better than 50 weak classifiers in both detection and classification. The different learning rates are used in this case. Detection worked best at the learning rate of 0.3 and classification worked best at the learning rate of 0.01.
Random Forest 500 weak classifiers performed better than 250 weak classifiers in both detection and classification. Among different maximum depth of trees in Random Forest, the detection task worked better at the maximum depth of 4 and the classification task worked better at the depth of 7.
For CNN we used 128 output filters and 3×3 kernel size. We used three convolution layers and three max-pooling layers to construct the network. Here, we used ReLU as the activation function. This method performed best among the methods described above.
In the experiment, we evaluated the four best methods in the detection (bird-vs-non-bird) and classification (hawk-vs-crow) experiment, namely CNN, Ada-Boost, Random Forest, and SVM. We quantified the detection and classification performance by using two measures, true positive rate (TPR) and false-positive rate (FPR). TPR is the ratio of the number of true positives and the number of all positives in the test data. FPR is the ratio of the number of false positives and the total number of negatives in the test data. Because there is an equipoise between TPR and FPR, the total performance of an algorithm is represented by the receiver operating characteristic curve (ROC), a curve of TPR versus FPR. A curve that goes near the upper left-hand corner means better performance.
4.2 Implementation details
In this work, we used four different methods for detection between birds and non-birds and classification between crows and hawks. The methods are SVM, AdaBoost, Random Forest and CNN (LeNet, ResNet).
In our proposed LeNet(CNN) architecture we used 128×3×3 convolution layers. The input shape of the images is 28×28. Then Batch Normalization is done and we used Leaky Relu as an activation function. The same layer of previous has been repeated. Then the pooling operation applied with the pool size of 2×2. Another two-layer like before applied after this with 256×3×3 convolution layers. Here the pool size is 2×2. Then the output is flattened and the flattened output is feed to the fully connected neural network. This network consists of three layers with a dense of 512, 256, and Every layer is activated by LeakyRelu and we used sigmoid as the activation function for binary classification. Figure 9 illustrates the architecture.
ResNet is several leveled or staged architecture. In Figure 10 architecture of ResNet has been shown. In our proposed architecture applied a 64×7×7 convolution layer to the 64×64 image. Then batch normalization and activation are done. We applied max pooling with the 3×3 filter. Let, this is called convolution block. Another block we called ResNet which contains three convolution layers. Firstly pre-processed imaged feed to two consecutive convolutional layers. After that, the output is stored and feed to two consecutive ResNet blocks like Figure 9. Previous results from two convolutional layers and current output from these ResNet blocks are added and feed to another convolution layer. Then the output from this layer and output by feeding another three ResNet blocks is added and feed to the output feed to another ResNet block. Like previous, the result from another five ResNet blocks and the convolutional layer is added and feed to another convolution layer. The result from this layer and result from another 2 consecutive ResNet block is added and average pooling applied. Then the result is flattened and feed to the fully connected layer. The process is shown in Figure 10.
In SVM we had to vary parameters called C (regulation parameter) and gamma (kernel co-efficient). We used RBF (radial basis function) as a kernel. We used 5 numbers between 0.25 and 128 as C and 5 numbers between 0.08 and 4 as gamma. In detection at C = 0.1 and gamma = 0.8 SVM performed best and in classification task SVM performed best at C=64.125 and gamma = 0.02.
For the AdaBoost algorithm, 100 weak classifiers worked better than 50 weak classifiers in both detection and classification. We used different learning rates in this case. Detection worked best at the learning rate 0.3 and classification worked best at the learning rate of 0.01.
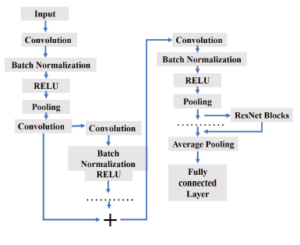
Figure 10: Propossed ResNet(CNN) architecture.
Random Forest 500 weak classifiers performed better than 250 weak classifiers in both detection and classification. Among different maximum depth of trees in Random Forest, the detection task worked better at the maximum depth of 4 and the classification task worked better at the depth of 7.
4.3 Performance Measures
For calculating the accuracy, precision, and recall first we have taken the true positive, true negative, false positive, and false negative from the confusion matrix. Then we have calculated accuracy, precision, recall using the confusion matrix. For the dataset, we have got a confusion matrix.
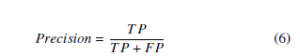
Accuracy means the number of appropriate results from the whole dataset divided by all samples. The accuracy is calculated by the following equation.
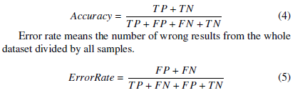
Precision means the number of accurate results (or true positives, a bird that is detected as a bird) divided by the number of all positive results (that is, the sum of birds and non-birds detected as birds). Precision shows the probability that a retrieved object was a bird [28].
Recall means the number of appropriate results divided by the sum of birds detected as birds, and birds not detected as a bird.
Recall shows the probability that a bird was retrieved [28].
![]()
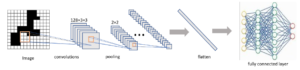
Figure 9: Proposed LeNet(CNN) Architecture.
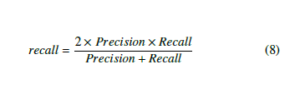
The F-score measures the accuracy of a test by dealing with both the Precision and the Recall. F-score is very effective to avoid unbalanced systems [28].
In this research area, our proposed methodology performs very well as the accuracy of detection is 99.60% and classification is 96.01%.
We have run the CNN model several times with changes of a convolutional layer, convolutional layer feature map size, hidden layer, input shape, number of neurons and we have got the best result according to the dataset. After testing with the dataset we have got a confusion matrix for bird detection shown in Figure 11. and a confusion matrix for bird classification given in Figure 12.
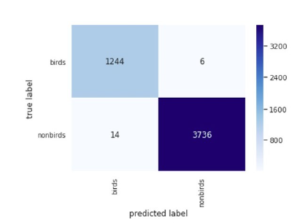
Figure 11: Confusion matrix for bird detection(LeNet).
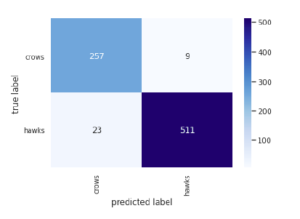
Figure 12: Confusion matrix for bird classification(LeNet).
4.4 Results
The detection results are shown in Figure 13. In this figure, we introduced a visual plotting called ROC (receiver operating characteristic) curve. Here, we see that the blue curve (curve for CNN) more prone to the upper left corner. The other curves red, yellow and green are for AdaBoost, Random forest, and SVM respectively. These three curves are less prone to the upper left corner than the curve of CNN. That is why we can say that CNN performed best. In the figure, FPR means the rate of misrecognizing backgrounds as birds, and TPR means the rate of correctly recognizing birds. Even at the FPR of 0.09, CNN detected over 0.97 of the birds. Flying objects are more difficult than negatives due to their visual similarity to birds. Note that the number of false detections depends on the number of negative samples in the data. More negative samples mean more false detections with the same FPR. Thus, the actual number of false detections may change depending on the test environment.
The results of the classification (hawk vs crow) are shown in Figure 14. In this figure, It can be seen that the blue curve for CNN is more prone to the upper left corner. The other curves red, yellow and green are for AdaBoost, Random forest, and SVM respectively as detection. These three curves are less prone to the upper left corner than the curve of CNN. In this case, again the ROC curve shows us that CNN performed best. Here, FPR is the rate of misrecognizing crows as hawks, and TPR is the rate of correctly recognizing hawks. This curve shows the overall performance in the resolution groups. Because of visual similarity, the species classification is more difficult than the birds-versus-others classification; thus, its performance is lower. However, among the methods, the deep learning methods showed relatively promising results for classification. For example, at the FPR of 0.1, CNN detected 0.90 of the hawks. By contrast, when we set the TPR at as high as 0.9, CNN misclassified 0.3 of the crows as hawks.
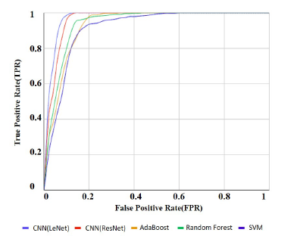
Figure 13: Result of detection (birds vs. non-birds). Curves that go closer to the upper left-hand corner have better performance .
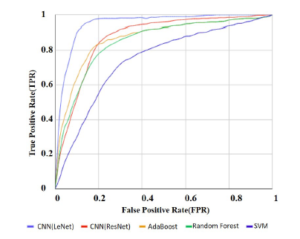
Figure 14: Result of classification (crows vs. hawks). Curves that go closer to the upper left-hand corner have better performance .
Sometimes, visually similar images are correctly classified, sometimes not. The CNNs do not have explicit misclassification trends because of their black-box training process.
4.5 Comparision
The objectives of HOG-CNN techniques are used to improve detection and classification accuracies and compare them with the results of existing techniques. In this experiment, we have worked with the dataset [10] using the Gabor filter, HOG, and CNN. CNN has been run several times and the best result is taken. In this experiment Intel(R) Core(TM) i5-4200M CPU with 2.50 GHz and 4GB RAM have been used. Python is used as a programming language. For this purpose, we have used OpenCV for preprocessing and feature extraction and Keras and tensor flow for training and testing the model. The results are collected and compared with different methods. Comparison is shown in tables 2 and 3.
Table 2: Experimental results of bird Detection
| Methods | Accuracy | Precision | Recall | F-score |
| CNN(LeNet) | 99.60% | 99.52% | 98.89% | 99.2% |
| CNN(ResNet) | 96.37% | 95.24% | 84.50% | 89.55% |
| R.Yoshihashi et. al. | 99.20% | 90.16% | 75.13% | 81.96% |
| SVM | 92.22% | 97.53% | 92.65% | 95.03% |
| Ada Boost | 94.34% | 96.64% | 83.36% | 89.51% |
| Random Forest | 94.42% | 94.32% | 85.00% | 89.41% |
| Table 3: | Experimental re | sults of bird Cla | ssification | |
| Methods | Accuracy | Precision | Recall | F-score |
| CNN(LeNet) | 96.01% | 96.61% | 91.79% | 94.14% |
| CNN(ResNet) | 78.54% | 76.40% | 65.20% | 70.36% |
| R.Yoshihashi et. al. | 87.00% | 88.99% | 92.08% | 69.13% |
| SVM | 75.25% | 74.43% | 60.37% | 66.88% |
| Ada Boost | 79.12% | 77.44% | 65.81% | 71.15% |
| Random Forest | 80.83% | 81.2% | 67.71% | 73.84% |
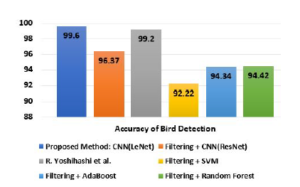
Figure 15: Accuracy comparison of bird detection (birds vs non-birds).
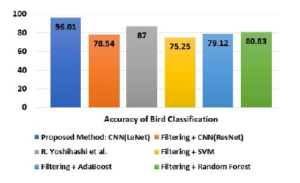
Figure 16: Accuracy comparison of bird classification (hawks vs crows).
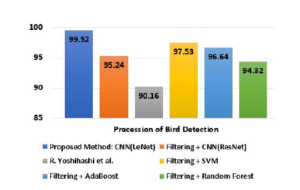
Figure 17: Precision comparison of bird detection (birds vs non-birds).

Figure 18: Precision comparison of bird classification (hawks vs crows).
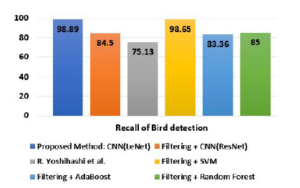
Figure 19: Recall comparison of bird detection (birds vs non-birds).
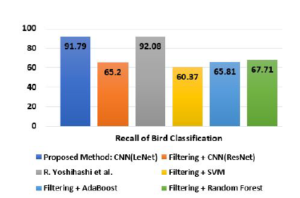
Figure 20: Recall comparison of bird classification (hawks vs crows).
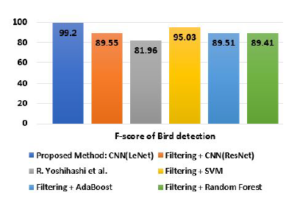
Figure 21: F-score comparison of bird detection (birds vs non-birds).
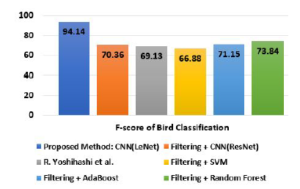
Figure 22: F-score comparison of bird classification (hawks vs crows).
Furthermore, the author achieved an average of 95.37% for bird recognition [2], the author got 88.00% of accuracy for bird detection using Siamese neural network [3], and attain an average of 93.19% of accuracy on bird species identification [4]. In the bird detection case, we got the highest 99.60% of accuracy by using LeNet (CNN) architecture and in the bird classification case, 96.01% accuracy has been achieved by LeNet (CNN). In both of the cases, our LeNet (CNN) architecture shows higher accuracy.
Tables 2 shows the results of accuracies with F-scores of all compared methods in detection of birds. On the other hand Table 3 gives the results of accuracies with F-scores of all compared method in claasification of bird. In Figures 15 and 16 we depict the results of accuracy in detection and classification of bird. Figures 17 and 18 are for comparisons of precisions of all methods in detection and classification respectively. Comparisons of recalls of all methods are shown in Figures 19 and 20. Finally, Figures 21 and 22 shows the comparisons of all methods in case of F-score.
4.6 Discussion
Birds are really important for ecological balance. Bird detection and classification have some applications. Monitoring extinct birds is one of them. By monitoring the extinct birds, it could be understood how and why they are on the verge of extinction. Another application of this experiment is monitoring the migrated birds. Migrated birds can carry different types of germs that can spread diseases in the area around them. If these birds could be observed, it is possible to keep them detached from human residences. Furthermore, new bird watchers couldn’t recognize different species. So a tool is being provided for helping them.
In the detection experiment, we obtained the best results using CNN. The existing features are designed for detecting objects such as faces and pedestrians, which are not often at low resolution. Thus, these features are not necessarily effective in our bird detection because of the limited object resolution. For example, HOG represents details of images by gradients and is preferred in tasks like pedestrian detection and generic object detection. However, it is less robust for low-resolution bird detection. The parameters and optimization play an important role in the performance of CNN [10].
In the classification experiment, CNN outperformed the other methods in all groups with different resolutions, and Random Forest performed the second best. The hand-crafted features may be less effective in classification because of the subtle differences between the classes. Conversely, the learned features of the CNNs succeeded in adapting to the classification task through training. The size of the training data may have been the reason. The classification experiments were conducted with less training data than in detection, and this put deeper networks, which are more difficult to train, at a disadvantage.
The results of the filtering experiment suggest that classifiers work well even when unspecifiable birds exist in the environment. This means that our classifiers can extract a single species from all the data, and this is useful for investigation purposes. Each method performs 10% to 20% better in filtering than in classification. This seems to be because of unspecifiable birds have distinguishable characteristics in themselves from specifiable hawks, and this makes filtering easier than classification.
In Our proposed methodology we used resized images. Images are then filtered by Gaussian filter to reduce noises and Gabor filter to make the grayscale of the image. Then we used the HOG feature as an input of LeNet and ResNet architecture of CNN. For evaluating results we also applied other machine learning algorithms like SVM, AdaBoost, and Random Forrest.
The author’s work is based on Haar-like and HOG features using LeNet Architecture for the detection of birds and classification of bird species[10].
The author proposed a method for wild bird detection [1]. They used five different deep-learning-based object-detection methods for the experiment, i.e., Faster R-CNN, R-FCN, SSD, Retinanet, and YOLO, to create bird detection models using aerial photographs captured by UAV. For deep neural networks, they cropped the images in the size of 600×600. Then they were divided into sub-images and flipped horizontally and vertically.
The author proposed a model for bird image retrieval [2]. They develop the Internet of Birds (IoB) mobile app for bird image retrieval, applied the softmax distribution to function to obtain a probability distribution of bird features, use a convolutional neural network (CNN) and SVM. So, It is clear that we have introduced a new methodology.
5. Conclusions
We used a bird-image dataset and evaluated typical image recognition methods for the purpose of developing an automatic bird detection and classification system for wind farms. By using a dataset from a realistic environment and representative methods in computer vision, we provided practical results and analyses of recognition performance. The experiments were executed using our CNN based architecture and we found that LeNet based CNN gives the best results than other approaches like ResNet based CNN, SVM, Adaboost, Random forest, existing state of the art method in recognition and classification of birds. The LeNet based CNN shows 99.6% accuracy and 99.2% F-score in case of detection of bird. On the other hand it shows 96.01% accuracy and 94.14% F-score in case of classification of bird. Hence we can conclude that LeNet based CNN gives highest results both in accuracy and F-score. In this work, we use binary species classification but the work with multiple bird species classification can be done in the future.
Conflict of Interest
The authors have no conflict of interest.
Acknowledgment
This work is funded by the division of Information and Communication Technology (ICT), Ministry of Posts, Telecommunications and Information Technology, the People’s Republic of Bangladesh.
- S.-J. Hong, Y. Han, S.-Y. Kim, A.-Y. Lee, G. Kim, “Application of deep- learning methods to bird detection using unmanned aerial vehicle imagery,” Sensors, 19(7), 1651, 2019, doi:10.3390/s19071651.
- Y.-P. Huang, H. Basanta, “Bird image retrieval and recognition using a deep learning platform,” IEEE Access, 7, 66980–66989, 2019, doi:10.1109/ ACCESS.2019.2918247.
- S. P. R Gupta, D. Vanusha, “Bird Detection using Siamese Neural Network,” International Journal of Innovative Technology and Exploring Engineering, 9, 2020, doi:10.35940/ijitee.E2468.059720.
- S. Raj, “Image based Bird Species Identification using Convolutional Neu- ral Network,” International Journal of Engineering Research and, V9, 2020, doi:10.17577/IJERTV9IS060279.
- R. Yoshihashi, R. Kawakami, M. Iida, T. Naemura, “Evaluation of bird detec- tion using time-lapse images around a wind farm,” in European Wind Energy Association Conference, 2015.
- J. Krause, H. Jin, J. Yang, L. Fei-Fei, “Fine-grained recognition without part annotations,” in Proceedings of the IEEE Conference on Computer Vision and Pattern Recognition, 5546–5555, 2015, doi:10.1109/CVPR.2017.688.
- C. Pang, H. Yao, X. Sun, “Discriminative features for bird species classifi- cation,” in Proceedings of International Conference on Internet Multimedia Computing and Service, 256–260, 2014, doi:10.1145/2632856.2632917.
- S. C. Clough, S. McGovern, D. Campbell, M. M. Rehfisch, “Aerial survey techniques for assessing offshore wind farms,” in International Council for the Exploration of the Sea, Conference and Meeting (CM) Documents, 2012.
- S. Clough, A. Banks, “A 21st century approach to aerial bird and mammal surveys at offshore wind farm sites,” in EWEA Conference, 2011.
- R. Yoshihashi, R. Kawakami, M. Iida, T. Naemura, “Bird detection and species classification with time-lapse images around a wind farm: Dataset construction and evaluation,” Wind Energy, 20(12), 1983–1995, 2017, doi:10.1002/we.2135.
- K. Santosh, L. Wendling, S. Antani, G. R. Thoma, “Overlaid arrow detection for labeling regions of interest in biomedical images,” IEEE Intelligent Systems, 31(3), 66–75, 2016, doi:10.1109/MIS.2016.24.
- K. Santosh, S. Antani, “Automated chest X-ray screening: Can lung region symmetry help detect pulmonary abnormalities?” IEEE transactions on medical imaging, 37(5), 1168–1177, 2017, doi:10.1109/TMI.2017.2775636.
- A. Takeki, T. T. Trinh, R. Yoshihashi, R. Kawakami, M. Iida, T. Naemura, “Combining deep features for object detection at various scales: finding small birds in landscape images,” IPSJ transactions on computer vision and applica- tions, 8(1), 1–7, 2016, doi:10.1186/s41074-016-0006-z.
- S. Fagerlund, “Bird species recognition using support vector machines,” EURASIP Journal on Advances in Signal Processing, 2007(1), 038637, 2007, doi:10.1155/2007/38637.
- S. Branson, G. Van Horn, S. Belongie, P. Perona, “Bird species catego- rization using pose normalized deep convolutional nets,” arXiv preprint arXiv:1406.2952, 2014.
- A. Bhandari, A. Joshi, R. Patki, “Bird Species Identification from an Image,” 2014.
- S. Fagerlund, “Bird species recognition using support vector machines,” EURASIP Journal on Advances in Signal Processing, 2007(1), 038637, 2007, doi:10.1155/2007/38637.
- A. Bouti, M. A. Mahraz, J. Riffi, H. Tairi, “A robust system for road sign detec- tion and classification using LeNet architecture based on convolutional neural network,” Soft Computing, 1–13, 2019, doi:10.1007/s00500-019-04307-6.
- Y. Jiang, L. Chen, H. Zhang, X. Xiao, “Breast cancer histopathological im- age classification using convolutional neural networks with small SE-ResNet module,” PloS one, 14(3), e0214587, 2019, doi:10.1371/journal.pone.0214587.
- M. Habibzadeh, M. Jannesari, Z. Rezaei, H. Baharvand, M. Totonchi, “Auto- matic white blood cell classification using pre-trained deep learning models: Resnet and inception,” in Tenth international conference on machine vision (ICMV 2017), volume 10696, 1069612, 2018, doi:10.1117/12.2311282.
- G. Deng, L. Cahill, “An adaptive Gaussian filter for noise reduction and edge detection,” in 1993 IEEE conference record nuclear science symposium and medical imaging conference, 1615–1619, IEEE, 1993, doi:10.1109/NSSMIC. 1993.373563.
- D. C. Cires¸an, U. Meier, L. M. Gambardella, J. Schmidhuber, “Deep, big, simple neural nets for handwritten digit recognition,” Neural computation, 22(12), 3207–3220, 2010, doi:10.5220/0004743103860393.
- I. S. Krizhevsky, Alex, G. E. Hinton, “Imagenet classification with deep convo- lutional neural networks,” Advances in neural information processing systems, 25, 1097–1105, 2012, doi:10.1145/3065386.
- C. Szegedy, A. Toshev, D. Erhan, “Deep neural networks for object detection,” Advances in neural information processing systems, 2, 2553–2561, 2013.
- S. Lawrence, C. L. Giles, A. C. Tsoi, “Convolutional neural networks for face recognition,” in Proceedings CVPR IEEE Computer Society Confer- ence on Computer Vision and Pattern Recognition, 217–222, 1996, doi: 10.1109/CVPR.1996.517077.
- S. Ukil, S. Ghosh, S. M. Obaidullah, K. Santosh, K. Roy, N. Das, “Deep learning for word-level handwritten Indic script identification,” arXiv preprint arXiv:1801.01627, 2018.
- S. K. Ghosh, M. R. Islam, “Bird Species Detection and Classification Based on HOG Feature Using Convolutional Neural Network,” in International Confer- ence on Recent Trends in Image Processing and Pattern Recognition, 363–373, 2018, doi:10.1007/978-981-13-9181-1-32.
- R. C. Gonzalez, R. E. Woods, S. L. Eddins, Digital image processing using on Education India, 2004.