
Indonesian Music Emotion Recognition Based on Audio with Deep Learning Approach
Volume 6, Issue 2, Page No 716-721, 2021
Author’s Name: Abraham Adiputra Wijaya, Inten Yasminaa), Amalia Zahra
View Affiliations
Computer Science Department, BINUS Graduate Program – Master of Computer Science, Bina Nusantara University, Jakarta, Indonesia 11480
a)Author to whom correspondence should be addressed. E-mail: inten.yasmina@binus.ac.id
Adv. Sci. Technol. Eng. Syst. J. 6(2), 716-721 (2021); ![]() DOI: 10.25046/aj060283
DOI: 10.25046/aj060283
Keywords: Music Emotion Recognition, Indonesian Music, Deep Learning, Convolutional Neural Network, Recurrent Neural Network

Export Citations
Music Emotion Recognition (MER) is a study to recognize emotion in a music or song. MER is still challenging in the music world since recognizing emotion in music is affected by several features; audio is one of them. This paper uses a deep learning approach for MER, specifically Convolutional Neural Network (CNN) and Convolutional Recurrent Neural Network (CRNN) with 361 Indonesian songs as the dataset. The music is classified into three main emotion groups: positive, neutral, and negative. This paper demonstrates that the best model for MER on Indonesian music is CRNN with the accuracy of 58.33%, outperforming that achieved by CNN.
Received: 26 January 2021, Accepted: 10 March 2021, Published Online: 20 March 2021
1. Introduction
Music is one language to express your emotion. By knowing emotion from music, listeners can enjoy music based on their emotional condition. Recognizing emotion from music is also useful for supporting a smart system in the future. One example is for supporting smart cars to help stabilize the driver’s emotions while driving. The driver’s driving condition will be affected by their emotional condition. Positive or negative emotion will affect the risk level, reaction to a particular condition, their action, and driving awareness level [1].
Based on the study in [2], there are 28 emotion variations to indicate human emotion from valence and arousal level. This research focuses on classifying music into three main emotion groups: positive, neutral, and negative. Music Emotion Recognition (MER) has become a new challenging thing in the music world because emotion on a particular song will be conducted by tone, tempo, and lyrics of the song. Deep learning is used to find the best solution for MER. Convolutional Neural Network (CNN) has a great occupation for analyzing audio in MER than using machine learning [3], as well as Convolutional Recurrent Neural Network (CRNN), where it has a great occupation for analyzing audio in MER to classify music into two main emotion groups: positive and negative [4].
A study in [5] found that by using RNN encoding, algorithm can be very intelligent in predicting the emotion inside a music, and even though it cannot explicitly predict the emotion in music, it is useful for selecting music with strong emotion and gives user recommendations. Another experiment conducted by [6] shows that CNN has an advantage on extracting useful features from raw data which would help in emotion recognition. Study conducted by [3] also mentions that CNN is an effective method to predict the emotion of songs using spectrogram. However, there are still things that could be done to improve the model precision. Based on those statements, it was decided to conduct a research in Music Emotion Recognition using CNN and CRNN. Through this research we also found the best parameters to be applied on the CNN and CRNN models that we proposed. We decided to do the experiment specifically on Indonesian music because of a study conducted by [7] found that using data sets from a specific country gives a better performance. It can also help shows the genre trends in that country.
2. Literature Review
This section shows basic knowledge applied to our research, such as emotion model, Music Emotion Recognition (MER) and related works.
2.1. Valence-Arousal Emotion Model
The Valence-Arousal model (V-A model) proposed in this study [2] is mostly used by researchers as an emotion model. Emotion variety introduced in [2] is shown in Figure 1.
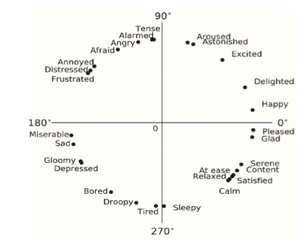 Figure 1: 2D Valance-Arousal Emotion Space [2]
Figure 1 explains two-dimensional space which consists of a horizontal line as a valance and a vertical line as arousal. Valence is the affective quality referring to the intrinsic attractiveness/goodness (positive valance) or awareness/badness (negative valance). Arousal is a state of emotional condition that makes us feel motivated or feel the same as our emotional condition.
2.2. Music Emotion Recognition (MER)
In this digital era, music becomes one of the important things in human life. Following music growth in the digital era, MER becomes interesting in the past few years because music is highly related to mood or someone’s emotion.
There is some multimedia system to recognize or obtain emotional information from music as being developed by Moodtrack, MusicSense, Mood Cloud, Moody, and I.MTV [8]. In the study [8], the authors claimed that a machine or computer that can recognize emotion from music can improve the interaction between computer and human being. With this consideration, developing MER is required so that the computer can automatically recognize or classify music based on emotion in that music. Developing MER has become challenging because MER has a variety of emotion conception and emotion association, thus there is a debate in emotion’s concept category in MER. Table 1 shows multidisciplinary from developing MER.
Table 1: Comparison of Existing Work on MER [7]
| Categorical MER | Categorical | Predict the discrete emotion labels |
| Dimensional MER | Dimensional | Predict the numerical emotion values |
| Music Emotion Variation Detection (MEVD) | Dimensional | Predict the continuous emotion variation |
The categorical MER approach categorizes emotion into several classes and applies to machine learning to train a classifier. Dimensional MER approach defines emotions as numerical values from a particular dimension like valance and arousal [2]. MEVD aims to produce music’s prediction for every short-time segment of songs, and it helps to predict more complex emotions.
2.3. Related Works
This paper refers to several studies in MER using machine learning and deep learning with audio features. One study used Million Song Dataset (MSD) [9] that consists of a timbre segment along with audio features[10]. This research focuses on classifying data using 5-fold cross-validation. Support Vector Machine (SVM), Random Forest (RF), k-Nearest Neighbor (k-NN), Multilayer Perceptron (MLP), Logistic Regression (LR), and Naïve Bayes (NV) are used in [10] and it claimed that LR achieved the highest accuracy of 57.93%. The authors in this study [3] claimed that using Convolutional Neural Network (CNN) achieved better accuracy than machine learning. It contains 30,498 spectrograms from 744 songs. Every song supplied 45-second clips and every single clip was transformed into spectrograms. The study shows us that CNN is a better model than machine learning with 72% accuracy [3]. Another study conducted by the authors in [4] used CNN, RNN, and CRNN to solve the MER problem. 48,476 songs from MSD [9] were used as dataset and every song was transformed into Mel-spectrogram. This research focuses on classifying data into two classes: positive and negative. The study shows that using CRNN is better than CNN and RNN with 66% accuracy, where CNN and RNN achieved the accuracy of 64% and 63%, respectively [4].
The study conducted by [5] uses a fusion of antonyms to describe emotions in the context of MER. It was mentioned that tempo and energy were useful features. By using RNN encoding, the algorithm can be very intelligent in predicting the emotion inside a music, and even though it cannot explicitly predict the emotion in music, it is useful for selecting music with strong emotion and gives user recommendations. The study conducted by [6] proposes a novel method that combines original music spectrogram with CNN to predict the emotion tag. They reported that CNN has an advantage on extracting useful features from raw data which would help in emotion recognition but there should be more research conducted on the meaning of CNN outputs. Another study conducted by [3] proposes a method to classify features extracted from the music’s spectrograms using CNN. The study states that CNN is an effective method to predict the emotion of songs using spectrogram. However, there are still things that could be done to improve the model precision. From the studies aforementioned, the research presented in this paper focuses on using CNN and CRNN for classifying our dataset into three main groups.
3. Proposed Method
This section discusses how data is collected and pre-processed and showcases our proposed method in this research. The illustration of flow diagram on the research methodology could be found in Figure 2.
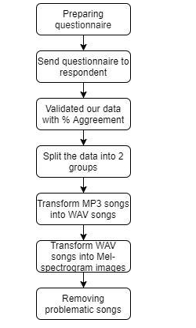 Figure 2: Flow Chart of Research Methodology
3.1. Data Collection & Pre-processing Data
There are 614 non-vocal audios collected from YouTube. The data is Indonesian music covering various genres; the majority of them is pop music. The decision to use music from a certain country is based on the hypothesis that every country has unique style of music. A research in MER conducted using specifically Korean music as experiment’s dataset is able to achieve good accuracy [7]. After collecting the audio, several questions in the form of a questionnaire were distributed to respondents to help label the data into three labels/emotion groups, i.e., positive, neutral, and negative. Positive is the emotion when the music consists of positive energy, like excited, happy, and pleased. Neutral is that when the music consists of neutral energy, like relaxed, calm, and bored. Finally, negative is that when the music consists of negative energy, like sad, frustrated, and angry emotion. For the labelling process, we conducted a survey where we assign five people to assess/label each data sample; this was to ensure that we obtained an objective assessment. After we collected all the responses from the respondents, we validated our data with agreement percentage. We will only be using data that have above 50% of agreement score. For that reason, in our final data set, we will be using 536 non-vocal audios where 180 songs are positive, 226 songs are neutral, and 130 songs are negative.
After validating the data from the questionnaire, the data is split into two groups: full-songs and 45-second-clip songs. Full-song means one complete song whereas 45-second-clip song means that the complete song is divided into 45-second clips. After that, the data is converted into spectrograms. A spectrogram is a visual representation of the spectrum of frequencies of various times. By using a spectrogram, the machine can learn a variety of emotions from the song’s spectrum. There are several types of spectrograms; one of them is Mel-spectrogram. Mel-spectrogram is selected because it has been one of the most widespread features from audio analysis tasks like music auto-tagging and latent feature learning. Mel-scale is supported by domain knowledge of the human auditory system [9] and has been empirically proven by impressive performance gains in various tasks [10]. Our program could only process .wav as the input type for the mel-spectrograms converter. Therefore, before we converted our data into Mel-spectrograms, we need to convert songs from .mp3 into .wav. The following parameters are used to build the Mel-spectrograms: 4096 number of samples per time-step in the spectrogram/hop_length, 128 number of bins in the spectrogram/n_mels (height of the image) and 256 number of time-steps/time_steps (width of the image). These Mel-spectrograms are converted into a 128×256 image with grayscale color. This Mel-spectrogram image is then used as the input data to the CNN and CRNN model.
The final dataset used in this experiment is spectrograms from 361 songs where there are 86 negative, 156 neutral, and 119 positive labels. This final data was obtained after removing problematic songs, which are those with ambiguous labels or those generating spectrograms with missing data. Aside from using the full song in the first experiment, the 45-second clips were used in the second one, which made the latter spectrogram dataset became 3095 songs (767 negative, 1308 neutral, and 1020 positive labels).
3.2. Proposed Framework for MER
This research aims to build and evaluate the system of emotion recognition or classification for Indonesian music. CNN and RNN were used to implement the objective. CNN is one of the Feed Forward Neural Network classes inspired by the brain’s visual cortex. CNN is specifically designed to process grid structure data. CNN based architecture is shown in Figure 3.
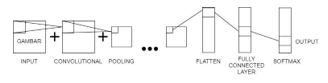 Figure 3: Convolutional Neural Network Architecture
CNN is useful for analyzing image data [11]. Convolutional-2D and Rectified Linear Unit (ReLu) were used as activation functions.
RNN is one of the neural networks that processes the input data for several times. Generally, RNN is used for analyzing sequential data such as Natural Language Processing (NLP) [12], voice recognizing/analyzing [13], etc. Another research claimed that RNN is useful to recognize or predict emotion in music [14]. An RNN-based architecture is shown in Figure 4.
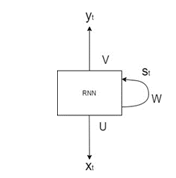 Figure 4: Recurrent Neural Network Architecture
These two deep-learning methods were combined to solve the MER problem described earlier. Convolution-LSTM layer was used as the RNN. CNN-LSTM is a type of recurrent neural network that has a convolutional structure in both the input-to-state and state-to-state transition. Several models were built for comparison purposes, which can be seen in Table 2 and 3.
Table 2: Proposed Model using CNN
| Input (126x258x1) | |
| Convolutional | 16 filters |
| Convolutional | 32 filters |
| Convolutional | 64 filters |
| Convolutional | 112 filters |
| Max-Pooling | 2,2 pool size |
| Flatten | |
| Dense | 128 filters |
| Dense | 128 filters |
| Dense | 3 filters |
A 3x32x3 kernel was used for the CNN layers in the first model. Four layers of CNN and three layers of Fully Connected layer were used in this model, then Re-Lu was applied to the CNN and the dense layers activation. The output layer used SoftMax activation. Adam and Categorical Cross Entropy were used as the optimizer and the entropy for the loss function in this model, respectively. For comparison purposes, CRNN model was also built (Table 3).
Table 3: Proposed Model using CRNN
| Input (126x258x1) | ||
| Convolutional | 16 filters | |
| Convolutional-LSTM | 30 filters | |
| Convolutional | 36 filters | |
| Convolutional-LSTM | 50 filters | |
| Flatten | ||
| Dense | 128 filters | |
| Dense | 128 filters | |
| Dense | 3 filters | |
A 2×3 kernel was used for the CNN and CNN-LSTM layers in this model. Re-Lu was also applied to the CNN, the CNN-LSTM and the dense layers activation. This model used SoftMax as output layer activation. Adam optimizer and Categorical Cross entropy loss function were also used in this model.
4. Result and Discussion
As described earlier, there are 361 songs consisting of 86 negative, 156 neutral, and 119 positive labels as the input dataset to the proposed methods. From 361 spectrogram’s images, 80% was used as the training dataset, 10% as the validation dataset, and 10% as the test dataset. We split the data using the algorithm provided by ImageDataGenerator that is available on Keras, a function named validation split. Before we apply the function, we first calculate the weight of each data manually, comparing the labels on each data sets. Then we combine the training and validation dataset into one folder to be split using the function mentioned. The testing dataset are saved in a separate folder. The experiment was split into two datasets: full-song dataset containing 361 spectrograms and 45-second-clip dataset containing 3095 spectrograms.
4.1. Full-songs Experiment
In this section, the complete version of the music was used, which was the full track. The testing performance of MER using the two proposed models, CNN and CRNN, are presented in Table 4.
Table 4: Summary of Test Result Using Full-Songs Dataset
| Model | Training Accuracy | Validity Accuracy | Test Accuracy |
| CNN | 55.33% | 44.12% | 41.66% |
| CRNN | 75.95% | 52.94% | 58.33% |
From the performance summary shown in Table 4, it can be concluded that the CRNN model outperforms the CNN one for all the training, validity, and test accuracies.
4.2. 45-second-clip Experiment
45-second clip songs were also used in the experiment because 45 seconds are considerably long enough for humans to recognize what emotion appears in a song [3]. Similar to the full-song experiment, CNN and CRNN were also developed to investigate the MER performances. The results are shown in Table 5.
Table 5: Summary of Test Results Using 45-Second-Clip Songs Dataset
| Model | Training Accuracy | Validity Accuracy | Test Accuracy |
| CNN | 43.14% | 43.18% | 38% |
| CRNN | 52.46% | 47.73% | 38% |
4.3. Discussion
We process our data by using the algorithm stated in Algorithm 1.
| Algorithm 1: Audio time-series/y parameters | ||||||
| Result: Audio time-series/y parameters | ||||||
| for data in datas | ||||||
| Load audio from audio’s path; | ||||||
| Define y using librosa library (librosa.load(audio path)); | ||||||
| Define start_sample with zero/0; | ||||||
| Define length-sample with time_steps*hop_length; | ||||||
| Define array of window; | ||||||
| for start_sample in start_sample + length_sample | ||||||
| Add window with y[start_sample]; | ||||||
| start_sample + 1 | ||||||
| End | ||||||
| End | ||||||
| return array of window | ||||||
In Algorithm 1 we capture the array from each song. The more data we capture, the more feature that could be extracted from the audio. This is the results of the multiplication of time_steps and hop_length. The higher the number, the more features that it could cover. With that logic intact we may assume by using a 45-second clip, which is shorter, it could generate better results, because it will cover the whole feature by the spectrogram. With more results obtained by using Algorithm 1, the more sensitive the spectrogram becomes in capturing the feature in the audio that we use. In other words, using the optimal time_step and hop_length could result in a more complete data, and a quick pre-processing time.
However, the results obtained indicate that the full song model performs better than the shorter clip one. We found that the reason is because our assumption for the shorter clip may only work if we wanted to focus on a specific point of the song, where in this case we wanted to know the overall emotion or as we may say the full audio. When using the 45-second clip, the machine could not capture the whole essence of the song, only focusing on that specific part instead. In this case the machine faced the case of ambiguity because within one song there may be a part where it shows a positive emotion but followed with neutral or even negative emotion. If we wanted to use the 45-second model, we might have to add a more complex algorithm to the machine to determine the song emotion. In this case, we could say that it is better to use the full song clip for music emotion recognition where the model would see the major points instead of only a specific point.
While conducting our experiment we also found that when we are using a lot of convolutional layers, the machine tends to generalize most clips with a neutral label and stop learning, also known as overfitting. When we use more than five convolutional layers, a large filter, or less than five layers but with an even greater filter, feature machine tend to decline and stop learning. In this case, we must create a balanced architecture using Table 2. This is not limited to a convolutional layer model, but also in convolutional recurrent neural network that is greater than 3 recurrent layers and 2 convolutional layers. Overfitting will be more likely to happen when there are too many convolutional recurrent layers. This results in the case where the machine tends to generalize the audio with a neutral label. We have tried using dropout layer to overcome overfitting, but the use of dropout layer does not give a significant difference. The difference in kernel size and amount of parameter filter are the one that helps overcome overfitting. Another reason that we found could be because neutral-emotion audios were the dominant label in this experiment. The machine absorbs more information from neutral-emotion datasets. Neutral emotion, in a way, is a bridge between the positive and negative emotion datasets.
5. Conclusion and Future Works
In this work, music emotion recognition using spectrograms with Convolutional Neural Network (CNN) and Convolutional Recurrent Neural Network (CRNN) has been proposed. The data that we use are songs from Indonesia. The spectrograms used 256 time_steps, 128 n-mels, and 4096 hop_length parameters. Two types of experiments have been conducted: one using full-songs and one using 45-second-clip songs. From those experiments, CNN achieved the test accuracy of 41.66% and 38% using full-songs and 45-second-clip songs dataset, respectively; while CRNN achieved the test accuracy of 58.33% and 38% using the same two types of datasets, respectively.
From this experiment, it can be concluded that using a full-song dataset achieves better MER accuracy than using 45-second-clip dataset. However, more experiments need to be conducted to confirm such a finding, such as adding a more complex algorithm to support the 45-second dataset thus the machine could become more precise in predicting the emotion while still maintaining the objectivity of the whole audio instead of only focusing on one part. More data also need to be collected for future works to achieve higher accuracy and use more labelled category or classification. We guess that it is probably due to the ambiguity in one label or ambiguity from this experiment. Thus, we think it will be more accurate if we use more labels for our future works. To fix overfitting we plan to use an ensemble method in our future research. Moreover, it would be interesting to include the songs’ lyrics as additional features to develop a multimodal music emotion recognition system.
Conflicts of Interest
The authors declare no conflict of interest.
Acknowledgement
The author would like to thank everyone who helped with this research, and Bina Nusantara University for supporting the author in completing this paper.
- C. Pêcher, C. Lemercier, J.M. Cellier, “The influence of emotions on driving behavior,” Traffic Psychology: An International Perspective, (January), 145–158, 2011.
- J.A. Russell, “A circumplex model of affect,” Journal of Personality and Social Psychology, 39(6), 1161–1178, 1980, doi:10.1037/h0077714.
- T. Liu, L. Han, L. Ma, D. Guo, “Audio-based deep music emotion recognition,” AIP Conference Proceedings, 1967(May 2018), 2018, doi:10.1063/1.5039095.
- A. Bhattacharya, K. V. Kadambari, “A Multimodal Approach towards Emotion Recognition of Music using Audio and Lyrical Content,” 2018.
- H. Liu, Y. Fang, Q. Huang, “Music Emotion Recognition Using a Variant of Recurrent Neural Network,” 164(Mmssa 2018), 15–18, 2019, doi:10.2991/mmssa-18.2019.4.
- X. Liu, Q. Chen, X. Wu, Y. Liu, Y. Liu, “CNN based music emotion classification,” 2017.
- B. Jeo, C. Kim, A. Kim, D. Kim, J. Park, J.-W. Ha, “Music Emotion Recognition via End-to-End Multimodal Neural Networks,” ICASSP, IEEE International Conference on Acoustics, Speech and Signal Processing – Proceedings, 2, 2017.
- Y.H. Yang, H.H. Chen, “Machine recognition of music emotion: A review,” ACM Transactions on Intelligent Systems and Technology, 3(3), 2012, doi:10.1145/2168752.2168754.
- T. Bertin-Mahieux, D.P.W. Ellis, B. Whitman, P. Lamere, “The million song dataset,” Proceedings of the 12th International Society for Music Information Retrieval Conference, ISMIR 2011, (Ismir), 591–596, 2011.
- R. Akella, T.S. Moh, “Mood classification with lyrics and convnets,” Proceedings – 18th IEEE International Conference on Machine Learning and Applications, ICMLA 2019, 511–514, 2019, doi:10.1109/ICMLA.2019.00095.
- Y. Lecun, Y. Bengio, “Convolutional Networks for Images , Speech , and Time Series Variable-Size Convolutional Networks: SDNNs,” Processing, 2010, doi:10.1109/IJCNN.2004.1381049.
- A. Hassan, “SENTIMENT ANALYSIS WITH RECURRENT NEURAL NETWORK AND UNSUPERVISED Ph . D . Candidate: Abdalraouf Hassan , Advisor: Ausif Mahmood Dep of Computer Science and Engineering , University of Bridgeport , CT , 06604 , USA,” (March), 2–4, 2017.
- A. Amberkar, P. Awasarmol, G. Deshmukh, P. Dave, “Speech Recognition using Recurrent Neural Networks,” Proceedings of the 2018 International Conference on Current Trends towards Converging Technologies, ICCTCT 2018, (June), 1–4, 2018, doi:10.1109/ICCTCT.2018.8551185.
- M. Xu, X. Li, H. Xianyu, J. Tian, F. Meng, W. Chen, “Multi-scale Approaches to the MediaEval 2015 “ Emotion in Music ” Task,” 5–7, 2015.