
Comparative Analysis of Land Use/Land Cover Change and Watershed Urbanization in the Lakeside Counties of the Kenyan Lake Victoria Basin Using Remote Sensing and GIS Techniques
Volume 6, Issue 2, Page No 671-688, 2021
Author’s Name: Dancan Otieno Onyango1,a), Christopher Ogolo Ikporukpo2, John Olalekan Taiwo2, Stephen Balaka Opiyo3, Kevin Okoth Otieno4
View Affiliations
1Pan African University, Life and Earth Sciences Institute (PAULESI), University of Ibadan, Ibadan, Oyo State, 211101, Nigeria
2Department of Geography, University of Ibadan, Oyo State, 211101, Nigeria
3Department of Environment and Natural Resources, Faculty of Agriculture and Natural Resources Management, Kisii University, Kisii, 408 – 40200, Kenya
4Ministry of Lands, Housing, Urban Areas and Physical Planning, County Government of Kakamega, Kakamega, 50100, Kenya
a)Author to whom correspondence should be addressed. E-mail: dancanthomas@gmail.com
Adv. Sci. Technol. Eng. Syst. J. 6(2), 671-688 (2021); ![]() DOI: 10.25046/aj060278
DOI: 10.25046/aj060278
Keywords: Land use/land cover change (LULC), Remote sensing, Riparian counties, Lake Victoria basin, Conservation planning

Export Citations
The ecosystems and landscape patterns in Lake Victoria basin are increasingly being modified by changes in land use/land cover. Understanding dynamics of these changes is essential for appropriate planning. This study evaluated changes in landscape environment, of the lakeside counties of the Kenyan Lake Victoria basin, which have occurred over a forty-year period (1978-2018) and their potential impacts on the lake using remote sensing and GIS techniques. Landsat imageries of 1978, 1988, 1998, 2008 and 2018 were analyzed for each county to develop land use and land cover maps and to detect and quantify changes using the Maximum Likelihood algorithm. Supervised classification was utilized. The study showed that the six land use/land cover classes, identified in the counties, have undergone drastic modifications in a span of four decades. Over the years, built-up areas steadily increased in all the counties, forested and vegetated areas steadily declined in all the counties, areas under water bodies remained relatively constant in all counties, while the rest of the land use and land cover types experienced periodic rise and falls in areal coverage. Generally, the major gains in coverage by the various land use and land cover types occurred between 2008 and 2018 while major losses occurred between 1978 and 1988. The study suggests that future regional conservation measures should take cognisance of the general ecological and socio-political processes in the entire Lake Victoria basin for integrated watershed conservation.
Received: 24 January 2021, Accepted: 13 March 2021, Published Online: 20 March 2021
1. Introduction
Land use and land cover are often used together to describe the terrestrial settings relative to both anthropogenic and natural processes [1-3]. Land use and land cover change has increased on local and global scales over the past few years [4-6]. This is driven by a synergistic effect from biophysical, political and socio-economic factors [7, 8]. Studies have shown that, it is the complex interactions of these factors, coupled with population pressure and technological advancements, which results in land use and land cover change [1, 6, 9]. This implies that interactions between human and natural factors are the root causes of land use and land cover changes on the earth’s surface.
Land use and land cover has been transforming from the time humankind started manipulating their surroundings [10]. The changes in land use and land cover impact both the biotic and abiotic components of the ecosystems of the earth [11]. The patterns of natural catastrophes, climate and socio-economic livelihoods are negatively impacted by land use and land cover modifications at both local and global levels [12]. Moreover, studies have indicated changes in land use and land cover to be the major cause of widespread species extinction, replacements as well as biotic differentiation or homogenization [13, 14]. There is a growing interest, since the last decade, on the effects of land use and land cover change globally [15]. Traditionally, land use and land cover has been a critical research area locally and globally [16, 17]. This is driven by the need to understand landscape patterns and how they are influenced by interactions with natural processes and anthropogenic activities. Such understanding is necessary for improvement of decision-making and management of land [18].
Remote sensing has been a major source of data for the historical land use and land cover conversion. It utilizes various techniques and datasets to produce land cover change analysis, an evaluation of the various classes and their accompanying changes over time [19]. Remote sensing is capable of revealing the nature, magnitude and spatial trends of land use and land cover changes, which is vital for monitoring urban development and natural resources for their effective management [1]. A large volume of literature suggests that remote sensing using Landsat imageries have greatly aided the large-scale classification of various landscape components in screening for land use land cover problems [20].
Land use problems are widespread in both developing and developed world [21]. In the developed world, Mediterranean biodiversity loss from land-use/land-cover change, associated with increased cultivated areas, has been reported in Italy [22] while forest drying is reportedly common in Ukraine and Latvia countries [23]. In Southern and South East Asia, widespread air quality issues due to rapid industrialization, urbanization and increased energy demand has been reported [24]. It is also worth noting that substantial quantities of greenhouse gas emissions, due to intensification of agricultural activities, has been recorded in Eastern European nations including Slovakia [21]. In US cities, increased non-point-source pollution from various degrees of urbanization has been reported [25]. In the developing world, dwindling biological resources diversity in rural areas of Ethiopia and Eritrea, which are experiencing overgrazing and encroachment by farms has been mapped [26]; widespread desertification and land degradation has been reported in Benin [27] while major changes in land use and cover have caused environmental problems in catchment areas in Tanzania, including drying of streams and rivers [28].
Kenya, like many African countries whose economy is heavily dependent on agricultural production and exploitation of natural resources such as forests, is facing land use and land cover change challenge [29]. The lake region of Kenya encompasses five counties of Migori, Busia, Homabay, Kisumu and Siaya. This region has the Lake Victoria watershed which contains numerous wetland resources that sustain the livelihoods for the surrounding communities [30]. Wetlands of Lake Victoria account for 37% of total land surface in Kenya [31]. Studies have shown that the hydrology of Lake Victoria itself and the numerous wetlands within its basin, including rivers, have been altered by the changes in land use and land cover within the lake region [32,33]. With the current trends in climate change, the impacts of land use and land cover change are poised to put more strain not only on the ecological resources found in the basin but also the socio-economic conditions of the riparian communities. The quantity and dynamics of these land use and land cover changes within the whole Lake Victoria basin area are still currently not well understood because none of the limited studies that exists has valuated the entire lakeside region. Mapping and quantifying the land use land cover changes and assessing its effects in the whole lakeside region will make great contribution in providing information for effective policy and regulatory changes in land use and environment planning and management.
This study mapped the changes in land use and land cover that have occurred in the five counties of the lake region overtime. These counties were chosen because of their proximity to the Kenyan portion of Lake Victoria and changes in the environment within these counties will not only have an effect on the riparian communities, but also on the lake itself. The Lake is the greatest natural resource in East Africa supporting millions of people [30]. The adoption of the devolved system in Kenya through the new constitutional dispensation promulgated in 2010, has resulted in rapid population growth, urbanization and socio-economic activities in the five Kenyan lake-side counties over the years. This has brought about changes in the land use and land cover in this important region. The main objective of the present study is to evaluate changes in the landscape environment of the riparian counties that have occurred over forty-year period (1978-2018) and their potential impacts on the Lake Victoria basin environment using remote sensing and GIS techniques.
2. Materials and Methods
2.1. Study Area Description
Occurring along the equatorial region, Lake Victoria is situated between latitudes 0°20´N–3°S and longitudes 31°39´E–34°53´W [34], at an elevation of 1134m above sea level [30]. The lake surface (water) spans an area of 68,000 Km2 which is shared among three countries of East Africa – Tanzania (49%), Uganda (45%) and Kenya (6%). Lake Victoria is the most critical natural resource in the region, supporting about 30 million livelihoods within its basin [29]. The basin is a unique resource to the East African Community because it provides water, fisheries, wildlife, natural forests as well as tourism and transport services [35]. Moreover, holding an estimated water volume of 2750 Km3, the lake is the second largest freshwater lake in the entire world [30]. Lake Victoria has both inlets in form of major rivers such as Sondu Miriu, Yala, Awach and Nzoia, among others, and outlet in the form of the White Nile River, which outflows northwards from Uganda to Egypt. The region experiences a mean annual rainfall of between 900 mm and 2600 mm, making precipitation the main source of water for the Lake Victoria.
The Kenyan region of Lake Victoria basin, which is the subject of this study, covers about 22% of the 195,000 Km2 total basin area. This lies in the western parts of Kenya – Nyanza and parts of Rift Valley and Western Province. In the immediate border of the lake are five administrative counties namely, Homabay, Migori, Kisumu, Siaya and Busia (Figure 1). The counties are new regional units of administration, experiencing different levels of population growth, urbanization and socio-economic activities as more development resources are devolved to them. This is likely to exacerbate land use and land cover changes with negative environmental implications. This study is based on comparing the possible land use and land cover changes among the lakeside counties (hereafter referred to as Kenyan Lake Victoria Basin, KLVB) and their implications on the basin environment.
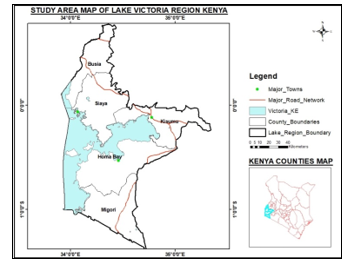 Figure 1: The Kenyan Lake Victoria Basin (KLVB)
2.2. Methodology
Data Sources and Data Acquisition Methods
A combination of remote sensing and GIS techniques were employed in analyzing and comparing LULC changes during the 1978–2018 periods. The study used data sets obtained from Landsat images acquired for the dry month (January) for the years 1978 (Landsat 3 Multispectral Scanner); 1988 (Landsat 4, 5 Thematic Mapper, TM); 1998 (Landsat 4, 5 Thematic Mapper, TM); 2008 (Landsat 4, 5 Thematic Mapper, TM) and 2018 (Operational Land Satellite – Thematic Infrared Sensor) from the United States Geological Survey (USGS) website www.earthexplorer.usgs.gov. The properties of these imageries are presented in Table 1. All the imageries were acquired for the dry month of January because the absence of both cloud cover and moisture content are necessary for minimal reflectance.
Data Pre-processing
To enhance visualization and interpretability, the acquired Landsat imageries were systematically pre-processing through ERDAS Imagine 2015 Version. The images were extracted in compressed formats to obtain separate bands. The first step involved compositing images for each county to bring out the true colour image of the scene. Pan sharpening was then carried out and this involved using panchromatic bands to enhance the spatial resolution of panchromatic images from 30m to 15m. In order to reduce the effects of haze captured on the Landsat images, haze reduction was carried out as the major radiometric correction. Mosaicking was necessarily required because of the large study areas and therefore three separate images were utilized (Kisumu, Migori and Homa Bay counties occupied two images while Busia and Siaya counties occupied one single image). These three separate images were mosaicked into one single image covering the whole area for the ease of processing. Finally, sub-setting process was done using the shapefiles of the counties Kisumu, Siaya, Busia, Homa Bay and Migori. The shapefiles were used to subset from the main image the images of interest for respective counties.
Data Processing and Analysis
The 2015 version of ERDAS Imagine and ArcGIS 10.5 software were used in the data processing. ERDAS Imagine was employed in carrying out supervised classification through the Maximum Likelihood algorithm [36] to obtain the land use and land cover classes. The supervised classification process through the Maximum Likelihood algorithm is essentially controlled by the analyst who specifically selects the pixels that are representative of the desired LULC classes. In the classification process for this study, the LULC classes of interest were defined as water bodies, forest cover, grasslands & vegetation, agricultural land and built-up areas. Six (6) ground-truth polygons, each representing the six LULC classes, were then randomly selected and digitized based on aerial photographs and visual analysis of geographical locations on Google Earth maps. Each training sample polygon used in classification process contained 17 pixels, bringing the total training sample to 100 pixels. The training sample polygons which were found with unwanted pixels were thrown out and replaced with the new ones with wanted spectral signatures. After training the image using signature editor, the Maximum Likelihood algorithm was run a couple of times to obtain the defined classes in the image. Since the images were of medium resolution, Pixel based classification was employed. The final Land use and Land cover maps with appropriate cartographic properties for the years 1978, 1988, 1998, 2008 and 2018 were produced using the ArcGIS software for the respective counties. This entire process led to the identification of six land use and land cover categories.
Post-processing
Accuracy assessment is a post processing procedure of remote sensing which compares the information from the classified land use and land cover maps with the information from ground reference points. This process is essential for assessing the quality of data acquired from Landsat imagery [37]. Based on this premise, accuracy confusion matrixes were computed for the classified images having the different land use and land cover classes. A confusion matrix is appropriate for authenticating classified satellite imageries [38]. The confusion matrix, also known as error matrix, analyzes the statistical components of producer’s accuracy, user’s accuracy, overall accuracy, kappa statistics and overall kappa co-efficient [39]. These statistical elements were produced for all the LULC images of respective riparian counties. This study utilized 100 random reference points which were subsequently ground truth to validate the actual land use/land cover type. The location of the ground random reference points were identified on the medium-resolution images and their class values specified to ascertain the accuracy of a pixel. Using the recommended formulas [40], the accuracy reports were calculated for each of the LULC classes in each of the images, containing the values for producer accuracy, user accuracy, overall accuracy and Kappa coefficient. Finally, a confusion (error) matrix report was computed for all of the LULC maps used.
Change detection analysis was subsequently used to evaluate the areal coverage of the different LULC classes for each map. This was done by considering the pixel count against the total area of the basin. The information obtained was expressed in percentage coverage and square kilometres for each of study years (1978, 1988, 1998, 2008 and 2018) for the five riparian counties. Net changes in areal coverage were then analysed for respective LULC classes in order to unravel specific changes of the landscape environment. A comparison was then made on the degree of LULC changes among the five lakeside counties of the Lake Victoria basin and their implications for the larger basin environment analyzed.
3. Results and Discussion
3.1. Distribution Pattern and Trends of LULC Categories
The study identified six LULC classes in the riparian counties Busia (Figure 2), Siaya (Figure 3), Migori (Figure 3), Homabay (5a & 5b) and Kisumu (6a & 6b). All the counties were found to be characterized by agricultural land (includes surface areas dedicated to the cultivation of crops, vegetables and fruits); water bodies (includes areas under rivers, lakes, swamps and wetlands); grasslands & vegetation (includes areas covered by grasses, shrubs and bushes); bare land (includes exposed rocky or soil surfaces lacking any vegetation cover); forests (includes areas under naturally occurring or planted indigenous and exotic trees) and built-up areas (includes areas under residential, commercial, industrial and infrastructural establishments). The results confirmed findings from previous study which had shown similar land use land cover categories on the Ugandan basin of Lake Victoria [41]. The spatial-temporal coverages of these LULC classes are presented in Tables 2-6. From the tables, the results indicate that in terms of total surface area, Homabay County is the largest with 4759.57 km2, followed by Siaya County (3706.88 km2), Migori County (3166.12 km2), Kisumu County (2680.32 km2) and finally Busia County (1819.40 km2).
3.2. Relative Spatial-Temporal Change in LULC
Agricultural Land
In 1978, agricultural land coverage (2850.68 km2) in Homabay County was higher than in Migori, Siaya, Kisumu and Busia. Similar trend in agricultural land coverage was observed in 2018. Generally, all counties recorded slight net losses in agricultural land coverage from 1978 to 2018 (Figure 7). However, decade-by-decade analysis shows that both positive and negative growth patterns were realized in the coverage of agricultural land during the period between 1978 and 2018 (Figure 7). From 1978–1988, agricultural land decreased in the counties of Busia, Migori, Kisumu and Siaya by 10.71%, 6.62%, 1.14% and 1.03% respectively, while it increased in Homabay County by 1.25% (Figure 7). Between 1988 and 1998, agricultural land expanded in Busia, Migori, Homabay and Siaya by 25.64%, 3.71%, 1.99% and 1.83% respectively, with only Kisumu County declining by 2.48% (Figure 7). The next decade (1998-2008) was characterized by net losses in agricultural land in the counties of Busia (9.49%) and Homabay (9.90%) while the other counties of Kisumu, Migori and Siaya recorded net gains of 3.10%, 2.68% and 2.16%, respectively. For the last decade (2008-2018), agricultural land portrayed a similar trend to the period of 1978-1998 when it decreased in the counties of Busia (-2.56%), Migori (-4.28%), Kisumu (-6.09%) and Siaya (-10.05%), and increased only in Homabay county (4.65%) (Figure 7).
Table 1: Properties of Landsat imageries used
| YEAR | Sensor | Path / Row | Acquisition Date | Resolution (m) | Cloud cover (%) | Season | Source |
| 1978 | Land sat 3 MSS | 170/60 | Jan, 1978 | 30 | 0 | Dry | USGS |
| 1988 | Land sat 4,5 TM | 170/60 | Jan, 1988 | 30 | 1 | Dry | USGS |
| 1998 | Land sat 4,5 TM | 170/60 | Jan, 1998 | 30 | 1 | Dry | USGS |
| 2008 | Land sat 4,5 TM | 170/60 | Jan, 2008 | 30 | 0 | Dry | USGS |
| 2018 | Land sat 8 OLI-TIRS | 170/60 | Jan, 2018 | 30 | 0 | Dry | USGS |
Table 2: LULC statistics of Busia County between 1978 and 2018
| Class Name | 1978 | 1988 | 1998 | 2008 | 2018 | |||||
| Area (km2) | % Cover | Area (km2) | % Cover | Area (km2) | % Cover | Area (km2) | % Cover | Area (km2) | % Cover | |
| Agricultural Land | 1354.41 | 74.44 | 1209.39 | 75.95 | 1519.43 | 78.10 | 1375.26 | 75.60 | 1340.06 | 73.65 |
| Water Bodies | 141.53 | 7.78 | 139.17 | 8.74 | 141.14 | 7.77 | 144.27 | 7.93 | 143.26 | 7.87 |
| Grasslands & Vegetation | 37.77 | 2.08 | 86.85 | 5.45 | 52.45 | 2.89 | 91.84 | 5.05 | 153.99 | 8.46 |
| Bare Land | 49.91 | 2.7 | 29.13 | 1.83 | 21.43 | 1.18 | 19.13 | 1.05 | 68.08 | 3.74 |
| Forests | 215.26 | 11.83 | 105.27 | 6.61 | 155.32 | 8.55 | 156.38 | 8.60 | 70.36 | 3.87 |
| Built-up Areas | 20.52 | 1.13 | 22.59 | 1.42 | 27.57 | 1.52 | 32.24 | 1.77 | 43.65 | 2.40 |
| Total | 1819.40 | 100 | 1819.40 | 100 | 1819.40 | 100 | 1819.40 | 100 | 1819.40 | 100 |
Table 3: LULC statistics of Siaya County between 1978 and 2018
| Class Name | 1978 | 1988 | 1998 | 2008 | 2018 | |||||
| Area (km2) | % Cover | Area (km2) | % Cover | Area (km2) | % Cover | Area (km2) | % Cover | Area (km2) | % Cover | |
| Agricultural Land | 2228.65 | 60.12 | 2205.67 | 62.43 | 2246.12 | 63.93 | 2294.74 | 65.35 | 2064.13 | 61.75 |
| Water Bodies | 993.15 | 26.79 | 992.32 | 28.07 | 991.05 | 28.21 | 982.39 | 27.98 | 992.75 | 29.70 |
| Grasslands & Vegetation | 90.62 | 2.44 | 66.19 | 1.87 | 50.25 | 1.43 | 12.81 | 0.36 | 19.08 | 0.57 |
| Bare Land | 214.72 | 5.79 | 50.06 | 1.42 | 28.53 | 1.14 | 14.39 | 0.41 | 23.32 | 0.70 |
| Forests | 124.96 | 3.37 | 152.71 | 4.32 | 124.69 | 3.55 | 114.41 | 3.26 | 143.43 | 4.29 |
| Built-up Areas | 54.78 | 1.48 | 66.19 | 1.87 | 72.99 | 2.08 | 92.68 | 2.64 | 100.12 | 3.00 |
| Total | 3706.88 | 100 | 3706.88 | 100 | 3706.88 | 100 | 3706.88 | 100 | 3706.88 | 100 |
Table 4: LULC statistics of Migori County between 1978 and 2018
| Class Name | 1978 | 1988 | 1998 | 2008 | 2018 | |||||
| Area (km2) | % Cover | Area (km2) | % Cover | Area (km2) | % Cover | Area (km2) | % Cover | Area (km2) | % Cover | |
| Agricultural Land | 2429.27 | 76.73 | 2268.45 | 71.58 | 2352.61 | 74.26 | 2415.76 | 76.30 | 2309.88 | 72.91 |
| Water Bodies | 547.16 | 17.28 | 628.36 | 19.83 | 550.32 | 17.37 | 542.00 | 17.12 | 545.7 | 17.22 |
| Grasslands & Vegetation | 115.31 | 3.64 | 109.97 | 3.47 | 17661 | 5.57 | 136.45 | 4.31 | 175.95 | 5.55 |
| Bare Land | 23.67 | 0.75 | 104.40 | 3.29 | 21.95 | 0.69 | 6.06 | 0.19 | 45.15 | 1.43 |
| Forests | 29.70 | 0.94 | 8.63 | 0.27 | 15.80 | 0.5 | 8.16 | 0.26 | 16.64 | 0.53 |
| Built-up Areas | 21.03 | 0.66 | 49.11 | 1.55 | 50.96 | 1.61 | 57.70 | 1.82 | 74.94 | 2.37 |
| Total | 3166.12 | 100 | 3166.12 | 100 | 3166.12 | 100 | 3166.12 | 100 | 3166.12 | 100 |
Table 5: LULC statistics of Homabay County between 1978 and 2018
| Class Name | 1978 | 1988 | 1998 | 2008 | 2018 | |||||
| Area (km2) | % Cover | Area (km2) | % Cover | Area (km2) | % Cover | Area (km2) | % Cover | Area (km2) | % Cover | |
| Agricultural Land | 2850.68
|
59.89 | 2886.31
|
60.64 | 2943.82
|
60.98 | 2652.40
|
55.76 | 2775.77
|
58.35 |
| Water Bodies | 1617.76 | 34.00 | 1617.72 | 34.00 | 1617.04 | 33.50 | 1618.30 | 34.02 | 1613.12 | 33.91 |
| Grasslands & Vegetation | 95.99 | 2.07 | 127.22 | 2.67 | 92.25 | 1.91 | 289.65 | 6.09 | 141.44 | 2.97 |
| Bare Land | 98.40 | 2.07 | 31.36 | 0.66 | 49.96 | 1.03 | 54.53 | 1.15 | 66.80 | 1.40 |
| Forests | 68.68 | 1.44 | 29.89 | 0.63 | 38.25 | 0.79 | 28.28 | 0.59 | 27.98 | 0.59 |
| Built-up Areas | 28.07 | 0.59 | 67.07 | 1.41 | 86.08 | 1.78 | 113.78 | 2.39 | 131.83 | 2.77 |
| Total | 4759.57 | 100 | 4759.57 | 100 | 4759.57 | 100 | 4759.57 | 100 | 4759.57 | 100 |
Table 6: LULC statistics of Kisumu County between 1978 and 2018
| Class Name | 1978 | 1988 | 1998 | 2008 | 2018 | |||||
| Area (km2) | % Cover | Area (km2) | % Cover | Area (km2) | % Cover | Area (km2) | % Cover | Area (km2) | % Cover | |
| Agricultural Land | 1932.78
|
72.11 | 1910.84
|
71.09 | 1863.41
|
69.59 | 1921.26
|
71.70 | 1804.25
|
67.38 |
| Water Bodies | 579.04 | 21.60 | 582.28 | 21.66 | 568.49 | 21.23 | 577.89 | 21.57 | 567.67 | 21.20 |
| Grasslands & Vegetation | 64.21 | 2.40 | 94.25 | 3.51 | 117.35 | 4.38 | 47.08 | 1.76 | 136.09 | 5.08 |
| Bare Land | 37.02 | 1.38 | 8.65 | 0.32 | 23.72 | 0.86 | 48.48 | 1.81 | 52.12 | 1.95 |
| Forests | 32.76 | 1.22 | 45.08 | 1.68 | 38.54 | 38.54 | 15.92 | 0.59 | 42.21 | 1.58 |
| Built-up Areas | 34.51 | 1.29 | 46.73 | 1.74 | 66.16 | 2.47 | 69.04 | 2.58 | 75.56 | 2.82 |
| Total | 2680.32 | 100 | 2680.32 | 100 | 2680.32 | 100 | 2680.32 | 100 | 2680.32 | 100 |
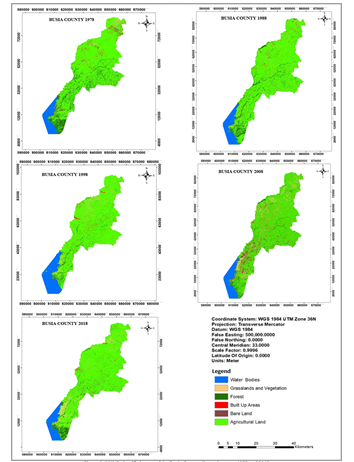 Figure 2: LULC classified maps of the Busia County, Kenya between 1978 and 2018
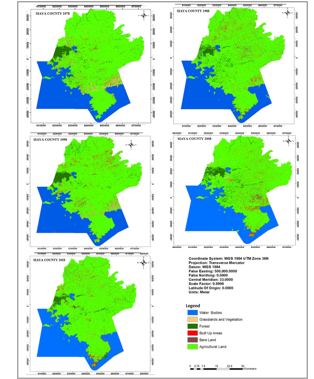 Figure 3: LULC classified maps of the Siaya County, Kenya between 1978 and 2018
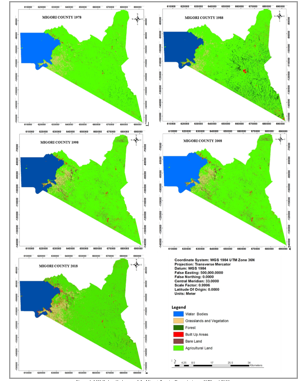 Figure 4: LULC classified maps of the Migori County, Kenya between 1978 and 2018
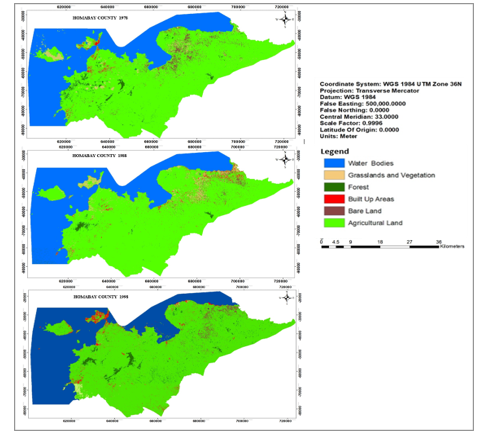 Figure 5: (a) LULC classified maps for Homabay County, 1978-1998
Communities on the lakeside counties depend majorly on fishing in Lake Victoria and farming within the basin for their livelihoods [42]. The poverty level of the riparian communities has been estimated at about 66% [43]. The variations in agricultural land uses could be attributed to the problems of land degradation which could sometimes make the farmers abandon some agricultural farms which had become infertile over time due to intense cultivation [44]. Erosion caused by heavy surface run-off most especially in agricultural land is responsible for rampant soil infertility in cultivated areas [44]. The decreasing agricultural land coverage could also be attributed to the gradual shifting of households from farming to fishing and fishing related activities most especially when the rain-fed agricultural production becomes marginal and unpredictable [45,46]. In the 1980s, the riparian communities of Lake Victoria would pay greater attention to fishing during the Nile perch “boom” hence neglecting farming altogether [45]. Further, the inverse relationship between farming and fishing in Lake Victoria basin had been established whereby an increase of one result into a decrease in the other [45]. The abandoned farmlands would be later converted to built-up areas (when structures are constructed on them), bare land (when they are used for grazing purposes) or grasslands (when they are left fallow for a long time). These incidences have been widespread because according to [45], the then Nyanza province has never been a particularly agricultural productive region.
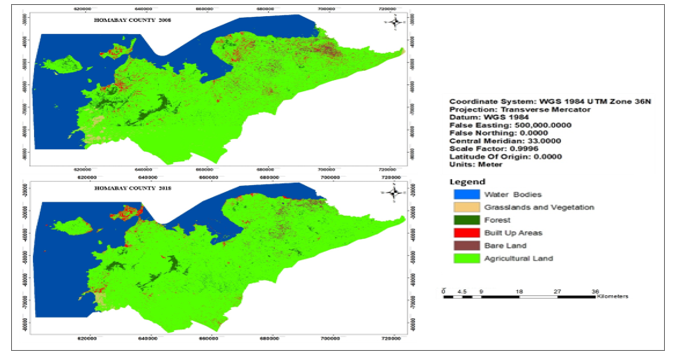 Figure 6: (b) LULC classified maps for Homabay County, 2008-2018
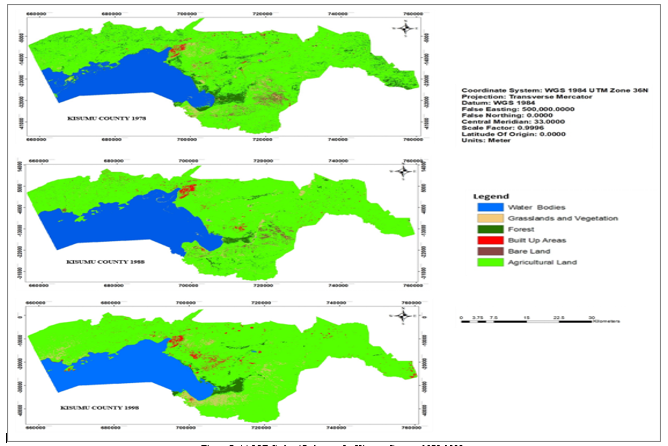 Figure 7: (a) LULC classified maps for Kisumu County, 1978-1998
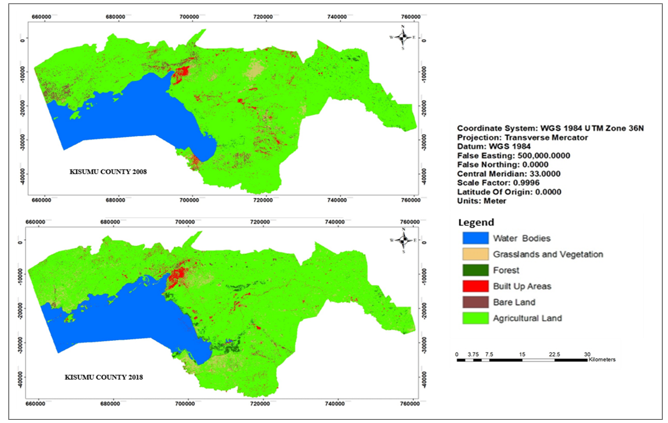 Figure 8: (b) LULC classified maps for Kisumu County, 1978-1998
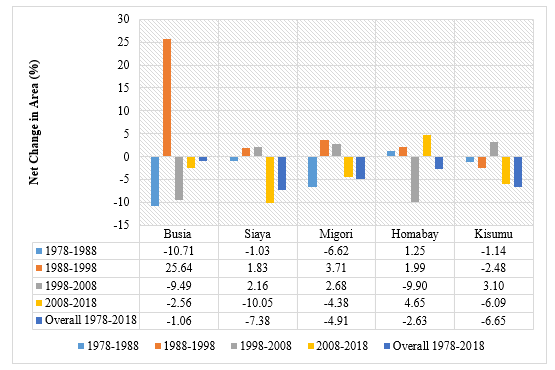 Figure 9: Net changes in agricultural land coverages for the period of 1978 – 2018
Water Bodies
The coverage of water bodies in 1978 and 2018 was highest in Homabay County than in other counties. Generally, water bodies’ coverage remained relatively constant in all the counties from 1978 through 2018 (Figure 8). Conversely, decade-by-decade analysis shows that both positive and negative growth patterns were observed in the coverage of water bodies among the counties between 1978 and 2018 (Figure 8). From 1978–1988, the coverage of water bodies increased in Migori County by 14.84% and decreased in Busia County by 1.67%, while the remaining part of the counties remaining constant (Figure 8). In the subsequent decade (1988-1998), all the counties recorded net losses in coverage of water bodies with the exception of Busia County with a slight net gain (Figure 8). In the decade of 1998 -2008, slight positive increment in the coverage of water bodies was observed in Busia, Kisumu and Homabay counties, while slight negative growth was observed in Migori and Siaya (Figure 8). In the last decade (2008-2018), the coverage of water bodies tended to remain fairly constant in all the counties, with negligible fluctuations (Figure 8).
Marginal losses or gains were realized in total land area for water bodies, an implication that the immediate land areas bordering the waters of the Lake Victoria have been marginally affected during these periods. The coverage of water bodies has tended to remain constant in Lake Victoria basin except for occasional fluctuations during the flood season. The water levels in the lake have been known to occasionally experience relative rise and falls [47]. These fluctuations could be attributed to prolonged dry seasons with high evaporation rates, and widespread massive flooding during periods of intense rainfall, especially around the plains [48,49]. The heavy rains also fill up the rivers extending their banks and causes scattered marsh pools in the basin [49]. There is also the possibility that the slight reductions in areas under water could be due to the draining and conversion of wetlands to built-up areas and agricultural farms [50]. About 62% of wetland areas around the Lake Victoria have been converted to agricultural land between 2002 and 2014 [51].
Grasslands and Vegetation
Grasslands and vegetation cover were more dominant in Migori County than in Homabay, Siaya, Kisumu and Busia counties in 1978. But by 2018, Migori had more areal coverage of grasslands and vegetation followed by Busia, Homabay, Kisumu and then Siaya. Generally, all counties recorded net gains in the grasslands and vegetation coverage from 1978 to 2018 with exception of Siaya County which recorded an overall net loss in the period between 1978 and 2018 (Figure 9). However, decade-by-decade analysis of net changes shows that both positive and negative growth patterns were noticeable in the grasslands and vegetation coverage among the counties between 1978 and 2018 (Figure 9).
Between 1978 and 1988, a noticeable increase in the areal coverage of grasslands and vegetation were observed in Busia, Kisumu and Homabay counties, while Siaya and Migori counties recorded slight losses (Figure 9). The next decade (1988-1998) there were net losses in grasslands and vegetation in the counties of Busia (39.61%), Siaya (24.08%) and Homabay (27.49%), while net gains were recorded in the counties of Migori (159.60%) and Kisumu (24.51%,). Between 1998 and 2008, grasslands and vegetation grew almost three-fold in Homabay County (Figure 9). During the same period, Busia County also recorded a 75% increase in grasslands and vegetation while the counties of Siaya, Migori and Kisumu registered substantial net losses in grasslands and vegetation coverage (Figure 9). In the last decade (2008 – 2018), grasslands and vegetation recorded positive growth rates in all counties except Homabay County (Figure 9).
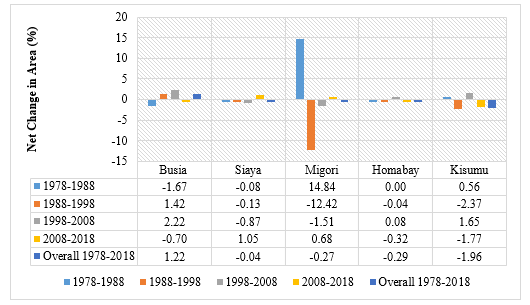 Figure 10: Net changes in water bodies’ coverages for the period of 1978 – 2018
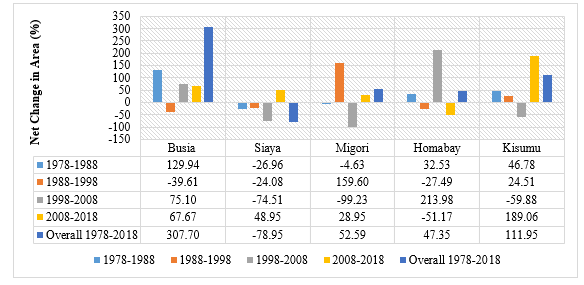 Figure 11: Net changes in grassland & vegetation coverages for the period of 1978 – 2018
Although varied changes in grasslands and vegetation coverages were observed among the counties, generally most areas of grasslands and vegetation were actively undergoing conversion to other land uses. Some areas of grasslands and vegetation probably became bare ground because of desertification problems, construction and bush burning activities [42,47]. Grasslands and vegetation occurring in wetland areas might have been lost when the water in these areas get drained or dry out due to prolonged drought conditions observed around the Lake Victoria in the 1970s and 1980s [52]. Grasslands and vegetation cover occurring near Lake Victoria might have declined during the incidences of the lake water retreating, like the drastic fall in water level observed in 2005 [53]. Other areas of grasslands and vegetation might have been cleared for residential and agricultural expansion to cater for the expanding population growth. However, gains in grasslands and vegetation occurred in some areas where several flood pools sprung like in Nyando of Kisumu County [33]. Also, forest plantations were established by the government for water catchment conservation (such as Gwassi and Wire Hills forest reserves) [54], and bare lands slowly grew grass, shrubs and bushes with time.
Bare Land
Bare land coverage followed a descending order of Siaya County has the largest area of bare land compared to other counties in 1978, however, by 2018; Busia had the largest area of bare ground compared to other counties. Generally, three counties of Busia, Migori and Kisumu recorded high net gains in bare land coverage while two counties of Siaya and Migori recorded overall net losses from 1978 to 2018 (Figure 10). Moreover, decade-by-decade analysis of net changes shows that both positive and negative growth patterns were recorded in the bare land between 1978 and 2018 period (Figure 10).
Between 1978 and 1988, bare land increased by 341% in Migori Counties while the rest of counties experienced net losses in bare land coverage (Figure 10). The following decade (1988-1998) saw this pattern change with Busia, Siaya and Migori recording negative increase in bare land (-26.43%, -43.01% and -78.98%, respectively) while Homabay and Kisumu experienced substantial positive net gains (59.31% and 174.22%, respectively) (Figure 10). Between 1998 and 2008, although at different levels, the same trend observed during the previous decade (1988-1998) replicated itself, whereby Busia, Siaya and Migori experienced net losses in bare land coverage while Homabay and Kisumu experienced net gains in coverage (Figure 10). Finally, between 2008 and 2018, all the counties experienced growth in bare land with Migori County leading with a net gain 645.05%, followed by Busia (255.88%), Siaya (62.06%), Homabay (22.50%) and Kisumu (7.51%) (Figure 10).
The loss in bare land could be due to their utilization for agricultural and settlement purposes. Others have been colonized by vegetation over time once bare/barren land receives precipitation [55]. For the counties with large increase in bare land, the dry climatic conditions might have caused widespread desertification which effectively made some land areas covered by grasslands and vegetation and agricultural lands to become bare over time. Widespread desertification and flooding in the Lake Victoria riparian counties are consequences of climate change effects in the region [56]. Also, mining and quarrying activities (for example gold mining in Migori County) in the riparian counties could have contributed to bare land by outstripping vegetated areas and turning them into waste bare lands. Most mining operations in Kenya involve open cast and underground mining methods which leaves large areas with rocky pits and trenches [57]. Plant growth in these wastelands is often hindered by the acid drainage conditions, therefore wastelands from mined areas can lay bare for several years [57].
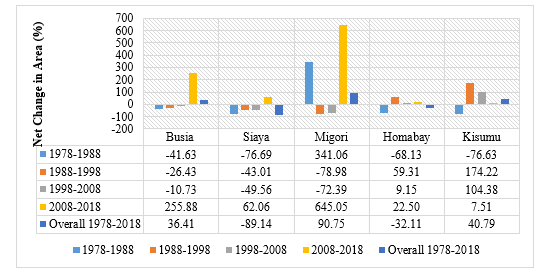 Figure 12: Net changes in bare land coverages for the period of 1978 – 2018
Forests
In 1978, Siaya County has the largest forest coverage among the counties, while in 2018, Busia County had the second highest forest cover compared with is its position in 1978. Generally, Busia, Migori and Homabay recorded net losses in forest cover while Siaya and Kisumu had overall net gains from 1978 to 2018 (Figure 11). Moreover, decade-by-decade analysis of net changes shows that both positive and negative growth patterns were observed in forest cover among the counties between 1978 and 2018 (Figure 11).
From 1978 to 1988, forest cover substantially declined in Busia, Migori and Homabay by 51.10%, 21.07% and 56.48%, respectively. On the other hand, Siaya and Kisumu experienced growth in forest cover by 22.21% and 37.61%, respectively (Figure 11). In sharp contrast, during the following decade of 1988 to 1998, Busia, Migori and Homabay, which had recorded net losses in forest cover, recorded net gains in forest cover while Siaya and Kisumu, which had net gains in forest cover, recorded net losses (Figure 11). In 1998-2008, substantial net losses were observed in all the counties with exception of Busia County which remained unchanged (Figure 11). The last period (2008-2018) experienced massive net gains in forest cover in Kisumu (165.14%), Migori (103.92%) and Siaya (25.36%) counties, and net losses in Busia (55.01%) and Homabay (1.06%) counties (Figure 11).
Losses in forest cover could be a consequence of clearing forested areas to provide land for other competing uses. The regions around Lake Victoria suffer widespread deforestation due to increased land demand for grazing, agricultural and settlement purposes [58]. An estimated 80% of deforested areas are used for agricultural purposes in developing countries [59]. The problem of deforestation was so widespread around the country in the mid-1990s that it forced the government to institute a permanent ban on tree harvesting from designated forested areas [60]. The high deforestation around the basin could also be attributed to increased demand for wood fuel and forest products for settlement and infrastructural related developments for the increasing population [61]. This region experiences widespread usage of wood for household fuel due to the pervasive high poverty levels [62].
The overall increased forest cover in Kisumu and Busia counties could be due to their practice of agroforestry cultivation. These counties have a long history of agroforestry practices since 1980s [59]. The overall decrease in forest cover of Migori, Homabay and Busia could be attributed to the clearing of woody trees in farmlands and forested areas for the lucrative charcoal business, which thrive among Lake Victoria shore dwellers [60,63]. The massive gains in forest cover over the last decade in the three counties could be attributed to the Vision 2030 program which empowered the Ministry of Youth Affairs and Sports to utilize the youths in ambitious tree planting programmes in deforestation hotspots around the county with the aim of creating employment opportunities for them while driving forest conservation goal of achieving the 10% forest cover in the country [60]. Also, the compliance with the Agriculture Act (CAP 318) on Farm Forestry Rules enacted in 2009 requiring at least 10% forest cover in every private farm might have contributed to the gains in forest cover in these counties and around the country [60]. The most recent 2015forestry statistics indicate that the lowest forest covers nationally are found in counties within the Lake Victoria basin [64], an indication of pressure on the region’s forest ecosystems. Based on the latest statistics [65], the forest cover of the riparian counties in the Lake Victoria basin is distributed as follows; Homabay (2.59%), Busia (1.01%), Migori (0.64%), Kisumu (0.44%) and Siaya (0.42%). The results of this study show that forest covers among these riparian counties in 2018 ranged between 0.53% and 4.29%, an indication of a general increment. However, with the national forest cover at 6.99%, the whole country is generally still struggling to attain the constitutionally mandated forest cover of 10% [64].
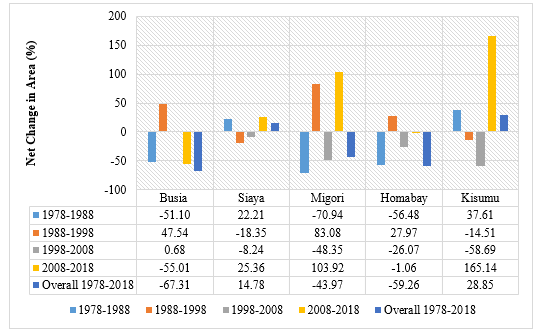 Figure 13: Net changes in forests cover for the period of 1978 – 2018
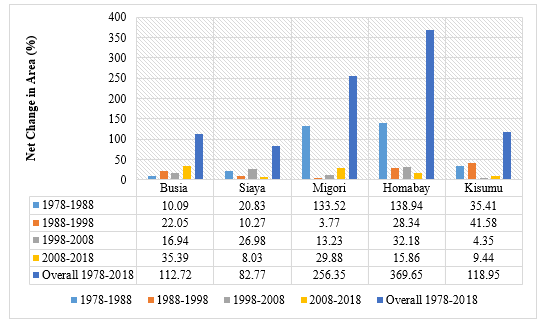 Figure 14: Net changes in built-up areas coverages for the period of 1978 – 2018
Built-up Areas
The coverage of built-up areas among the counties was in the descending order of Siaya, Kisumu, Homabay, Migori and Busia in 1978 but by 2018, the order had changed to Homabay, Siaya, Kisumu, Migori and Busia counties. Generally, all counties registered huge overall net gains in built-up areas from 1978 to 2018 (Figure 12). Moreover, decade-by-decade analysis of net changes shows that only positive growth patterns were recorded of built-up areas among the counties during the period between 1978 and 2018 (Figure 12).
In the first decade (1978-1988), built-up areas increased in all the counties as seen in the net gains of 138.94%, 133.52%, 35.41%, 20.83% and 4.98% for Homabay, Migori, Kisumu, Siaya and Busia counties, respectively. A similar trend was observed for the period of 1988 to 1998, though with reduced percentage gains as follows: Homabay (28.34%), Migori (3.77%), Kisumu (41.58%), Siaya (10.27%) and Busia (22.05%) (Figure 12). Between 1998 and 2008, all the counties recorded positive growth patterns in built-up areas but with even higher net gains from the previous ones (Figure 12). The last decade of 2008 and 2018 also saw positive growth patterns for all counties in built-up areas, with higher percentage gains compared to the previous decade (Figure 12). The built-up areas generally experienced net gains throughout the entire period under study.
From the foregoing, built-up areas continued to increase exponentially among all the counties from 1978 to 2018. Over the years, several scattered land areas under agriculture, grasslands and vegetation, forests and bare lands were indiscriminately utilized for constructing human structures for the ever burgeoning population. The Lake Victoria region has seen rapid population increase over the last three decades, which means more demand for built-up areas for settlement [36]. As the country’s economy grew after independence, so was the population and infrastructural developments in Lake Victoria region which therefore cut into the land areas originally under vegetation of some sort or farms [66]. The increasing built-up areas around Lake Victoria could be attributed to the well documented rapid growth in population and urbanization in the region [43,67]. Population growth and urbanization caused urban sprawl in several rural areas around the country which became administrative and shopping centres [68]. This trend has increased over the years in the whole country with the dawn of devolved governance in Kenya in 2010 which made counties the basis for development [68].
3.3. Accuracy Measurement of the LULC Classification
The summarized report of the confusion (error) matrices is presented in Table 7. It shows the overall accuracies and the overall Kappa co-efficient values. The overall values of accuracy and Kappa co-efficient characterize a combination of the classification aspects and therefore are the most important statistical elements for accuracy measurements reports [40].
Table 7: Summarized confusion (error) matrix report for the counties classification maps for the years 1978, 1988 and 1998.
| County | 1978 | 1988 | 1998 | 2008 | 2018 | ||||||
| Overall Accuracy | Overall Kappa Statistics | Overall Accuracy | Overall Kappa Statistics | Overall Accuracy | Overall Kappa Statistics | Overall Accuracy | Overall Kappa Statistics | Overall Accuracy | Overall Kappa Statistics | ||
| Busia | 0.88 | 0.75 | 0.86 | 0.70 | 0.90 | 0.79 | 0.92 | 0.78 | 0.90 | 0.72 | |
| Homabay | 0.89 | 0.77 | 0.91 | 0.82 | 0.89 | 0.80 | 0.84 | 0.67 | 0.89 | 0.80 | |
| Kisumu | 0.81 | 0.65 | 0.84 | 0.62 | 0.89 | 0.78 | 0.84 | 0.68 | 0.87 | 0.73 | |
| Migori | 0.91 | 0.78 | 0.92 | 0.84 | 0.91 | 0.80 | 0.93 | 0.86 | 0.96 | 0.91 | |
| Siaya | 0.92 | 0.83 | 0.92 | 0.85 | 0.92 | 0.85 | 0.90 | 0.83 | 0.91 | 0.82 | |
The results in Table 7 indicate that for Busia County, the land use/land cover classification for the years 1978, 1988, 1998, 2008 and 2018 recorded overall accuracies in the range of 0.86 – 0.92 and overall Kappa co-efficient values in the range of 0.70 – 0.79. For Homabay county, overall accuracies were in the range of 0.84 – 0.91 while the overall Kappa co-efficient values fell within the range of 0.67 – 0.82. The overall accuracies and overall Kappa co-efficient values for Kisumu County were in the ranges of 0.81 – 0.89 and 0.62 – 0.78, respectively. Migori County’s overall accuracies was in the range of 0.91 – 0.96 and overall Kappa co-efficient values in the range of 0.78 – 0.91. Finally, for Siaya County, recorded overall accuracies in the range of 0.90 – 0.92 and overall Kappa co-efficient values in the range of 0.82 – 0.85.
Generally, all the imageries used for LULC classification registered overall accuracies above 80%, which is considered acceptable [69]. This means all the imageries were highly reliable and the LULC classification acceptable. On the other hand, all the imageries used for LULC classification registered overall Kappa co-efficient of above 0.62, which when compared to the rating criteria for Kappa co-efficient statistics [70] shows that the LULC classification had a strong to moderate agreement with the ground reference data hence high reliability. Kappa co-efficient basically assesses how much the data acquired from the classified imageries agrees with the ones acquired from the ground reference points [71].
4. Conclusion
This study illustrates the effectiveness of using data obtained from multi-temporal satellite imageries for comprehensive monitoring of land use and land cover changes over a given area. The counties experienced varied changes in LULC from 1978 to 2018. Generally, major gains in coverage by the various land use and land cover types occurred in the period between 2008 and 2018 while major losses occurred between 1978 and 1988. These changes were driven by a combination of natural climatic and human-induced factors. Rapid population and economic growth in the region are responsible for the conversion of large natural land areas to other uses. Therefore, it can be concluded that these regions within the Kenyan Lake Victoria basin may remain susceptible to degradation from rapidly increasing urbanization and population pressure effects unless urgent remedial measures are undertaken.
In this regard, the study recommends that respective county authorities responsible for land use and urban planning should periodically monitor and regulate the development patterns in their communities to ensure that they protect livelihoods, economic interests and ecosystems. There should also be aggressive public awareness creation among the respective county government officials and residents so that proper land use management becomes a stakeholder’s affair for better results. Finally, urgent conservation efforts are needed to recover lost vegetated land areas such as forests, grasslands and vegetation. This study provides important information on the land use and land cover dynamics of respective counties which could inform conservation planning of degradation hotspots within the respective counties of Lake Victoria basin. Future conservation measures should take into consideration, the general ecological and socio-political processes in the entire Lake Victoria basin for integrated watershed conservation.
Funding
This study was funded by a grant provided to the first author by the African Union Commission (AUC).
Conflict of Interest
The authors declare no conflict of interest.
Acknowledgment
The authors are grateful to the research assistants namely, Jeremiah Lekolwane (Maseno University, Kenya), Samuel Methusela (University of Nairobi, Kenya) and Phillip Zeph (ICRISAT, Kenya) for their assistance in coordinating the fieldwork for this research. We are also thankful to Martin Mutinda for statistical analyses. Further, we acknowledge with deep gratitude the research advice provided by Prof. Anthony Gidudu from Makerere University.
- M. Peters, Assessing Land Use and Land Cover Change in the Keta Municipality of Ghana Using Remote Sensing, Master’s Thesis, University of Ghana, 2019.
- A. Sherbinin, Land-Use and Land-Cover Change, A CIESIN Thematic Guide. Center for International Earth Science Information Network (CIESIN) of Columbia University, Palisades, NY, USA, 2002.
- E. Ellis, Land-use and land-cover change. The Encyclopedia of Earth, 2010. Available at http://www.eoearth.org/view/article/154143
- A. Ibe, R.E. Quelennac, Methodology for Assessment and control of coastal erosion in West Africa and Central Africa. UNEP, Regional Sea Reports and studies No. 107.United Nations Environment programme, New York, U.S.A, 2011.
- M. Mendoza, E. L. Granados, D. Geneletti, D. R. Pérez-Salicrup, V. Salinas, “Analysing land cover and land use change processes at watershed level: a multitemporal study in the Lake Cuitzeo Watershed, Mexico (1975–2003),” Applied Geography, 31(1), 237-250, 2011.
- T. Oliver, M. D. Morecroft, “Interactions between climate change and land use change on biodiversity: attribution problems, risks, and opportunities,” Wiley Interdisciplinary Reviews: Climate Change, 5(3), 317-335, 2014.
- E. Lambin, H. J. Geist, E. Lepers, “Dynamics of land-use and land-cover change in tropical regions,” Annual review of environment and resources, 28(1), 205-241, 2003.
- H. Geist, W. McConnell, E.F. Lambin, E. Moran, D. Alves, T. Rudel, “Causes and Trajectories of Land-Use/Cover Change,” In Land-Use and Land-Cover Change; Lambin, E.F., Geist, H., Eds.; Global Change – The IGBP Series, Springer: Berlin/Heidelberg, Germany, 2006.
- T. Meshesha, S. K. Tripathi, D. Khare, “Analyses of land use and land cover change dynamics using GIS and remote sensing during 1984 and 2015 in the Beressa Watershed Northern Central Highland of Ethiopia,” Modeling Earth Systems and Environment, 2(4), 1-12, 2016.
- R. Harris, S. Ventura, “Identifying systematic land-cover transitions using remote sensing and GIS: the fate of forests inside and outside protected areas of Southwestern Ghana,” Environment and Planning B: Planning and Design, 35(2), 280-295, 2006.
- A. Koranteng, T. Zawila-Niedzwiecki, I. Adu-Poku, “Remote sensing study of land use/cover change in West Africa,” Journal of Environmental protection and sustainable development, 2, 17-31, 2016.
- G. Chakilu, M. A. Moges, “Assessing the land use/cover dynamics and its impact on the low flow of Gumara watershed, Upper Blue Nile Basin, Ethiopia,” Hydrology: Current Research, 8, 1-6, 2017, doi: 10.4172/2157-7587.1000268
- S. Jackson, D. F. Sax, “Balancing biodiversity in a changing environment: extinction debt, immigration credit and species turnover,” Trends in ecology & evolution, 25(3), 153-160, 2010.
- L. Baan, R. Alkemade, T. Koellner, “Land use impacts on biodiversity in LCA: a global approach,” The International Journal of Life Cycle Assessment, 18(6), 1216 -1230, 2013.
- E. Wood, G. G. Tappan, A. Hadj, “Understanding the drivers of agricultural land use change in south-central Senegal,” Journal of Arid Environments, 59(3), 565-582, 2004.
- H. Liu, Q. Weng, “Landscape metrics for analysing urbanization-induced land use and land cover changes,” Geocarto International, 28(7), 582-593, 2013.
- M. Maimaitiyiming, A. Ghulam, T. Tiyip, F. Pla, P. Latorre-Carmona, Ü. Halik, M. Caetano, “Effects of green space spatial pattern on land surface temperature: Implications for sustainable urban planning and climate change adaptation,” ISPRS Journal of Photogrammetry and Remote Sensing, 89, 59-66, 2014.
- J. Rawat, M. Kumar, “Monitoring land use/cover change using remote sensing and GIS techniques: A case study of Hawalbagh block, district Almora, Uttarakhand, India,” The Egyptian Journal of Remote Sensing and Space Science, 18(1), 77–84, 2015, https://doi. org/10.1016/j.ejrs.2015.02.002
- G. Forkour, C. Conrad, M,. Theil, T. Landmann, B. Barry, “Evaluating the sequestial masking approach for improving crop discrimination in the Sudanian savanna of West Africa,” Electronics and Computers in Agriculture, 118, 380-389, 2015.
- G. Anfuso, J. Á. Del Pozo, “Assessment of coastal vulnerability through the use of GIS tools in South Sicily (Italy),” Environmental Management, 43(3), 533-545, 2009.
- R. Kanianska, “Agriculture and its impact on land-use, environment, and ecosystem services,” Landscape ecology, 1-26, 2016.
- A. Falcucci, L. Maiorano, L. Boitani, “Changes in land-use/land-cover patterns in Italy and their implications for biodiversity conservation,” Landscape ecology, 22(4), 617-631, 2007.
- V. Parsova, N. Stoiko, R. Kuryltsiv, N. Kryshenyk, “Differentiation of land cover degradation in Ukraine and Latvia,” In Proceedings of the 18th International Scientific Conference “Engineering for Rural Development”, Jelgava: LLU 798-803, 2019.
- K. Vadrevu, T. Ohara, C. Justice, “Land cover, land use changes and air pollution in Asia: a synthesis,” Environmental Research Letters, 12(12), 120-129, 2017.
- Y. Wang, W. Choi, B. M. Deal, “Long-term impacts of land-use change on non-point source pollutant loads for the St. Louis metropolitan area, USA,” Environmental Management, 35(2), 194-205, 2005.
- M. Tefera, “Land-use/land-cover dynamics in Nonno district, central Ethiopia,” Journal of Sustainable development in Africa, 13(1), 123-141, 2011.
- E. Padonou, A. M. Lykke, Y. Bachmann, R. Idohou, B. Sinsin, “Mapping changes in land use/land cover and prediction of future extension of bowé in Benin, West Africa,” Land Use Policy, 69, 85-92, 2017.
- J. Kashaigili, A. M. Majaliwa, “Integrated assessment of land use and cover changes in the Malagarasi river catchment in Tanzania,” Physics and Chemistry of the Earth, Parts A/B/C, 35(13-14), 730-741, 2010.
- C. K. Twesigye, S. M. Onywere, Z. M. Getenga, S. S. Mwakalila, J. K. Nakiranda, “The impact of land use activities on vegetation cover and water quality in the Lake Victoria watershed,” The Open Environmental Engineering Journal, 4, 66–77, 2011.
- J. B. Owuor, P. O. Raburu, F. Kwena, “Community based approach to the management of Nyando wetland, Lake Victoria Basin, Kenya. United Nations Development Programme (UNDP),” 2012.
- S. Koyombo, S.E. Jorgensen, “Lake Victoria: experience and lessons learnt brief. In: Lake Basin Management Initiative,” 2006, Available at http//www.ilec.or.jp/eg/lbmi/pdf/27_lake_victoria_27February2006.pdf
- B. M. Mati, S. Mutie, H. Gadain, P. Home, F. Mtalo, “Impacts of land-use/cover changes on the hydrology of the transboundary Mara River, Kenya/Tanzania,” Lakes and Reservoirs: Research and Management, 13(2), 169–177, 2008. https://doi.org/10.1111/j.1440-1770.2008.00367.x
- L. Olang, J. Fürst, “Effects of land cover change on flood peak discharges and runoff volumes: Model estimates for the Nyando River Basin, Kenya,” Hydrological Processes, 25(1), 80–89, 2011, doi.org/10.1002/hyp.7821
- W. Juma, H. Wang, F. Li, “Impacts of population growth and economic development on water quality of a lake: case study of Lake Victoria Kenya water,” Environmental Science and Pollution Research, 21(8), 5737-5746, 2014, doi.org/10.1007/s11356-014-2524-5
- LVBC, “Regional Transboundary Diagnostic Analysis (RTDA) of Lake Victoria Basin, Lake Victoria Basin Commission Publication No 4, Kisumu, Kenya,” 2007.
- F. Githui, “Assessing the impacts of environmental change on the hydrology of the Nzoia catchment, in the Lake Victoria Basin, Ph.D Thesis, Vrije Universiteit Brussel, 2007.
- R. Manandhar, I. O. Odeh, T. Ancev, “Improving the accuracy of land use and land cover classification of Landsat data using post-classification enhancement,” Remote Sensing, 1(3), 330-344, 2009.
- J.B. Campbell, R.H. Wynne, Introduction to Remote Sensing, 5th ed., Guilford Press: New York, NY, USA, 2011.
- D. Lu, Q. Weng, “A survey of image classification methods and techniques for improving classification performance,” International Journal of Remote Sensing, 28(5), 823–870, 2007, doi.org/10.1080/01431160600746456.
- R. Congalton, K. Green, Assessing the Accuracy of Remotely Sensed Data: Principles and Practices. CRC Press, Boca Raton, 2009.
- I. Nicholas-Kiggundu, L. A. Anaba, N. Banadda, J. Wanyama, I. Kabenge, “Assessing land use and land cover changes in the Murchison Bay catchment of Lake Victoria basin in Uganda,” Journal of Sustainable Development, 11(1), 23 – 32, doi.org/10.5539/jsd.v11n1p44
- E. Odada, W. O. Ochola, D. O. Olago, “Drivers of ecosystem change and their impacts on human well-being in Lake Victoria basin,” African Journal of Ecology, 47, 46-54, 2009.
- County Government of Kisumu (CGK), First County integrated development plan 2013-2017, 2013, available at http://kisumu.go.ke/.
- B. Kogo, L. Kumar, R. Koech, “Impact of Land Use/Land Cover Changes on Soil Erosion in Western Kenya, Sustainability,” 12, 9740, 2020, doi:10.3390/su12229740
- K. Geheb, T. Binns, “‘Fishing Farmers’ or ‘Farming Fishermen’? The Quest for Household Income and Nutritional Security on the Kenyan Shores of Lake Victoria,” African Affairs, 96(382), 73-93, 1997.
- P. Onyango, “Occupation of last resort? Small-scale fishing in Lake Victoria, Tanzania,” In Poverty mosaics: Realities and prospects in small-scale fisheries, 97-124, 2011.
- J. Awange, J. Aluoch, L. A. Ogallo, M. Omulo, P. Omondi, “Frequency and severity of drought in the Lake Victoria region (Kenya) and its effects on food security,” Climate Research, 33(2), 135-142, 2007.
- S. Swenson, J. Wahr, “Monitoring the water balance of Lake Victoria, East Africa, from space,” Journal of Hydrology, 370(1-4), 163-176, 2009.
- I. Vanderkelen, N. P. Van Lipzig, W. Thiery, “Modelling the water balance of Lake Victoria (East Africa)-Part 1: Observational analysis,” Hydrology and Earth System Sciences, 22(10), 5509-5525, 2018.
- A. Oroda, S. Anyango, C. Situma, A. Branthomme, “Long Term Monitoring and Assessment of Natural Resources: Remote Sensing as a Component of an Integrated Approach–The Case Study of the Lake Victoria Basin in Kenya. Food and Agriculture Organization Report,” 1 – 47, 2016.
- J. Isunju, J. Kemp, “Spatiotemporal analysis of encroachment on wetlands: a case of Nakivubo wetland in Kampala, Uganda,” Environmental monitoring and assessment, 188(4), 203, 2016.
- I. Nyandega, Assessment and characterization of drought occurrence in the Lake Victoria Basin of Kenya: a case study of West Kenya, Ph.D Thesis, University of Nairobi, 1990.
- K. Obiero, P. O. Raburu, J. B. Okeyo-Owuor, E. A. Raburu, “Community perceptions on the impact of the recession of Lake Victoria waters on Nyando Wetlands,” Scientific Research and Essays, 7(16), 1647-1661, 2012.
- J. Bradley, T. Imboma, D. W. Bradley, “Birds of Mount Kisingiri, Nyanza Province, including a preliminary survey of the Gwassi Hills Forest Reserve and a species new to Kenya,” Scopus: Journal of East African Ornithology, 35(1), 11-38, 2015.
- X. Zhang, M. A. Friedl, C. B. Schaaf, A. H. Strahler, Z. Liu, “Monitoring the response of vegetation phenology to precipitation in Africa by coupling MODIS and TRMM instruments,” Journal of Geophysical Research: Atmospheres, 110(D12), 2005.
- B. Muok, J. W. Wakhungu, G. N. Muhoro, C. Tonui, L. Hayanga, Climate Change and Bioenergy Report: Case Studies of Oyola and Wekesi Villages, Nyando District, Nyanza Province, Kenya. Climate Change and Bioenergy Report, African Centre for Technology Studies (ACTS), 2010.
- J. Ogola, W. V. Mitullah, M. A. Omulo, “Impact of gold mining on the environment and human health: a case study in the Migori gold belt, Kenya,” Environmental geochemistry and health, 24(2), 141-157, 2002.
- N. Naburi, M. M. Edward, J. F. Obiri, “Determinants of Watershed Governance and Food Security among Households’ in the Lower Sio River Watershed, Busia County, Kenya,” International Journal of Agriculture, Environment and Bioresearch, 3(05), 30-55, 2018.
- A. Mugure, P. Oino, “Benefits of agroforestry farming practices among rural households in Kenya: experiences among residents of Busia county,” International Journal of Science and Research, 2(4), 442-449, 2013.
- V. Oeba, S. C. Otor, J. B. Kung’u, M. N. Muchiri, “Modelling determinants of tree planting and retention on farm for improvement of forest cover in central Kenya,” International Scholarly Research Notices, 2012.
- J. Ngaira, K. Omwayi, “Climate change mitigation: Challenges of adopting the green energy option in the Lake Victoria basin,” International Journal of Physical Sciences, 7(41), 5615-5623, 2012.
- J. Owuor, D. O. Nyamai, G. O. Ochola, “Impacts of Land Use and Land Cover Changes on the Environment associated with the Establishment of Rongo University in Rongo Sub-County, Migori County, Kenya,” International Journal of Environmental Sciences & Natural Resources, 21(5), 556075, 2019, doi: 10.19080/ijesnr.2019.21.556075
- Kenya Forestry Research Institute Kenya Forestry Research Institute Strategic Plan 2008-2012 , Kenya Forestry Research Institute, Nairobi, Kenya, 2008.
- J. Kiarie, “How the counties fare on forest cover as Kenya strives for elusive target. Business Daily, (2017, September 13).” Available at https://www.businessdailyafrica.com/economy/How-the-counties-fare-on-forest-cover-as-Kenya/3946234-3381286-g7gart/index.html
- Kenya Forest Service (KFS), National Forest Policy Draft Report, 2016. Available at https://www.google.com/url?q=http://www.kenyaforestservice.org/documents/Forest%2520Policy,%25202014%2520(Revised%252020-2-2014).pdf&sa=U&ved=2ahUKEwjs45KZr9TrAhVk0uAKHZq8APUQFjAAegQICRAB&usg=AOvVaw0e2GXbkfiK7YnbVINgad5L
- L. Fusilli, P. Marzialetti, G. Laneve, G. Santilli, “Urban growth assessment around Winam Gulf of Kenya based on satellite imagery,” Acta Astronautica, 93, 279-290, 2014.
- S. Rakama, J. F. Obiri, E. M. Mugalavai, “Evaluation of land use change pattern of Kajulu-Riat hill peri-urban area near Kisumu City, Kenya,” International Journal of Scientific Research and Innovative Technology, 4( 7) 3-9, 2017.
- M. Shadrack, Mapping urban sprawl and its impacts-a case study of Ruiru Subcounty, Kiambu County, Ph. D Thesis, University of Nairobi, 2015.
- S. Turan, A. Günlü, “Spatial and temporal dynamics of land use pattern response to urbanization in Kastamonu,” African Journal of Biotechnology, 9(5), 640-647, 2010.
- J. Landis, G. Koch, “The measurement of observer agreement for categorical data,” Biometrics, 33, 159–174, 1977.
- C. Ikiel, B. Ustaoglu, A. A. Dutucu, D. E. Kilic, “Remote sensing and GIS-based integrated analysis of land cover change in Duzce plain and its surroundings (north western Turkey),” Environmental monitoring and assessment, 185(2), 1699-1709, 2013.