
Homology Modeling of CYP6Z3 Protein of Anopheles Mosquito
Volume 6, Issue 2, Page No 580-585, 2021
Author’s Name: Marion Olubunmi Adebiyia), Oludayo Olufolorunsho Olugbara
View Affiliations
ICT and Society Research Group & Luban Workshop, Durban University of Technology, Durban, 4000, South Africa
a)Author to whom correspondence should be addressed. E-mail: mariona@dut.ac.za
Adv. Sci. Technol. Eng. Syst. J. 6(2), 580-585 (2021); ![]() DOI: 10.25046/aj060266
DOI: 10.25046/aj060266
Keywords: Anopheles Gambiae, Cytochrome P450 Family, Pyrethroid Resistance, Model Structure

Export Citations
The Anopheles gambiae’s CYP6Z3 protein belongs to the Cytochrome P450 family and functions in oxidation-reduction processes, many studies including our previous work on elucidating insecticide resistance genes of the Anopheles also implicated her in pyrethroid insecticide resistance. Model prediction, functional analysis, and enrichment of the target gene with triplex binding sites may become a useful diagnostic biomarker for the disease subtype, but wrong classification of the model by various existing alignment algorithms is a daunting issue that complicates and misleads in decision making during pathway and functional analysis. The aim of this study is to predict five in-silico model of CYP6Z3 Anopheles protein by homology modeling, evaluate and classify them to elucidate the performance of the sequence alignment algorithm deployed, then characterize the top model that is correctly classified. Template selection from three alignment algorithms with sequence of the target-protein, (Anopheles-CYP6Z3) obtained from UNIPROT served as input, Clustal omega and Clustalw2 algorithms was used to generate alignment files for homologous template search to the target-protein. Best template was sought, and the 3D model built in an-automated-mode. PROCHECK was used to evaluate the best-of-the-five-obtained models. Estimating the quality of all models, the prime model emerged from ClustalW2 alignment algorithm, but was wrongly classified as a homo-tetramer-state. These provided a misleading-information which was revealed during model evaluation and interpretation, that resulted to an inappropriate pathway and functional-analysis, false positive model was then isolated, and the current best model emerged from clustalo alignment algorithm having 87.7% amino residues in the most favorable regions, 0.7% in the disallowed regions at monomer oligo state. Functional analysis of the best Anopheles CYP6Z3 secondary structure showed characteristics that explain the different degrees of genetic regulation translating to resistance mechanism in the malaria vector.
Received: 21 August 2020, Accepted: 05 December 2020, Published Online: 20 March 2021
1. Introduction
The Anopheles gambiae CYP6Z3 protein is a member of Cytochrome P450 protein family functioning in oxidation-reduction processes. It has the VECTORBASE Annotation ID AGAP008217, primary (citable) accession number Q86LT6 and entry name Q86LT6_ANOGA. It has a sequence length of 492AA and is located on Chromosome 3R: 6,971,669-6,973,290. It has a mass of 56,490(Da) [1], [2]. It has been implicated in pyrethroid resistance [3].
The CYP6Z3 protein is expressed during the mosquito’s larval stages [4], this protein belongs to the Cytochrome P450 family and functions in oxidation-reduction processes. The P450 is a large family that plays critical role in xenobiotics detoxification or activation. Instances are insecticide detoxification in the West African Anopheles gambiae [5].
Over 30 species of Anopheles transmit malaria (http://www.cdc.gov/malaria/about/biology/mosquitoes/), hence identification of resistance mechanisms in other species is a focus of many researches. Anopheles funestus is the next as a major malaria vector in Sub-Saharan Africa. When quantitative trait loci (QTL) are considered, several genes are strongly associated with pyrethroid resistance in A. funestus, this include our target protein CYP6Z3 [6]. In a recent study, genes transcripts from the four known detoxification genes family, (cytochrome P450s, glutathione transferases, carboxylesterases and UDP glucornyltransferases were reported to be generally enriched in the midgut and malpighian tubules of A. gambiae. Recently, Cytochrome P450 proteins were reported to have developed different levels of resistance to multiple insecticides [7]. Specifically, the CYP6Z3 family was found to be highly enriched in the malpighian tubules consistently with its role in detoxification [8].
The malpighian tubules therefore display roles similar to liver of vertebrates, kidney and their immune system. Despite the wide distribution of detoxifying enzymes in insects, baseline mechanisms protecting vectors against insecticides is resident mainly in the excretory canal (system) of the insect’s, which corresponds to less than 0.1% of its total mass [9].
1.1. Theoretical framework
Homology modelling, also called comparative modelling is the central concept of relative and trans-mutative biology. It is the existence of morphological structures and features in various species or organisms linked by sharing common ancestor. Homology was invented in the nineteenth century and found to be phylogenetic in nature and well rooted in comparative practice even before the invention of evolution theory [10]. It is believed that various developmental mechanisms are responsible for formation of homologous structure, however, varying specie may have anatomical structures with same or different characters, featuring similar shape, internal structure, and function, but may only be closely related species by taxonomic link in different mammals. The idea of homology originated with the recognition that the same structures exist in less closely related species (mammals and birds, or even mammals and fish) and that the sameness of morphological (body) units is independent of their function and form [10], [11]. Figure 1 depicts the flow diagram of the conceptual framework of this research.
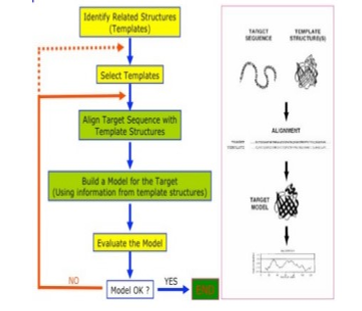 Figure 1: Conceptual framework of homology modelling [12]
The theoretical model is a molecular model premised on the notion that if two proteins possess a high sequence similarity, they will most likely have highly similar three-dimensional structures. To select the best template, a search for homologous Protein that has experimental structure by empirical methods by X-ray crystallography, nuclear magnetic resonance (NMR), or cryo-electron microscopy, existing on Protein Data Bank (PDB) [13].
2. Experimental
The method deployed was adopted from [14]. The FASTA format sequence of the target protein CYP6Z3 of the Anopheles was retrieved from UNIPROT database, (UniProt entry Q86LT6).
2.1. Template Selection
BLAST Program [15], blastp variant was used to the search for homologous sequences within Protein Data Bank (PDB) database [16]. The BLAST search returned many sequences that were homologous with the target sequence but only one was selected as the template.
2.2. Selection Criteria
Sequence identity of 30% or more was considered. Generally, the homologous sequences returned had low sequence identity between 19%-33%. E-value less than 0.001 and query cover above 50% were also considered. Potential templates were filtered based on these criteria and the atomic resolution of their experimentally derived 3D structures as viewed from PDB. Structures that failed to meet one or more of these criteria were excluded and the protein with accession 1TQN_A was selected as the template, with query cover 96%, E-value 2e-68 and sequence identity 31%. It has a medium atomic resolution of 2.05Å and was determined by X-ray crystallography. The 1TQN_A protein is a crystal structure of the human microsomal P450 3a4. It has a sequence length of 486AA. It is also a Cytochrome P450 enzyme functioning in oxidation-reduction processes. The sequence for the template was downloaded directly from the BLAST webpage in the fasta format.
2.3. Sequence Alignment
In [17], [18], the authors were used to perform sequence alignments for the target sequence and template sequence using the default settings. The resulting .clustalw2 and .clustalo files were downloaded to serve as an input files for the next step.
2.4. Building the Model
Swiss Model Server in [19], was deployed for building the 3D structure of the target protein.
3. Results
This study modelled five (3D) secondary structure of the Anopheles protein, CYP6Z3 by homology modeling, evaluated, classified, and compared their classified features to gauge how the sequence alignment algorithms rates the features of each of the model. The purpose of comparison was to reveal the best of the five models and elucidate possible errors in the features of their secondary structure, the evaluation result detected a wrong classification error in the supposed best structure, while other features are correctly classified. If the structure with error is the only one modelled and validated, performing further analysis such as functional characterization and pathway analysis based on the result built with error may result in misleading result hypothesis and fatal conclusion.
Clustal omega and Clustalw2 algorithms was used to generate alignment files for homologous template search to the target-protein. The final correctly classified result of the best CYP6Z3 Anopheles gambiae secondary structure was functionally analysed, the result revealed the different degrees of genetic regulation translating to resistance mechanism deployed to pyrethroid class of insecticide by the malaria vector, Anopheles.
3.1. Using .clustlaw Alignment File
The “Alignment Mode” was used where the target-template alignment from Clustalw2 was submitted to the server. The server generated a model built with template 1tqn.2.A (Table 1).
Table 1: Features of model from template 1TQN.2.A with Clustal W2 alignment file
| Template | Seq ID | Oligo-state | Method | Seq similarity | Coverage |
| 1tqn.2.A | 30.30% | Homo-tetramer | X-ray, 2.05Å | 0.36 | 0.96 |
3.2. Using .clustalo Alignment File
First, the “Alignment Mode” was used where the target-template alignment from Clustal Omega was submitted to the server (TABLE 2). Next, the “Automated Mode” was used where another entry was submitted into the server with only the target protein as input data, allowing Swiss Model Server to search through databases for its template(s) of choice (TABLE 3).
3.3. Alignment mode
Table 2: Features of model from template 1TQN.1.A with Clustalo alignment file
| Template | Seq ID | Oligo-state | Method | Seq similarity | Coverage |
| 1tqn.1.A | 30.85% | Monomer | X-ray, 2.05Å | 0.36 | 0.96 |
3.4. Automated mode
The server found 50 templates and built 3 models
Table 3: Features of the three models from automated mode
| Built | Template | Seq ID | Oligo-state | Method | Seq similarity | Coverage |
| Model 1 | 1tqn.1.A | 30.85% | Monomer | X-ray, 2.05Å | 0.36 | 0.96 |
| Model 2 | 4k9w.4.A | 30.19% | Monomer | X-ray, 2.4Å | 0.36 | 0.95 |
| Model 3 | 3ua1.1.A | 30.19% | Monomer | X-ray, 2.15Å | 0.36 | 0.95 |
From the models generated, it was observed that using Clustalw2 for sequence alignment, the model was predicted to be a homo-tetramer while for Clustal Omega, all models were predicted to be monomers. Also, both alignment modes (i.e from .clustalw and .clustalo files) generated structures for 1TQN_A proteins (1tqn.2.A and 1tqn.1.A respectively). It was hypothesized that these two proteins were more closely related based on their coverage of 0.96 although they differed in sequence identity compared with a similarly named model (1tqn.1.A) built via automated mode which had a coverage of 0.95.
3.5. Model evaluation
PROCHECK [20], [21] generated the Ramachandran plot, this plot was used to validate the built models (Figures 2, 3, 4, 5, 6).
Table 4: Ramachandran plot interpretation for the modelled structures (result validity table)
| Source | Alignment mode | PDB SUM | Most favoured regions | Disallowed regions |
| Cluster W2 Alignment | 1tqn.2.A | d839 (Figure 2) | 87.9% | 1.2% |
| Cluster O Alignment | 1tqn.1.A | d860 (Figure 3) | 87.7% | 0.7%
|
| Automated mode | 1tqn.1.A | d861 (Figure 4) | 80.9% | 1.4% |
| Automated mode | 4k9w.4.A | d862 (Figure 5) | 83.2% | 1.7% |
4. Discussion
From the above tables, as hypothesized, the structures derived from Clustalw2 and Clustal Omega sequence alignments were similar, having the highest percentage of residues in the most favored regions than every other model generated via the automated mode (TABLE 4). All the structures built represented the same protein, but clustalw2 ‘misinterpreted’ it to be a homo-tetramer protein. Clustalw2 model would have been the best with 87.9% amino acid residue highly deposited in the most acceptable region and 1.2% deposit in the disallowed region, but since it could not classify the protein appropriately into a monomer oligo state, where the protein family belongs, the result was disregarded and could not be considered for further functional analysis and quality scrutiny.
This shows that the quality of the choice of template sequence used as input data into any modelling server, Swiss model in this case, is very important. For the automated mode, the 3ua1.1.A model was the best with the highest percentage of residues in the most favored/ acceptable regions. Comparing this with those obtained via alignment mode, the model 1tqn.1.A generated from .clustalo (Figure 8) alignment file with Ramachandran plot (Figure 3) respectively was the overall best structure having 87.7% amino residues in the most favorable regions and 0.7% residue deposits in the disallowed regions. All model proteins derived from both alignment and automated modes are in Figures (7, 8, 9, 10, 11).
 Figure 2: Ramachandran plot of Figure 7
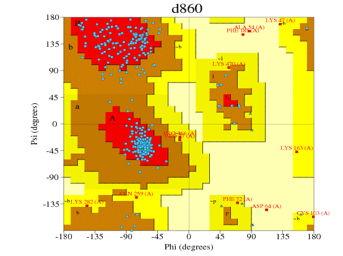 Figure 3: Ramachandran plot of Figure 8
 Figure 4: Ramachandran plot of Figure 9
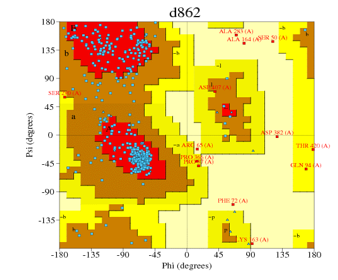 Figure 5: Ramachandran plot of Figure 10
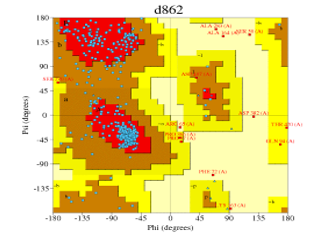 Figure 6: Ramachandran plot of Figure 11
4.1. Alignment mode
In [22], the author used to summarize the statistical details of the prime model (1tqn.1.A from alignment mode), while SaliLab Model Evaluation Server (ModEval) was also used to estimate the quality of the best model. The model from ClustalW2 alignment algorithm came up as the best model, but the alignment algorithm wrongly classified the model to be at homo-tetramer-state. These provided a misleading information which sufficed during result interpretation and model evaluation, these resulted to inappropriate pathway and functional characterization, until model with false positive classification was isolated and the real true positive model emerged the best model and was characterized.
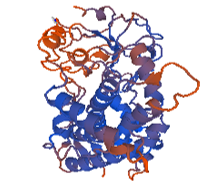 Figure 7: 1tqn.2. A
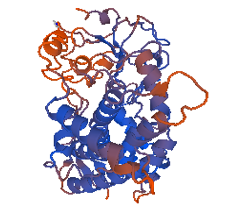 Figure 8: 1tqn.1. A (Best of all Models)
 Figure 9: 1tqn.2. A
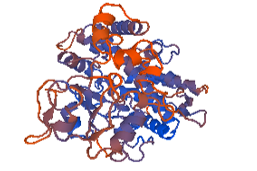 Figure 10: 4k9w.4. A
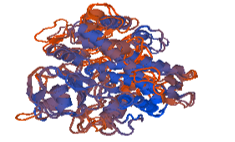 Figure 11: 3ua1.1.A
5. Conclusion
In this work, the best model was obtained by comparing the modeled structures produced by clustalo and .clustalw alignment files, meaning that the 3D-models produced by the two alignment-modes were very-similar, having a high-amino-residue-percentage deposited most favored-regions on the Ramachandran-plot than the model by the SWISS-automated-mode. Meticulosity and carefulness in the selection of procedure for analysis and choice of criteria for template protein selection from the avalanche of selectable criteria is an explorable virtue that can be deployed to avoid performing further analysis on true negative errors and interpreting false positive results. Our result showed that the quality of structure predicted by in-silico modeling cannot be over emphasized. Results showed that the 3D-model generated from template-protein-(1tqn.2.A), by Clustalw2-alignment and 3D-model generated from template-protein (1tqn.1.A ) by Clustal Omega alignment were similar, having a high amino residue percentage deposited at regions that are most favored on the Ramachandran plot than the rest of the models generated via the automated mode. MolProbity for statistical analytics-summary and SaliLab-Model-Evaluator (ModEval) estimated the quality of the prime/leading model and evaluated the model from ClustalW2 as the best model, but wrongly classified the protein into a homo-tetramer state. These provided a misleading information which suffice during results interpretation, hypothesis generation and may result to inappropriate pathway and functional analysis. This matter in decision making during interpretation of result. it goes a longer way to determine not just the quality of the outputted target or modelled structure, but also considered aptly in taking decision to elicit the quality of the predicted functions of the target proteins, even in taking hypothesis while interpreting the output model as result, researcher may be misguided if an appropriate criterion was not considered during template selection on BLAST search. The role of CYP6Z3 in physiological processes including hormone and pheromone metabolism as well as insecticide detoxification, especially of pyrethroid, in Anopheles gambiae was also deduced.
Conflict of Interest
The authors declare that they have no conflict of interest.
Acknowledgment
The appreciation of the first author goes to the Research and Postgraduate Directorate of Durban University of Technology, Durban, South Africa for hosting the Postdoctoral Fellows and to the ICT and Society Research Focus Area for funding this research.
- P. J. Kersey, J. E. Allen, M. Christensen, P. Davis, L. J. Falin, C. Grabmueller, D. S. Toney Hughes, J. Humphrey, A. Kerhornou, J. Khobova, et al., “Ensembl Genomes 2013: scaling up access to genome-wide data”, Nucleic Acids Research, 42(1), D546–D552, 2014, Doi: 10.1093/nar/gkt979.
- UniProt-Consortium, “Ongoing and future developments at the Universal Protein Resource”, Nucl. Acids Res. 39(1): D214-D219, 2011, Doi: 10.1093/nar/gkq1020
- P. Müller, M. J. Donnelly, H. Ranson, “Transcription profiling of a recently colonised pyrethroid resistant Anopheles gambiae strain from Ghana”, BMC Genomics. 8(36), 2007, Doi: 10.1186/1471-2164-8-36
- D. Nikou, H. Ranson, J. Hemingway, “An adult-specific CYP6 P450 gene is overexpressed in a pyrethroid-resistant strain of the malaria vector, Anopheles gambiae”, Gene, 318, 91-102, 2003, Doi: 10.1016/s0378-1119(03)00763-7
- A. S. Haruna, K. Mavridis, J. Vontas, J. E. Eyo, “First incidence of CYP9K1, CYP6P4 and CYP6Z1 in Anopheles gambiae ss from Nigeria”, 2020, Doi: 10.21203/rs.3.rs-19996/v1
- H. Irving, J. Riveron, S. Inbrahim, N. Lobo, C. Wondji, “Positional cloning of rp2 QTL associates the P450 genes CYP6Z1, CYP6Z3 and CYP6M7 with pyrethroid resistance in the malaria vector Anopheles funestus”, Heredity. 109(6), 383–392, 2012, Doi: 10.1038/hdy.
- X. Chen, C. Tang, K. Ma, J. Xia, D. Song, X. W. Gao, “Overexpression of UDP-glycosyltransferase potentially involved in insecticide resistance in Aphis gossypii Glover collected from Bt cotton fields in China”, Pest Manag Sci. 76, 1371-1377, 2020, doi: 10.1002/ps.5648. PMID: 31605421.
- V. A. Ingham, C. M. Jones, P. Pignatelli, V. Balabanidou, J. Vontas, S. C. Wagstaff, J. D Moore, H. Ranson, “Dissecting the organ specificity of insecticide resistance candidate genes in Anopheles gambiae: known and novel candidate genes”, BMC Genomics. 15(1), 2014, doi: 10.1186/1471-2164-15-1018.
- C. Yang, D. J. McCart, S. Woods, K. G. Terhzaz, R. H. Greenwood, ffrench-Constant, and J.A. Dow, “A Drosophila systems approach to xenobiotic metabolism”, Physiol. Genomics, 30(3), 223-231, 2007, doi: 10.1152/physiolgenomics.00018.2007.
- I. Brigandt, “Essay: Homology”, The Embryo Project Encyclopedia (23 November 2011).
- A. L. Panchen, “Homology—history of a concept”, Novartis Foundation Symposia, 222, 5-18, 1999, doi: 10.1002/9780470515655.ch2. ISBN 9780470515655.
- S. B. Kumar, “Homology Modeling Lecture Note (ppt)”. https://www.slideshare.net/bharathpharmacist/homology-modeling-43813667.
- A. Kryshtafovych, T. Schwede, M. Topf, K. Fidelis, J. Moul, “Critical Assessment of Methods of Protein Structure Prediction (CASP), Round XIII. Proteins”, 2019, doi: 10.1002/prot.25823.
- M. O. Adebiyi, D. Falola, O. Olatunji, R. O. Ogundokun, E. A. Adeniyi, “Computational prediction of corynebacterium matruchotii Protein’s 3D structure reveals its capacity to bind to DNA domain site in the Malaria Vector, Anopheles”, International Journal of Engineering Research and Technology, 12(11), 1935–1940, 2019.
- S. F. Altschul, T. L. Madden, A. A. Schaffer, J. Zhang, Z. Zhang, W. Miller, D. J. Lipman, “Gapped BLAST and PSI-BLAST: a new generation of protein database search programs”, Nucl. Acids Res. 25(17), 3389-3402, 1997, Doi: 10.1093/nar/25.17.3389.
- H. Berman, K. Henrick, H. Nakamura, J. L. Markley. “The worldwide Protein Data Bank (wwPDB): ensuring a single, uniform archive of PDB data”, Nucl. Acids Res. 35(1), D301-D303, 2007, doi: 10.1093/nar/gkl971.
- M. A. Larkin, G. Blackshields, N. P. Brown, R. Chenna, P. A. McGettigan, H. McWilliam, et al. “ClustalW and ClustalX version 2”. Bioinformatics. 23(21), 2947-2948, 2007.
- F. Sievers, A. Wilm, D. G. Dineen, T. J. Gibson, K. Karplus, W. Li, “Fast, scalable generation of high-quality protein multiple sequence alignments using Clustal Omega”, Mol. Syst. Biology, 7(539), 2011, doi: 10.1038/msb.2011.75
- M. Biasini, S. Bienert, A. Waterhouse, K. Arnold, G. Studer, T. Schmidt, “SWISS-MODEL: modelling protein tertiary and quaternary structure using evolutionary information”, Nucl. Acids Research, 37(1), D387-D392, 2014, doi: 10.1093/nar/gkn750.
- R. A. Laskowski, M. W. MacArthur, D. S. Moss, J. M. Thornton. “PROCHECK: a program to check the stereochemical quality of protein structures”, J. Appl. Cryst. 26(2), 283-291, 1993, Doi: 10.1107/S0021889892009944
- R. A. Laskowski, V. V. Chistyakov, J. M. Thornton. “PDBsum more: new summaries and analyses of the known 3D structures of proteins and nucleic acids”, Nucl. Acids Research, 33(1), D266-D268, 2005, Doi: 10.1093/nar/gki001
- V. B. Chen, W. B. Arendall III, J. J. Headd, D. A. Keedy, R. M. Immormino, G. J. Kapral, L. W. Murray, J. S. Richardson, D. C. Richardson, “MolProbity: all-atom structure validation for macromolecular crystallography”, Acta Crystallogr. 66(1), 12-21, 2010, Doi: 10.1107/S0907444909042073