Using Supervised Classification Methods for the Analysis of Multi-spectral Signatures of Rice Varieties in Panama

Adv. Sci. Technol. Eng. Syst. J. 6(2), 552–558 (2021);
 DOI: 10.25046/aj060262
In this article supervised classification methods for the analysis of local Panamanian rice crops using Near-Infrared (NIR) spectral signatures are assessed. Neural network ( Multilayer Perceptron-MLP) and Tree based (Decision Trees-DT and Random Forest-RF) algorithms are used as regression and supervised classification of the spectral signatures by rice varieties, against other crops and by plant phenology (days after planting). Also, satellite derived spectral signature is validated with a field collected spectral model. Results suggest that MLP networks, either for regression or classification, were more efficient (RMSE of 8.78 and 0.068, respectively) than either tree based methods to regress/classify the rice spectral signature (RMSE of 19.37, 19.09 and 0.979, respectively). The validation made using satellite derived spectral signatures resulted in MLP models with RMSE of 0.216 and 7.318, respectively, leaving room for further improvement of the models. This work aimed to present a practical example of the employment of recent supervised classification algorithms for the determination of regression and classification models from reflectance spectral signatures in local rice varieties.
1. Introduction
The electromagnetic spectrum interacts with matter in a balanced relationship that indicates that the light reaching a body will be proportional to the light that is transmitted (measured through transmittance), absorbed (measured through absorbance) and reflected (measured through reflectance) in the body per in a unit of time. These measurements provide a signal that can be plotted, thus visually showing the relationship between the incident and reflected radiation flux.
These measurements are generally called spectral fingerprints or spectral signatures. Their measurement in agricultural crops is of special interest in precision agriculture, since they can provide a look into the crop health and phenological state. This information allows to determine how acceptable are the growth and development of the crop at a given planting stage.
This paper is an extension of the work originally presented in the 2019 XLV Latin American Computing Conference (CLEI) [1]. It will address other ML methods to achieve supervised classification of rice spectral signatures in Panama.
Supervised classification Machine Learning (ML) methods, such as Artificial Neural Networks (ANN), are commonly used for the analysis of Near-Infrared (NIR) spectral signatures [2]–[3]. ANN allow a way to identify relevant characteristics from a set of inputs (in this case spectral signal) and map them to corresponding output targets (physical or logical values associated with the object of under study). The model is learned through weight adjustments between connected units, called neurons, which are arranged in different layers. ANN are well regarded method. Especially in agriculture to determine quality parameters [4]–[5]. Deep neural networks
(DNNs), on the other hand a widely used in NIR spectral analysis [6]–[7]. DNNs are basically ANN with a vast number of hidden layers, which allow them to learn complex mapping relationships between inputs and outputs [8, 9].
Other ML methods rely on tree structures that partitions sample groups and the data set of features in order understand the relationship between labelled samples. Among these methods the most notable are: Decision Trees (DT) [10, 11] and Classification and Regression Trees (CART) and Random Forest (RF) [12]. The latter being of special interest since it is suited to understand massive data sets, by aggregating/averaging decision trees [13]. As ANNs and DNNs, tree based methods have been used to understand the relationships between sets of NIR spectra [14]–[15].
The objectives of this study are twofold: 1) Explore methods for the classification of spectral signatures of rice varieties, using networks and tree based algorithms; 2) Be able to train/test/validate a model that relates to field acquired spectral signatures with satellite signatures. The rest of this article is structured as follows: Section 2, presents the spectral database and the algorithms used for the classification. Section 3, shows the results obtained and discusses the implications to the model characterization. Section 4, provides overall conclusions of the article and focuses on suggesting future work that could be used as starting point for upcoming analysis.
2. Materials and Methods
2.1 Spectral Database
As described in [1], the spectral signatures were collected on-site from 3 different plots locations using a portable Spectroradiometer. The raw measurements were organized into a database consisting of signatures in the 350 nm to 1050 nm wavelength range (447 wavelengths points per signature). For each one of these 1453 signatures the database also contained information about the plot management, including crop variety, and more importantly days after planting (DAP), at which the spectral signature was collected.
The most prominent crop in the database is rice with 1348 signatures, with onion and pimento having less than 60 signatures, and other crops such as tomato, and maize having less than 15 signatures in total. Three local varieties of rice were more prominent in the plots: IDIAP-38, IDIAP 52-05 and FL137-11, the first two being experimental varieties from the Instituto de Investigaciones Agroindustriales de Panama (IDIAP), while the latter being a commercial variety.
Spectral signatures were normalized using unit variance scaling. Later, the total number of wavelengths (spectral features), was reduced from the original 447 dimensions by using Principal Components Analysis (PCA). Only the first 100 components were kept for each signature.
2.2 Satellite Derived Spectral Signature Database
This study made use of satellite images from PlanetScope, as a source of external signatures and among other reasons for models validation. The exact polygons, where field spectral signatures were acquired, were treated as a source for spectral signatures.
A successful comparison between the spectral signatures and their satellite derived counterpart was made by normalizing matching dates (or closest days available) in which there were also field measurements and by integrating (summarize) the reflectance values obtained in the field into the satellite 4 band format, as follows: blue (455 – 515 nm), green (500 – 590 nm), red (590 – 670 nm), and infrared (780 – 860 nm). Finally, all the satellite derived spectral signatures were organized into a database for later use.
2.3 Regression and Supervised Classification of Spectral Signatures
Since one of the goals of this study was to find a model capable of predicting the days after planting (DAP), just by using the spectral signatures two families of models were selected. The first being a (continuous) regression models family in which the targets were numerical values representing the DAP. The second being a (discrete) binary classification model family, which makes possible to make rice predictions from non-rice related signatures, coded as 0 and 1,
Three regression models were tested to predict the DAP of the signatures:
- Multilayer Perceptron Regressor (MLPR)
- Decision Tree Regression (DTR)
- Random Forest Regression (RFR)
Two classification models were test to predict the rice and nonrice:
- Multilayer Perceptron Classification (MLPC)
- Random Forest Classification (RFC).
In all models, spectral signatures were divided as 70% and 30% for training and testing purposes, respectively.
2.4 Cost functions and Evaluation Metrics
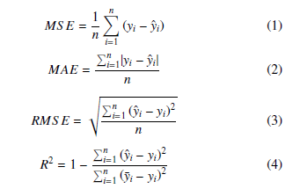
Two cost functions were compared for all models, the Mean Square Error – MSE (1), and the Mean Absolute Error – MAE (2). Two measures were used to evaluate the performance of all models, the Root Mean Square Error – RMSE (3), and the coefficient of determination,
For binary classification models, evaluation of their performance was made via a different set of metrics. Generally, the performance of these models are tied to the model capacity to provide true predictions: true positive (TP) and true negative (TN), but also, prediction errors or false prediction is accounted via: false positive (FP) and false negative (FN). These counts are organized into a confusion matrix, shown in Table 1.
Table 1: Theoretical confusion matrix between actual and predicted classes.
| Positive | Negative | |
| Positive
Prediction Negative |
TP | FP |
| FN | TN |
Using the confusion matrix, metrics that use the true predictions and prediction errors can be determined, among them:
- Accuracy: a measure of the number of true predictions made by the model. That can be calculated with the following
formula: #TP+##TNTP++##TNFP+#FN .
- Precision: a measure that can be used to evaluate the proportion of positive predictions that were correctly classified. It can be calculated using the formula: #TP#TP+#FP.
- Sensitivity (Recall): a measure that can be used to evaluate the proportion of the actual positive predictions (observations) that were correctly classified. It can be calculated with the formula: #TP#TP+#FN .
- F1 Score: a measure of the model accuracy, but considering both the precision and recall. In general, a model can have a bad F1 Score (closer to 0) or a good one (closer to 1). It can be calculated employing the formula: 2 ∗ PrecisionPrecision+∗RecallRecall.
2.5 Software Implementation
All plots were made using matplotlib. Database normalization, dimensionality reduction, regressions and classification methods and their errors were implemented using the Scikit-Learn library in Python [16]. The trees structures generated by Decision Tree and Random Forest algorithms were plotted using graphviz (https://graphviz.readthedocs.io/).
3. Results and Discussion
3.1 Characteristics of the Spectral Signatures
Figure 1 shows the complete set of reflectance spectral signatures present in the database. Figure 2 shows the reflectance spectral response of the local varieties for the Juan Hombron plot.
Figure 2A, shows the spectral signal variation of the FL137-11 material, from 48 to 116 DAP. Figure 2B, shows the variation of the IDIAP-38 material in 13 and 19 DAP, and also the variation of the IDIAP 52-05 material from 13 to 116 DAP. In all cases, the spectral signature has less variation in the visible range (400-700 nm) and more activity in the near-infrared part of the spectrum (700-100 nm) as the DAP increases.
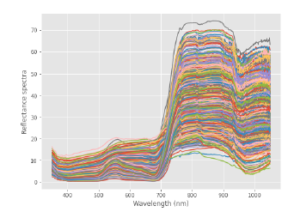
Figure 1: Rice Spectral Signatures in the Database
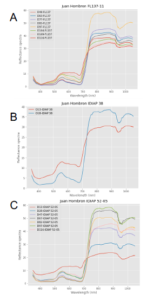
Figure 2: Spectral signatures of Rice varieties in Juan Hombron. A) FL137-11, B) IDIAP 38 and C) IDIAP 52-05.
Figure 3 shows the average spectra of rice (red) as compared against other crops in the database. It is notable that rice and onion have similar spectral signatures, with lower reflectance values in the NIR region. While tomato, maize and onion have a similar signature with higher reflectance values in the same range.
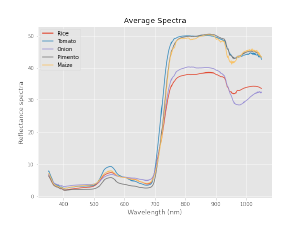
Figure 3: Comparison between Spectral Signatures of Crops in the Database
3.2 Regression Models applied to Rice Spectral Signatures
The Multilayer Perceptron Regressor network was set up to have
500 neurons in the hidden layer, tolerance of 1e−4 and using as ADAM as optimizer. For the Decision Tree Regressor, MSE was set to be the criterion, and the default settings were followed. The Random Forest Regressor was set up to build 50 trees (estimators), as in in the Decision tree, the default settings were followed. Error metrics for the three algorithms are shown in Table 2.
Table 2: Resulting Errors for Regression Models
| Metrics | MLPR | DTR | RFR |
| R2 | 0.92 | 0.56 | 0.57 |
| MAE | 6.148 | 10.807 | 13.783 |
| MSE | 77.095 | 375.400 | 364.779 |
| RMSE | 8.780 | 19.375 | 19.099 |
The MLPR model achieved the higher R2 with 0.92 and the lower RMSE values with 8.78. The two tree based regression models showed to behave similarly with R2 of 0.56 and 0.57, respectively. Also, having RMSE values of around 19, in both cases. Figure 4 shows the loss curve per iterations for the MLPR model, with a final loss of 0.08. The network training was stopped after 1492 iterations and resulted in an overall MLP training score of 0.99.
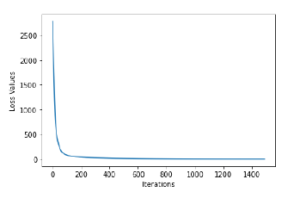
Figure 4: Loss Curves for MLPR Model
3.3 Classification Models applied to Rice Spectral Signatures
The Multilayer Perceptron Classifier network was set up to have 200 neurons in the hidden layer, tolerance of 1e−4 and using ReLU as an activation function. As for the Random Forest Classifier was set up to build 50 trees (estimators), here also, the default settings were followed. Error metrics for the two algorithms are shown in Table 3.
Table 3: Resulting Errors for Classification Models
| Metrics | MLP Classifier | RFC |
| R2 | 0.94 | 0.47 |
| MAE | 0.005 | 0.039 |
| MSE | 0.005 | 0.039 |
| RMSE | 0.068 | 0.197 |
| Acc. | 0.995 | 0.961 |
| F1 Score | 0.998 | 0.979 |
The MLPC model achieved a better R2 than the RFC, with a value of 0.94 and the lower RMSE of the two with a value of 0.006. The two algorithms perform in the 90% having accuracy values of 0.99 and 0.96, respectively. Also having high F1 scores, with values of 0.99 and 0.97, respectively. Figure 5 shows the loss curve per iterations for the MLPC model, with a final loss of 0.006, after 166 iterations.
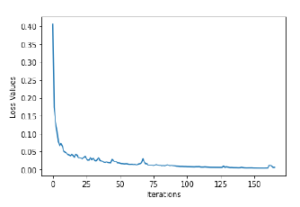
Figure 5: Loss Curve for MLPC Model
Figure 6 shows the final tree structure of the RFC. In warmer colors it shows the statistically significant decision nodes. In general, the RFC models were not as accurate as MLPC models, but they help us determine the most relevant wavelengths for classification, Table 4 provides a list of the Top-5 wavelengths that could be used as to classify the signatures. Interestingly, all these wavelengths are in the visible range between 400 and 600 nm.
A partial conclusions that can be addressed is that when predicting the DAP from the spectral signatures, it is very important to reduce the parameters to increase the precision of the model. It is important to notice that also, that when classifying crops (rice or other), there was no need to apply PCA since the model is quite accurate and has fewer losses. It even starts at a loss value of 0.4, close enough to 0, in the first iterations, as shown in Figure 5.
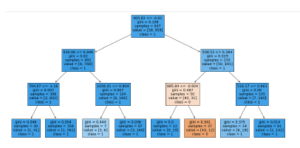
Figure 6: Resulting Tree and Rules learned by the Random Forest Classifier
Table 4: Summary of Top-5 Predictors from RFC model
| ID | Wavelength | Importance (P-value) |
| 111 | 534 | 0.031 |
| 95 | 508 | 0.028 |
| 118 | 545 | 0.023 |
| 34 | 409 | 0.023 |
| 139 | 579 | 0.028 |
3.4 Regression and Classification of Satellite Derived Signatures
The database for this experiment was comprised of the satellite spectral signatures and also the field (on site) spectral signals. The satellite spectral signatures are the ones compared using the Spectral Angle Mapper (SAM) method, as described in [1]. As for the (on site) spectral signals they had to be integrated to four wavelength bands that are used to represent satellite images. Table 5, shows the distribution of the spectral signature in the expanded database, with both spectral signatures collected on site and from the satellite image.
Table 5: Distribution of Spectral Signatures
| Signature Type | Quantity |
| Rice spectral signatures (on site) | 459 |
| Rice spectral signatures (from satellite) | 1303 |
| Forest & road spectral signatures (from satellite) | 337 |
A neural network model capable of distinguishing between the rice, and not-rice (namely, forest and road satellite signatures) was trained using a Multilayer Perceptron Classifier. The network was set up to have 600 neurons in the hidden layer, tolerance of 1e−4 and using ReLU as an activation function. Figure 7A shows the loss curve for the MLPC model, having a final loss value of 0.11 after 733 iterations.
Subsequently, a model was trained with the field spectral signatures reduced to 4 bands and the satellite spectral signatures. The field collected spectral signatures were used for training and testing (calibration), while the satellite spectral signatures were used for validation of the model. A Multilayer Perceptron Regressor was used. The network was set up to have 1000 neurons in the hidden layer, tolerance of 1e−4 and using as ADAM as optimizer.
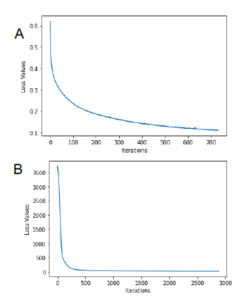
Figure 7: Model Loss Curve fror the MLPC (A) and MLPR (B) methods
Figure 7A shows the loss curve for the MLPC model, having a final loss value of 0.11 after 733 iterations. Figure 7B shows the loss curve of the MLPR model, it had final loss value of 23.74 after 2884 iterations.
As it is shown in Table 6, the MLPR model achieved the highest R2 with 0.88 and an overall score of 0.90. However, the MLPC model had a lower RMSE value with 0.216.
Table 6: Resulting Errors for Satellite Derived Models
| Metrics | MLPC | MLPR |
| R2 | 0.711 | 0.886 |
| MAE | 0.046 | 53.564 |
| MSE | 0.046 | 5.101 |
| RMSE | 0.216 | 7.318 |
The validation of the model, using satellite spectral signatures resulted in having a R2 of 0.54, a MAE of 14.998, MSE of 413.237 and RMSE of 20.3282.
A result from this subsection is that when validating the model to predict days after planting , the error is still quite large. It might be possible to make it lower by having a larger amount of field spectral signatures, since this would give more information to the model longer learning time .
4. Conclusions
The aim of this work was to be able to train supervised classification Machine Learning models in order to further understand rice reflectance signatures. A database of spectral signatures collected using a portable spectroradiometer and a set of satellite image derived signatures were employed as input for these models. As output or targets for the training of these models, few variables were used, among them: days after planting (DAP), and the possibility of distinguishing rice from other crops or from other geographical features.
In order to develop these regression and classification models, neural network based algorithms (Multilayer Perceptrons) and tree based algorithms (decision trees and random forest), were used.
For both cases, regression and classification of rice spectral signatures, the use of Multilayer Perceptron models are recommended. Our results suggest that MLPR is the best method to make a model able to regress on the DAP just from the spectral signatures. For the classification of rice and non-rice signatures MLPC was one again the best resulting method. The tree based models, although providing less useful models, were able t suggest a list of most relevant predictors and a visualization of their results. It seems that the most useful wavelengths to build this models are found mostly in the 500-600 nm wavelength range, which corresponds to the green and yellow colors of the visible spectrum. These wavelengths are in line to changes in the panicle, as described by [17].
For the work on satellite derived signatures both MLPC and MLPR show interesting results over 0.7 and 0.88, respectively. However, the error metrics on the MLPR model are quite large. A large error that can be attributed to normalization effect between satellite and on site measurements, and total reflectance correction that exist between both spectral signatures. Suggesting that more samples should be added to the model to produce a more robust model.
One of the limitations of this study was the relatively small size of the database of spectral signatures employed. It is known that Machine Learning algorithms need more samples in order to have robust results. The need of more spectral signatures is evident by the poor generalization obtained, especially for the validation of satellite derived spectral signals.
For future work, few changes to the approach employed should be done. For instance, having different percentages in the training and testing splits. This work shows results only with 70%/30% split. It could be beneficial to test the limit of prediction by changing the percentages and/or using cross-validation techniques. Second, a class imbalance is evident in the spectral database, due to the focus on rice signatures by the original objective , leaving other crops or other spectral signatures astray. In order to make this database more balanced pseudo replicates need to be made from the non-rice signatures. In [18], the author presents an interesting approach for feature selection and replication using Variational Auto-Encoder (VAE) type of network, that could be pursued. Also in this line, the author presents a complete framework for Data Augmentation (DA) approach for convolutional neural network (CNN) based deep learning chemometrics [19], that seems worth exploring for this application. Third, recent literature shows a shift from deriving spectral signals from satellite images, to working directly over the Hyperspectral images (HSI) [20]. Even using deep learning frameworks for identifying soil characteristics [21], rice varieties [22], rice phenology [23], and even focusing on data imbalance in the image of domain [24].
The value of this work rest about on the fact that it presents a practical example of using supervised classification algorithms for the determination of regression and classification models from reflectance spectral signatures of a local crop. This study provides a basis for future works in deep learning based on chemometrics, and in particular the possibility of predicting crop conditions and characteristics from spectral signatures or satellite images.
Conflict of Interest
The authors declare no conflict of interest.
Acknowledgment
The authors wish to thank the Secretar´ıa Nacional de Ciencia, Tecnolog´ıa e Innovacion de Panam´ a (SENACYT)´ for its support through the project IDDS 15-184. The Sistema Nacional de Investigacion (SNI) of SENACYT supports research´ activities by E.Q-M., J.R.F. and J.E.S.-G.. The authors acknowledge administrative support provided by Universidad Tecnologica´ de Panama (UTP).´
- J. E. Sa´nchez-Gala´n, J. S. Reyes, J. U. Jime´nez, E. I. Quiro´s-McIntire, J. R. Fa´brega, “Supervised Classification of Spectral Signatures from Agricultural Land-Cover in Panama Using the Spectral Angle Mapper Algorithm,” in 2019 XLV Latin American Computing Conference (CLEI), 1–7, IEEE, 2019, doi: 10.1109/CLEI47609.2019.235101.
- W. Wang, J. Paliwal, “Generalisation performance of artificial neural networks for near infrared spectral analysis,” Biosystems Engineering, 94(1), 7–18, 2006, doi:10.1016/j.biosystemseng.2006.02.001.
- X. Meng, X. Meng, “The BP Neural Network Design Applied on the Classifica- tion of the Apples,” in 7th International Conference on Education, Management, Information and Mechanical Engineering (EMIM 2017), Atlantis Press, 2017, doi:10.2991/emim-17.2017.37.
- A. C. Mutlu, I. H. Boyaci, H. E. Genis, R. Ozturk, N. Basaran-Akgul, T. Sanal, K. Evlice, “Prediction of wheat quality parameters using near-infrared spectroscopy and artificial neural networks,” European food research and tech- nology, 233(2), 267–274, 2011, doi:10.1007/s00217-011-1515-8.
- M. Abdipour, M. Younessi-Hmazekhanlu, S. H. R. Ramazani, et al., “Artificial neural networks and multiple linear regression as potential methods for mod- eling seed yield of safflower (Carthamus tinctorius L.),” Industrial crops and products, 127, 185–194, 2019, doi:10.1016/j.indcrop.2018.10.050.
- B. T. Le, “Application of deep learning and near infrared spectroscopy in cereal analysis,” Vibrational Spectroscopy, 106, 103009, 2020, doi:10.1016/j.vibspec. 2019.103009.
- X. Zhang, T. Lin, J. Xu, X. Luo, Y. Ying, “DeepSpectra: An end-to-end deep learning approach for quantitative spectral analysis,” Analytica chimica acta, 1058, 48–57, 2019, doi:10.1016/j.aca.2019.01.002.
- Q. V. Le, “A Tutorial on Deep Learning Part 1: Nonlinear Classifiers and The Backpropagation Algorithm,” Google Brain, 2015.
- Q. V. Le, “A tutorial on deep learning part 2: Autoencoders, convolutional neural networks and recurrent neural networks,” Google Brain, 1–20, 2015.
- S. L. Salzberg, “C4.5: Programs for Machine Learning by J. Ross Quinlan. Morgan Kaufmann Publishers, Inc., 1993,” Machine Learning, 16(3), 235–240, 1994, doi:10.1007/bf00993309.
- C. Kingsford, S. L. Salzberg, “What are decision trees?” Nature biotechnology, 26(9), 1011–1013, 2008, doi:10.1038/nbt0908-1011.
- L. Breiman, J. H. Friedman, R. A. Olshen, C. J. Stone, “Introduction To Tree Classification,” in Classification And Regression Trees, 18–58, Routledge, 2017, doi:10.1201/9781315139470-2.
- G. Biau, E. Scornet, “A random forest guided tour,” Test, 25(2), 197–227, 2016, doi:10.1007/s11749-016-0481-7.
- M. Clavaud, Y. Roggo, K. De´gardin, P.-Y. Sacre´, P. Hubert, E. Ziemons, “Global regression model for moisture content determination using near-infrared spectroscopy,” European journal of pharmaceutics and biopharmaceutics, 119, 343–352, 2017, doi:10.1016/j.ejpb.2017.07.007.
- F. B. de Santana, W. B. Neto, R. J. Poppi, “Random forest as one-class classifier and infrared spectroscopy for food adulteration detection,” Food chemistry, 293, 323–332, 2019, doi:10.1016/j.foodchem.2019.04.073.
- F. Pedregosa, G. Varoquaux, A. Gramfort, V. Michel, B. Thirion, O. Grisel, M. Blondel, P. Prettenhofer, R. Weiss, V. Dubourg, J. Vanderplas, A. Passos, D. Cournapeau, M. Brucher, M. Perrot, E. Duchesnay, “Scikit-learn: Machine Learning in Python,” Journal of Machine Learning Research, 12, 2825–2830, 2011.
- J. Serrano, J. Fa´brega, E. Quiro´s, J. Sa´nchez-Gala´n, J. U. Jime´nez, “Ana´lisis prospectivo de la deteccio´n hiperespectral de cultivos de arroz (Oryza sativa L.),” KnE Engineering, 69–79, 2018, doi:10.18502/keg.v3i1.1414.
- Q. Wang, L. Li, X. Pan, H. Yang, “Classification of Imbalanced Near- infrared Spectroscopy Data,” in 2020 12th International Conference on Ad- vanced Computational Intelligence (ICACI), 577–584, IEEE, 2020, doi: 10.1109/icaci49185.2020.9177516.
- E. J. Bjerrum, M. Glahder, T. Skov, “Data augmentation of spectral data for convolutional neural network (CNN) based deep chemometrics,” arXiv preprint arXiv:1710.01927, 2017.
- F. Arias, , M. Zambrano, K. Broce, C. Medina, H. Pacheco, Y. N. and, “Hy- perspectral imaging for rice cultivation: Applications, methods and chal- lenges,” AIMS Agriculture and Food, 6(1), 273–307, 2021, doi:10.3934/ agrfood.2021018.
- J. Padarian, B. Minasny, A. McBratney, “Using deep learning to predict soil properties from regional spectral data,” Geoderma Regional, 16, e00198, 2019, doi:10.1016/j.geodrs.2018.e00198.
- S. Weng, P. Tang, H. Yuan, B. Guo, S. Yu, L. Huang, C. Xu, “Hyperspectral imaging for accurate determination of rice variety using a deep learning net- work with multi-feature fusion,” Spectrochimica Acta Part A: Molecular and Biomolecular Spectroscopy, 118237, 2020, doi:10.1016/j.saa.2020.118237.
- M. Liu, X. Liu, L. Wu, X. Zou, T. Jiang, B. Zhao, “A modified spatiotemporal fusion algorithm using phenological information for predicting reflectance of paddy rice in southern China,” Remote Sensing, 10(5), 772, 2018, doi: 10.3390/rs10050772.
- J. F. R. Rochac, N. Zhang, L. Thompson, T. Oladunni, “A Data Augmentation- assisted Deep Learning Model for High Dimensional and Highly Imbal- anced Hyperspectral Imaging Data,” in 2019 9th International Conference on Information Science and Technology (ICIST), 362–367, IEEE, 2019, doi: 10.1109/icist.2019.8836913.