
Students’ Preparedness to Learn in e-Learning Environment and their Perception on The MPKT Lecturers’ Readiness to Manage Online Class
Volume 6, Issue 2, Page No 387-398, 2021
Author’s Name: Titin Siswantining1,a), Herley Shaori Al-Ash1, Kasiyah Junus2, Lia Sadita2, Diana Nur Vitasari1, Luthfiralda Sjahfirdi3, Harinaldi4
View Affiliations
1Department of Mathematics, Universitas Indonesia, Depok, 16424, Indonesia
2Faculty of Computer Science, Universitas Indonesia, Depok, 16424, Indonesia
3Department of Biology, Universitas Indonesia, Depok, 16424, Indonesia
4Department of Mechanical Engineering, Universitas Indonesia, Depok, 16424, Indonesia
a)Author to whom correspondence should be addressed. E-mail: titin@sci.ui.ac.id
Adv. Sci. Technol. Eng. Syst. J. 6(2), 387-398 (2021); ![]() DOI: 10.25046/aj060245
DOI: 10.25046/aj060245
Keywords: E-Learning, Student’s Learning Perception, Clustering, Readiness

Export Citations
This study has two objectives: to determine the level of readiness of first-year undergraduate students at the Universitas Indonesia (UI) and to investigate student’s perception of MPKT (Integrated Character Development course) lecturers’ readiness to manage online learning class. Proportional cluster sampling was applied, and 1466 freshmen from thirteen faculties participated. Data clustering and imputation of missing values were utilized to analysis the data. Clustering based on gender, faculty, previous e-learning experience ** were applied. The study shows that students perceived themselves as being ready to learn in an e-learning environment except Computer Science students who have been more exposed to e-learning and implemented online collaborative learning. Most students agree that MPKT lecturers are able to teach well except those of the Faculty of Computer Science, Faculty of Pharmacy, and Faculty of Social and Political Sciences who think that the teaching ability of lecturers need to be improved. Recommendations and future research topics are proposed based on the study results and in-depth interviews with some experienced online lecturers.
Received: 11 January 2021, Accepted: 23 February 2021, Published Online: 17 March 2021
1. Introduction
The progress of e-learning systems is influenced by advances in information and communication technology. The advantages of e-learning for learners include increased accessibility to information, better content delivery, personalized instruction, content standardization, accountability, on-demand availability, self-pacing, interactivity, confidence, and increased convenience [1].
E-learning has moved from several generations. The first generation in the range 1994-1999 used e-learning by re-assembling offline teaching material to online teaching material format. The development of the second generation from 2000 to around 2003 was supported by better internet access so that the idea emerged to create a virtual learning environment. The third generation (to date) the development of e-learning systems is characterized by massive collaboration and socialization learning environment, project-based learning, and reflective practices such as creating e-portfolio accounts, tutorial repositories in learning in the form of blogs and program code repositories that allow people to implement theories from teaching material. The third generation is also affected by the massive use of mobile applications [1]. Research on e-learning covers a broad discussion. Not only research in terms of information systems such as student perceptions [1] and the success factors of e-learning development [2] ,but the development of e-learning system employs machine learning methods [3]. Classification and clustering methods can be further used to explore insights based on student learning experiences. The results of processing machine learning methods can be reported to the university or faculty to improve the quality of teaching services.
E-learning is defined as an approach to teaching and learning, representing all or part of the educational model applied, that is based on the use of electronic media and devices as tools for improving access to training, communication and interaction and that facilitates the adoption of new ways of understanding and developing learning [4]. E-learning is a choice of learning environment system where face-to-face activities (in learning activities) cannot be carried out either due to space and time limitations or force majeure events such as the covid19 pandemic that is now being faced. Learning activities at the university have now focused on the method of distance learning by implementing an e-learning system [5]. UI has implemented an e-learning management system (emas 1). Subjects, assignments, and discussions related to each subject based on collaborative learning have been implemented in emas [6]. Apart from the superiority of the emas features, each student has a different level of readiness in learning to use e-learning systems and we are also interested in knowing each student’s perceptions of readiness in learning online. This study aims to investigate freshmen’ (first semester student) readiness for e-learning, and their perception to the MPKT class in terms of the lecturers’ readiness and the suitability of the syllabi. The main contribution of this study is grouping the level of readiness of students obtained from the e-learning readiness questionnaire adapted from [7] using clustering algorithm. Due to the adapted questionnaires is not published yet, and the original one was developed by other authors. We respect the privacy of student personal information so we remove the attributes of student personal information from the data we share. In addition, only those who signed the inform consent letter are included as respondents of the current study. The contribution of this research are:
- Grouping the level of readiness of students obtained from the e-learning readiness questionnaire using a clustering algorithm.
- We are sharing e-learning readiness questionnaire data and responses from each student for further research.
- We are also to answer these three research questions as an additional contribution as follows:
- What is the level of readiness of first-year students to study in an e-Learning environment?
- How is the suitability of the learning process of MPKT with the syllabus?
- What is the students’ perception of MPKT lecturer’s readiness to teach online?
2. Literature Study
2.1. E-learning Critical Success Factor and Variables
There are several studies that discuss the critical success factor (CSF) for e-learning. Research conducted by [8] states that an individual’s experience in using computers is positively associated with higher learning performance using e-learning. Both intrinsic motivation [9] and extrinsic motivation [10] play an important role both for teachers and students in using e-learning systems. Research conducted by [11] classifies CSF into four main factors:
- Student observation for instructor characteristics (teaching style, bringing attitude to students, technology control, etc).
- Student characteristics (motivation, content perception, collaboration, etc).
- Ease of use of technology (easy access to e-learning systems, internet speed, etc).
- Institutional support (technical support, availability of teaching materials, etc).
CSF that has been mentioned is deepened into a perception of students’ readiness for learning where this perception is influenced by several variables. Research by[12]shows that age, gender, previous experienceof computers, technology acceptance, and individual learning styles as the most influential factors in technology acceptance by students because students need to transition from learning conditions, require face-to-faceactivities to learning conditions using e-learning.
Although the third generation is the readiest generation to use e-learning, that does not mean everyone shares the same experience. Based on this, we compiled a questionnaire adapted from [7], [13] consisting of three main components:
- Management of the environment in learning activities using the e-learning system.
- Interaction with course materials.
- Interaction with the e-learning community.
The participants of the study are first year students enrolled in the Matakuliah Pengembangan Kepribadian Teritegrasi (MPKT) course (Integrated Character Development Course), a compulsory course offered at the first semester.
2.2. Clustering
Clustering is one of the most common exploratory data analysis techniques used to get an intuition about the structure of the data. A cluster refers to a collection of data points aggregated together because of certain similarities. It can be defined as the task of identifying subgroups in the data such that data points in the same subgroup (cluster) are very similar while data points in different clusters are very different. In other words, the clustering algorithm tries to find homogeneous subgroups within the data such that data points in each cluster are as similar as possible according to a similarity measure such as euclidean-based distance or correlation-based distance [14]. The decision of which similarity measure to use is application-specific. Unlike supervised learning, clustering is considered an unsupervised learning method since there is no supplied ground truth from the data which is known as the target variable in supervised learning. Further inspection allows only data structure investigation based on data points grouping into definitive subgroups (clusters) [15].
2.2.1. K-Means Clustering
K-means is one of the clustering algorithms, a simple partitional clustering algorithm that tries to discover K non-overlapping clusters where K is the number of assigned cluster. These clusters contain centroid (a cluster centroid is typically the mean of the points in that cluster). If there are K clusters (Student Readiness to Manage Online Class Cluster), there will be also K centroids [16], [17]. According to Figure 1, the K-means Clustering algorithm can be summarized as the following steps [18] :
- Determine the number of desired clusters.
- Establish the centroid coordinate.
- Determine the distance of each observation to the centroid.
- Group the observation according to the minimum distance.
Suppose is the data set to be clustered. K-means can be expressed by an objective function that depends on the proximities of the data points to the cluster centroids as given on equation 1.
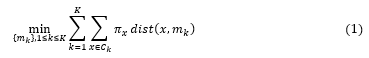 According to equation 1 [16] :
- stand as the weight of x.
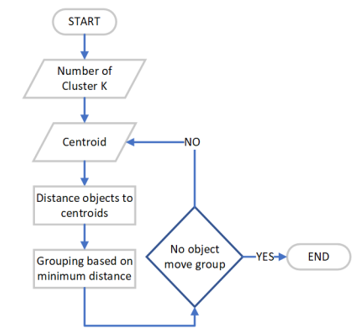 Figure 1: K-Means Clustering Algorithm
- is the number of observation assigned to cluster Ck
- is the centroid of cluster Ck . The number of centroid, matches the K provided by user.
- is the cluster number. Note that this K value is set by user.
- The function dist aim to calculate distance between observation x and centroid where 1≤k≤ K.
Based on Figure 1, iteration can stop when there are no observations that move to another cluster. However, this method can lead to an infinite loop because there is at least one observation that is constantly moving clusters. In addition to the above conditions, one may add a limit (specifying iteration counter) to the number of iterations allowed in the k-means algorithm. Depending on which conditions are found first to stop the loop.
2.2.2. Cluster Number Evaluation
Evaluation of the number of clusters aims to find the number of clusters that are considered optimal for the k-means clustering algorithm, given the K value in the k-means clustering algorithm is determined by the user. This research employs elbow methods to evaluate the cluster numbers.
 The idea of elbow methods is to compute variance between each data within each cluster towards the cluster mean. There’s a point at which the clusters are at an optimum that point after which adding more clusters will not make a huge difference to the final number of clusters [19].
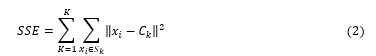
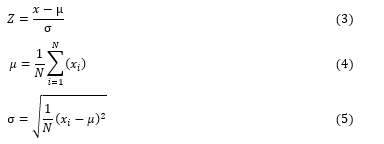
The k-means clustering algorithm will run for a range of values of K and each value of K calculates the sum of squared errors (SSE) using equation 2. According to equation 2, K is the current cluster counter, xi is the current observation, Ck is the cluster mean and Sk stands for current cluster. In other words, means the specific observation within cluster Sk. The loop carried on until the total number of cluster counter (K) is reached [20] . The maximum error value is found when the number of clusters is equal to 1 (all observations inside one big cluster). This happens because each observation has a difference that is not equal to zero to the average value of the cluster. The minimum error value is found when the number of clusters is equal to the number of observations because the distance of one observation to the cluster average value is zero. Observations using the elbow method are classified as subjective observations. One cannot directly define curves that are steep enough so that the number of clusters is said to be optimal.
2.3. Standardization
Standardization is the process of putting different variables on the same scale. This process allows us to compare scores between different types of variables. Standardizing tends to make the training process well behaved because the numerical condition of the optimization problems is improved. For example, suppose we have two-dimensional data that scatter around the first quadrant of the cartesian coordinate. Then we compute the mean value of the data. We then subtract the datum value with the mean value. After we have done those steps, the data will move towards (0,0) coordinate, providing better visualization, and reduce the variability of the data [21].
2.3.1. Z-Score
The standardization method used in this research is the z-score. Further explanation is depicted using equation 3. A z-score indicates how many standard deviations an element is from the mean [22]. According to equation 3, the Z variable is the data. After processed using equation 3, the data will have a mean score equal to zero and a standard deviation equal to 1. Note that xi is the currently processing datum, µ is the mean score of the data (we have to calculate the mean score first) as given at equation 4 and σ is the standard deviation of the given data (we also have to calculate the data standard deviation first) as given at equation 5.
 The z-score method is applied to every attribute in the dataset except for the identity attributes because we argue that cluster analysis conducted on the identity attribute occurs based on the cluster results obtained. The clustering stage in this study aims to create a response group given by participants regardless of the identity of the participant. The k-means algorithm works by comparing the similarity of the attributes of each observation to the centroid of each cluster, the more similar the value of observation to a cluster, then the observations are considered as members of the cluster.
3. Methodology
3.1. Data Proportion and Initial Observation
3.1.1. Questionnaire Data
The questionnaire distributed to participants consisted of four parts:
- Participant’s identity (given at Table 1).
- Managing the e-learning environment (given at Table 2).
- Interaction with teaching material (given at Table 3).
- Interaction with e-learning communities (given at Table 4).
Table 1: Participants Identity
| No. | Questions |
| 1. | Gender |
| 2. | Senior High School Origin |
| 3. | Admission Path |
| 4. | Faculty |
| 5. | Faculty Priority |
| 6. | Online Learning Experience |
| 7. | City of Origin |
| 8. | Province of Origin |
Table 2: Managing E-Learning Environment
| No. | Questions |
| 1. | Upload and download information and learning resources. |
| 2. | Use search engines effectively. |
| 3. | Skillfully use a web-browser to achieve learning goals. |
| 4. | Utilize various software applications to improve learning outcomes. |
| 5. | Using technology to help understand new things. |
| 6. | Study in a disciplined and scheduled manner. |
| 7. | Adjust to the online learning environment. |
| 8. | Using technology to support the learning process. |
| 9. | Identify the things needed to complete the task. |
| 10. | Search for information on the internet intelligently. |
| 11. | Take advantage that exist in online discussion forums. |
| 12. | Make use of the online learning system. |
| 13. | Work on assignments independently. |
| 14. | Implement a problem-solving strategy. |
| 15. | Scale priorities for tasks that must be completed at the same time. |
| 16. | Utilizing feedback for self-evaluation. |
| 17. | Choose the appropriate technology to complete the task. |
| 18. | Solve problems that arise in the use of computers. |
| 19. | Design task completion strategies. |
| 20. | Look at yourself positively as a learner. |
| 21. | Balancing learning commitments, social life, and family. |
| 22. | Take advantage of discretion in the online learning environment. |
| 23. | Conduct a process of reflection (self-assessing). |
| 24. | Assess the process and self-learning strategy. |
Referring to table 1, the Admission path is the UI entry point taken by each participant. The available admission path options are:
- This admission path is known as the invitation path, considering the beginning of this reception based on invitations sent to schools. With the high enthusiasm of the school and students taking partin the acceptance based on report card grades, the invitation path has developed. In the Regular S1 (bachelor), the Ministry of Education and Culture through the Institute for Higher Education Entrance Tests(LTMPT) opens the opportunity for all national curriculum schools to follow this path with the terms andconditions stipulated in an activity called the National Higher Education Entrance Test (SNMPTN). Theuse of the invitations admission path was cancelled because schools that have national school principalnumber (NPSN) and meet the SNMPTN requirements allowed to fill out the data without the need to getan invitation.
- Students who do not meet the requirements to register for academic achievement throughthe SNMPTN admission path can register in the written examination path (SBMPTN). Restrictions on theyear of graduating from senior high school/equivalent only apply to S1 Regular (maximum 3 years) andS1 International Class (5 years). Whereas the parallel Vocational and S1 Programs receive senior highschool/equivalent alumni without limitation of the senior high school/equivalent year of graduation.
- Universitas Indonesia Learning Opportunities and Equitable Learning Opportunities or so-calledPPKB UI are new admissions paths based on academic achievement by students while studying in theirschools (senior high school/equivalent). PPKB admission path is used before the SNMPTN period.
- Talent Scouting. Report card selection for the Vocational Program and the Parallel S1 Program is calledthe Achievement and Equal Learning Opportunities program, while the selection report card for the S1International Class is Talent Scouting.
- UI Entrance Selection (SIMAK UI) is an integrated UI entrance examination held by UI forprospective students who wish to study at UI. Educational programs opened at SIMAK UI start fromthe Vocational Program (D3), Regular Bachelor, Parallel Class, Extension / Parallel Bachelor for D3graduates, Professionals, Specialists, Masters, and Doctors.
Table 3: Interaction with Teaching Material
| No. | Questions |
| 1. | Linking initial knowledge with newly learned knowledge. |
| 2. | Determine relevant teaching material. |
| 3. | Learning teaching material in various formats (video, audio, images) |
| 4. | Read and write according to learning needs. |
| 5. | Take the essence of various information file formats (video, audio, images). |
| 6. | Compare various sources to test the accuracy of information. |
| 7. | Access information from various sources. |
| 8. | Able to distinguish between relevant information and what is not. |
| 9. | Evaluate information search results critically. |
| 10. | Be aware of understanding gaps. |
| 11. | Mixing various learning resources for sharing knowledge. |
| 12. | Use other sources of information (not limited to online communities or available technology). |
| 13. | Assessing websites related to teaching materials. |
| 14. | MPKT learning is carried out following Learning Reference Unit (SAP). |
| 15. | The task and learning task load of MPKT is following semester credit (SKS). |
Table 4: Interaction with E-Learning Communities
| No. | Questions |
| 1. | Respect other participants when responding to opinions. |
| 2. | Looking for information both independently and with the help of others. |
| 3. | Always apply internet ethics. |
| 4. | Communicate with others in online classes. |
| 5. | Consider and appreciate feedback from other participants. |
| 6. | Share personal experiences that are relevant to the topic. |
| 7. | Collaborate to understand the lesson. |
| 8. | Open to criticism. |
| 9. | Appreciate the role of the lecturer as a learning facilitator. |
| 10. | Contribute by proposing new ideas in discussions. |
| 11. | Provide responses that are clear, precise, and unambiguous (multi-interpretation). |
| 12. | See themselves as part of the learning community. |
| 13. | Ask for clarification on the wrong understanding. |
| 14. | Encourage others to respond. |
| 15. | Explain opinions about a problem. |
| 16. | Determine when the right time to listen or give a response. |
| 17. | Manage time for regular online classes. |
| 18. | Understand that the lecturer’s response is a contribution and not a final decision in dealing with a problem. |
| 19. | Providing constructive criticism of other people’s responses. |
| 20. | Begin interaction with other members of the learning community. |
| 21. | Provide comments on the responses given by the lecturer. |
| 22. | MPKT lecturers facilitate online learning well. |
Faculty is the name of the current participant faculty. The priority of the faculty is the order of the faculties when participants register as UI students because one student may choose majors from different faculties when registering.
The participants are expected to use the following rules when answering the questionnaire:
- The entries for the senior high school origin, city of origin, andthe province of origin sections follow the entries on the participant’s identification card.
- Filling the faculty, faculty priority follows the choices available (containing the names of all faculties in the UI).
- The admission path response is done by crossing out unnecessary answers (SNMPTN, SBMPTN, PPKB, SIMAK, and Talent Scouting).
- Gender selection (male or female) and online learning experience (yes or no) is done by selecting one of the answers provided.
- The participants should give a number ranging from 0 to 10 for all of the remaining questions (given in Table 2, 3, and 4).
In the discussion of data preprocessing and clustering Table 2 will be mentioned as category A, Table 3 as category B, and Table 4 as category C.
3.2. Admission Competition
Figure 2 is a visualization of entering a faculty at UI for all study programs. We add up all registrants received at one faculty against the number of registrants received at the same faculty. The equation used to get the graph in Figure 2 is given in equation 6. Based on equation 6, ap is the admission percentage, ar is the number of accepted registrants and r is the number of registrants. According to Figure 2, the smaller the percentage of student admissions to UI, the more difficult it is to enter a study program at the faculty and vice versa.
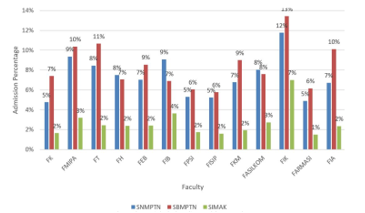 Figure 2: UI Admission Competition Level
The faculties that have the lowest level of competition are FIK (Faculty of Nursing) for all paths (SNMPTN, SBMPTN, SIMAK) and the faculties that have the highest competition are the FARMASI (Faculty of Pharmacy) and FASILKOM (Faculty of Computer Science). This study also reviews the perspective of clustering results from ranking the level of competition to be accepted as a UI student.
 3.3. Data Preprocessing
Data preprocessing aims to see the initial conditions of the data. The treatment of data includes:
- The number of initial observations by faculty. The number of observations in each faculty, the clusters formed tend to lead to the value of observation attributes in one particular faculty.
- Invalid imputation value is defined as the value that is filled out by participants outside of the predetermined rules including incorrect filling format and filling values outside the specified range.
- The presence of missing value. Observation that contain missing values cannot be further processed because it is assumed the participant already knows that each statement of the questionnaire must be filled with an appropriate response value.
Missing Values
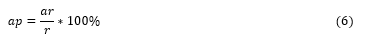
The number of initial observations (rows) we received from the data is equal to 2081 observations. Figure 3 represents missing values for all attributes. In figure 5, JK is the attribute ”gender”, ”Pengalaman” which is ”online learning experience” and the ”Jalur” is the ”admission path” attribute. Figure 3 is the sum of missing values for all attributes. The attribute ”Gender” (JK) contributes the most to the missing value, which is 28.5% or 377 observations from 1325 missing value (cell) events. 1325 these events spread over 614 observations (rows). We decided not to fill in the missing value because the forms filled out by the participants were in the form of a questionnaire because there was no guarantee that the values filled with the missing value imputation method were the values that the participants wanted to fill.
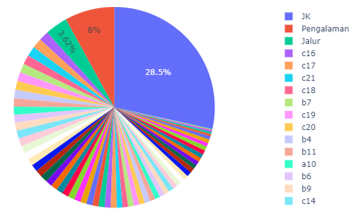 Figure 3: Missing Values of All Attributes
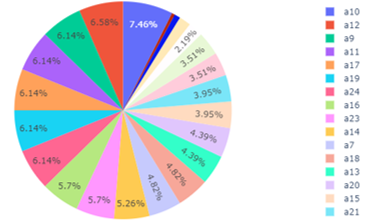 Figure 4: Missing Values of Category A
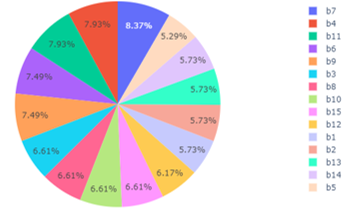 Figure 5: Missing Values of Category B
The visualization of other attributes can also be seen in Figure 3. However, we realize that for a deeper look, Figure 3 is too simple. Missing value occurrences within category A, category B, and category C are given in Figure 4, 5, and 6, respectively. According to the distribution of missing values in categories A, B, and C, category C gives the most missing values, reaching 309 observations. In category C, attributes C16, C17, and C21 contributed the largest missing values, each with 21 observations. A description of these attributes is given in Table 5.
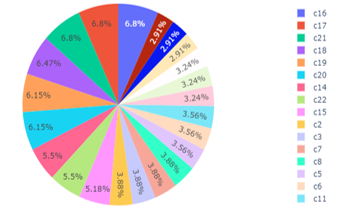 Figure 6: Missing Values of Category C
Table 5: Online Learning Experience Answer Distribution
| Description | Attributes |
| Determine when the right time to listen or give a response. | C16 |
| Manage time for regular online classes. | C17 |
| Provide comments on the responses given by the lecturer. | C21 |
Based on Table 5, the attributes of C16 and C17 are related to time management. We considered that participants had difficulty in managing time for attributes C16 and C17. In C16, we assumed that it was easier to learn by listening (preparing notes and focus on lecturers’ explanations) than by listening and giving responses within a certain time. Participants who do not understand or are just learning a concept in a particular lecture will tend to prefer to listen and record all the information available in order to playback the recording later (outside teaching and learning activities). Organizing online classes regularly as stated in attribute C17 is not
easy for participants. We assume that this is because the time to attend online classes is not from participants but from lecturers. The unavailability of choices we assume is the participant’s motive in giving a null value to the C17 attribute. The interaction carried out by participants is asking questions and receiving answers from lecturers. Most of the answers from lecturers were recorded by participants for further study material. Attribute C21 asks participants ’responses to comment on the lecturers’ responses. This interaction is not a participant’s habit so we assume it is the reason for the participant to give a blank value to attribute C21.
Observations containing missing values are removed from the data. The number of observations which originally numbered 2081 observations reduced to 1467 observations.
3.4. Outliers
The conditions for filling out the questionnaire are:
- Imputation value must be a member of the real number domain.
- Participants only permitted to fill the questionnaire answer with a value ranging from 0 to 10.
We define outliers as events where values are found outside the fill range given in observation. Figure 6 illustrates the maximum value of each given attribute. The range of values that should be filled out by participants is 0 to 10. However, according to Figure 7, there are participants who fill in the value outside permitted range. Figure 7 depicts the maximum value imputed by participants. Figure 8 illustrates the number of observations that give outlier values based on attributes.
Table 6: Online Learning Experience Answer Distribution
| Description | Attributes |
| Make use of online learning system | A12 |
| Linking initial knowledge with newly learned knowledge | A12 |
| Assessing websites related to teaching materials | A12 |
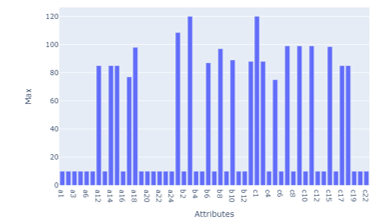 Figure 7:Maximum Value on Each Attribute
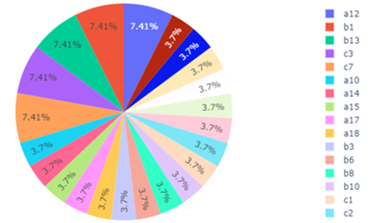 Figure 8: Outliers Percentage on Each Attribute
Based on Figure 7, attributes A12, B1, and B3 get the biggest outlier response value among other attributes. Based on Table 2, we did not find an association between attributes. Instead of normalizing outliers, we choose to delete those attribute values because we don’t have a solid reason to find a substitute value for outliers. To make it clear, suppose that we performed division by 10 to all outliers (a value bigger than 10), then we can only keep the performance up to 100, whereas there exist observations that score 120 on one of the questionnaires attributes so that the final value will still reaching 12 (permitted value ranges from 0 to 10). At this stage, the number of observations is equal to 1441 observations. The number of observations, marked as the end of the process of removing observations that contain outliers.
3.4.1. Invalid Imputation
After removing outliers, further exploratory data analysis was taken. In this stage, we are looking for invalid imputation. We defined invalid imputation as occurrences of value imputation to answer the questionnaire which violence the permitted format. If an entry is found that does not meet these conditions in one observation then the observation is considered invalid. Although the wrong imputation is given to only one attribute, we argue that attributes containing invalid imputation values are replaced with an empty value so that one observer is eliminated from the data (note that our treatment of missing values also erases one observation where there is a missing value). Explicit list of invalid imputation done by participants is given in Table 7.
Table 7: Invalid Imputation
| ID | Description |
| 110 | 7,5, |
| 119 | – |
| 119 | – |
| 119 | – |
| 108 | 8,,5 |
| 146 | 9*,5 |
| 111 | – |
| 905 | .8.5 |
Table 7 lists participants who provided invalid imputation. Invalid imputations cannot be processed further because the data types provided are not numeric. For example, participants with ID 110 include ”7.5,” as an answer. The representation of the answer is incomprehensible because ”7.5,” is not considered a decimal number. If the answer given is ”7.5”, we will include the answer for further processing. Another example, participants with ID 119, three times include the answer ”-”. Then the answer representation also cannot be processed further because it violates the terms of writing the answer. We do not provide options that allow participants to leave the answers blank. Instead of leaving the answers blank, we allow participants to give a score of 0 to answer the question. Based on Figure 7, DP means data preprocessing. In addition to Table 7, invalid imputations were found in the ’Online Learning Experience’ attribute. In the ’Online Learning Experience’ attribute, the response choices given are ’Y’ (yes) or ’N’ (no). Based on observations, there was one participant who gave a response ’n’. We think that participants intended to give an ’N’ response so that instead of removing one of these observations, we changed the response n to ’N’. Some other cases about the non-uniformity of answers are caused by the use of capital letters. In the one-hot encoding method, the difference in one character results in the vector being arranged not the same even though it produces the same information [23]. Invalid imputation values cannot be further processed so they are deleted from the dataset. The number of observations is now equal to 1435 observations, shrinking from the previous stage (erasing missing values) of 1441 observations.
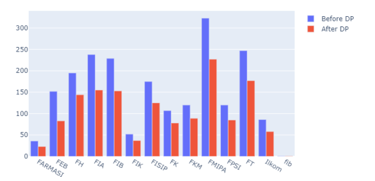 Figure 9: Comparison of the number of observations before and after data preprocessing
3.5. Post Observation
The post-observation phase aims to find out the number of observations after the data preprocessing treatment. Figure 9 is a comparison of the number of observations based on each faculty. FMIPA is still the faculty with the highest number of observations and FIB remains the faculty with the fewest observations. Other faculties follow the same observation distribution. No faculty has a greater number of observations than other faculties after going through the data preprocessing stage. Based on this information, the data to be processed to the next stage can be said to have a valid observation distribution.
4. Results and Discussion
The questionnaire consisted of three parts, i.e., category A measures the ability of students to manage their e-learning environment, category B measures interactions students with online teaching materials, and part category C measures interaction among students and instructors within their learning community during the e-learning process. Before calculating the average value of each part of the questionnaire, the categorization of the level of preparedness will be determined first. The categorization has a goal to find out whether all students from each faculty have a sufficient level of readiness in learning to use e-learning or whether there are students from one particular faculty who feel unprepared because of the factors based on the given questionnaire.
4.1. Cluster Evaluation
The k-means algorithm divides the set of N samples consisting of X (observations) into disjoint clusters Ck (observations that have entered into one cluster cannot enter into another cluster). mk is the centroid of each cluster. The value of mk is not the same as the actual observation value even though they (observation and mk) live in the same space. mk is an artificial point. The error in Figure 10 uses equation 2. The equation aims to minimize inertia (the distance of observation to centroids in one cluster) can be referred to as a within cluster sum-of-squares criterion.
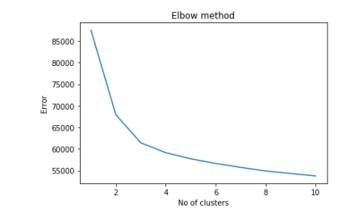 Figure 10: Elbow Methods for Optimum Cluster Number
The number of clusters is determined using the elbow method. This method requires human observation. The x-axis in Figure 10 is the number of clusters and the y-axis is the result of inertia calculation. Using the recommended elbow method, the number of clusters used in this study is equal to 3. Three Clusters obtained from the k-means algorithm are named cluster1, cluster2, and cluster3. Based on Table 8, the number of clusters with the most members is cluster2 and the number of clusters with the fewest members is cluster1. Visualization of the number of members in each cluster is given in Figure 11.
In Figures 11, the observation is closer to the coordinate point (x; 0) where . x represents the observation index. The range of observations is the same for all clusters from 0 to 1433 (the number is not the number of observations but serves as an identity). The quality of the formed clusters is studied further by applying two distance thresholds. We chose 10 and 5 as the threshold. We assume both values are close enough to the centroid in each cluster. The distance of each observation that is less than or equal to the threshold value is calculated in each cluster. The number of observations in each cluster is given in Figure 12. Based on Figure 12, cluster1 has the least number of observations with the appropriate threshold distance.
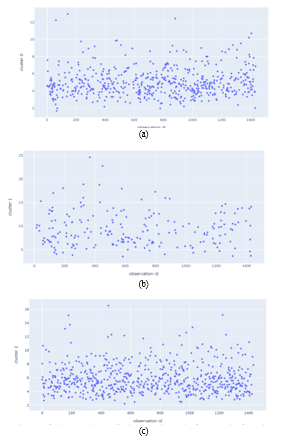 Figure 11: Comparison of the number of observations before and after data preprocessing
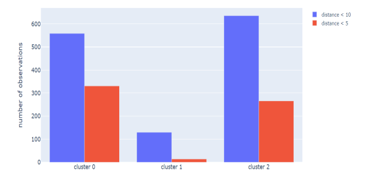 Figure 12: Comparison of the number of observations before and after data preprocessing
Table 8: Cluster Category Composition
| Cluster | Number of Observations in Each Cluster |
| Cluster1 | 564 |
| Cluster2 | 206 |
| Cluster3 | 665 |
Table 9: Cluster Composition
| Category | Cluster | ||
| Cluster1 | Cluster2 | Cluster3 | |
| A | 7.88 | 6.79 | 8.77 |
| B | 7.89 | 6.74 | 8.82 |
| C | 8.10 | 6.76 | 8.96 |
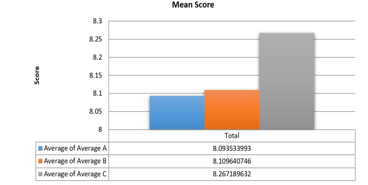 Figure 13: Mean Score for Category A, B and C
4.2. E-learning Environment Readiness Level
To determine the categorization of these values, a k-means analysis is utilized. The results of the K-means analysis is presented in Table 9. The result suggests that the students’ readiness is divided into three following categories:
- not ready, with a k-mean value below 7.5.
- ready, with a value between 7.5 to 8.5.
- very ready, which has a value above 8.5.
Based on the categorization levels of students’ readiness to learn in the e-learning environment, the average value of each part of the questionnaire is calculated to determine the level of students readiness for each part. The mean scores are presented in Figure 13. The average score of category A is 8.093 out of 10, the average score of category B is 8,109 out of 10, and the average score of category C is 8.267 out of 10. As a result, participants are quite prepared in all three aspects of readiness.
To investigate further the differences of the students preparedness between faculties, the average scores of each part of the questionnaire was calculated for each faculty, as given in Figure 14(a), 14(b), and 14(c).
Figure 14(a) indicates that faculties having average scores above 8 are: Faculty of Economics and Business (FEB), Faculty of Psychology (FPSI), Faculty of Law (FH), Faculty of Administrative Sciences (FIA), Faculty of Nursing (FIK), Faculty of Social and Political Sciences (FISIP), Faculty of Medicine (FK), Faculty of Public Health (FKM), Faculty of Mathematics and Natural Sciences (FMIPA), Faculty of Pharmacy (FARMASI), and Faculty of Engineering (FT). Faculty of Medicine has the highest scores of 8,271. Faculties that have mean scores below 8 are Faculty of Cultural Sciences (FIB) and the Faculty of Computer Science (FASILKOM). The average value for category A, management of e-learning environment, is above 8 (good) in some faculties, but for the FIB and the FASILKOM the student’s perceptions toward their ability to manage an online learning environment need further improvement.
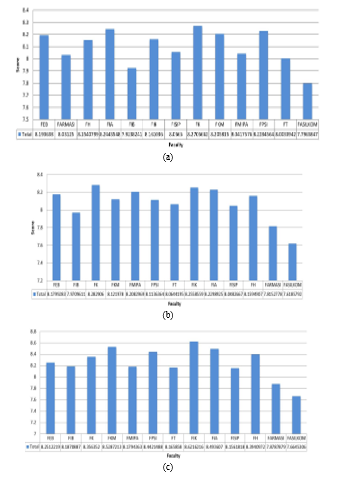 Figure 14: Mean Score for Category A, B and C for each Faculty
Similar to the mean scores for category A, Figure 14(b) depicts the mean score for category B. the Faculty having the largest mean score is the Faculty of Medicine, followed by faculties that have a mean score above 8: FEB, FKM, FMIPA, FPSI, FT, FIK, FIA, FISIP, FH. While the FASILKOM, FIB, FARMASI has a mean score of less than 8. The faculty that has the lowest mean score is the FASILKOM with a mean score of 7.6186. This fact is somewhat contrary to the fact that students of this faculty have high entrance test scores compared to other faculties, except the FK. In addition, students are directly exposed to subjects related to computer programming and mathematical foundations that are delivered by blended learning. One of the subjects is even done with intensive online collaborative learning. Delivery modes of subjects in other faculties were mostly conventional with limited use of online interaction.
Figure 14(c) shows that the Faculty of Nursing (FIK) has the highest mean score of 8.6216, followed by FKM which has a mean score of 8.5287. Most faculties have mean scores above 8. The students of these faculties have a good level of preparedness. On the other hand, the Computer Science Faculty has the lowest mean score of 7.6645. The Faculty of Pharmacy also has low means scores on category C.
Category A on the questionnaire discusses managing e-learning environments. General conclusions that can be drawn based on the average value of each category in each cluster are the participants involved in the interaction with the questionnaire capable of carrying out e-learning environment management. Of all the faculties at UI, an interesting finding was the performance of the Faculty of Computer Science (FASILKOM) which consistently scored low average scores in three categories. This leads to two specific conclusions about FASILKOM’s performance:
- The measurement metric used is not representative. The method used is the calculation of the average of each category for all clusters. Note that the average value is sensitive to noise. For example, there are observations that fill in too high a value compared to other observations, so the average value of clusters in each category also increases rapidly. The number of participants from FASILKOM is only about 5% of all participants, so the difference is that if there is no large value that is able to shift the average value of FASILKOM, then the performance of FASILKOM is also difficult to pass number 8 like other faculties.
- FASILKOM has its own e-learning system 2 that acts as a central academic interaction. The experience filled out in the questionnaire is the participant’s experience with this e-learning system. The e-learning system not only offers students interaction with subjects but also presents the latest faculty announcements, discussion forums, interactions between users of e-learning systems, etc. We argue that the system is considered more complex than e-learning which prioritizes the collection of tasks and grading only.
4.3. MPKT Learning Progress towards Syllabus Suitability
Figure 15 shows the graph of the mean score for part B questions, namely B14 (MPKT learning is carried out following Learning Reference Unit), B15 (The task and learning task loads of MPKT is following semester credit (SKS)) and for part C questions namely C22 (MPKT lecturer is able to facilitate online learning well). Figure 15 shows the average score of MPKT learning conformity items with SAP given (B14) for each faculty studied. Based on the graph shows that FIA and FH have an average value for B14 above 8.5. FMIPA, FIB, FEB, FK, FPSI, FT, FIK, and FISIP have an average value for B14 above 8. Whereas the FASILKOM and FARMASI has average values for B14 respectively 7.344 and 7.938. This value has a considerable difference with other faculties which generally have an average value for item B14 more than 8.
This reveals that the conformity of MPKT learning with the Syllabus given is quite appropriate in some faculties indicated by the average value of item B14 has exceeded the value above 8, but the FASILKOM and FARMASI feels that the suitability between MPKT learning with the Syllabus given is not quite appropriate. Therefore, at the Faculty of Computer Science and Faculty of Pharmacy, it is necessary to readjust the MPKT learning with the given syllabus.
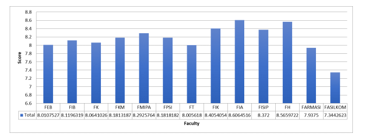 Figure 15: Mean Score of MPKT towards Syllabus
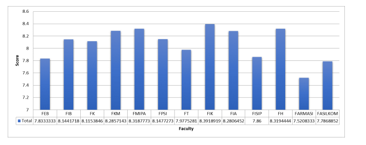 Figure 16: Mean Score Task and Online Learning
Figure 16 above shows the average score for the item suitability of the workload and MPKT learning load with the number of SKS (B15) for each faculty studied. Based on the graph above it can be seen that FMIPA and FIK have an average value for Task Load Suitability with Online Learning that is not too far away, FMIPA has an average value for item B15 (Matching Task Load with Online Learning) of 8.319 while FKM has an average the average value for item B15 (Matching Assignment to Online Learning) was 8.3392. Some faculties have an average value above 8, namely FIB, FK, FKM, FPSI, FIA, and FH, while other faculties have an average value below 8 such as the FASILKOM which has an average of 7.787 and Faculty of Pharmacy which has a value of the lowest average is 7.521.
According to the Figure 16, we can conclude that students of 5 out of the 13 faculties perceived that the task load and learning of MPKT were not enough according to the number of SKS MPKT, while the other faculties said that task load and learning process were by the number of SKS. This is indicated by the faculty’s mean score of more than 8, but there are 5 other faculties with a mean score of less than 8.
4.4. Lecture’s Readiness Perception
Figure 17 shows the average score related to the readiness of MPKT lecturers in facilitating online learning (C22). Based on Figure 17 shows that faculties that have an average C22 value above 8.5 for items are FIB, FKM, FPSI, FIK, FIA, and FH. Faculties that have an average score above 8 are FEB, FK, FMIPA, and FT. while other faculties such as FASILKOM, FISIP, and Pharmacy have an average value for C22 items ranging from 7 to 8. The faculty with the lowest average value for item C22 is FASILKOM which is 7.279. This revealed that on average students agreed that MPKT lecturers could facilitate online learning, but for the three faculties namely FASILKOM, FARMASI, and FISIP students still felt that MPKT lecturers were not good enough to facilitate online learning. Therefore, it is necessary to improve the quality of MPKT lecturers in facilitating online learning.
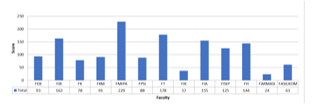 Figure 17: Lecture Readiness Score in Online Learning
5. Conclusion
E-learning is a learning system that is increasingly needed today. Therefore, we conducted a first semester student questionnaire survey at the Universitas Indonesia environment in 2019. The three main aspects investigated: students’ readiness to learn in an e-learning environment, the conformity of the MPKT syllabus to the learning process, and students’ perceptions of MPKT teaching lecturer. Based on the data clustering using the k-means algorithm, we concluded the following.
- Students in each faculty is ready to learn in an e-learning environment. However, some students of the Faculty of Computer Science and the Faculty of Pharmacy require more additional time for preparation.
- Based on the average value of attribute B14(MPKT learning is carried out following Learning Reference Unit). , most students stated that MPKT learning was in accordance with the syllabus except for students of the Faculty of Computer Science and Faculty of Pharmacy. The average value of B14 of Computer Science students and Pharmacy students are lower than 8.
- Evaluation of participant responses to answer students’ perceptions of MPKT lecturers was conducted on question C22 (MPKT lecturer is able to facilitate online learning well). Most of the students think that MPKT lecturers are able to teach well except in the Faculty of Computer Science, Faculty of Pharmacy, and Faculty of Social and Political Sciences who think that the teaching ability of MPKT lecturers need to be improved. This conclusion is also in line with Figure 2, wherethe Faculty of Computer Science and the Faculty of Pharmacy are more competitive as compared to entering other faculties.
- The study shows, in general, the students perceive themselves as being ready to learn in the e-Learning environment, except for students in one of the faculties who have been very intense using technology in their learning, including computer-related courses such as codingand doing online collaborative learning.
In general, there is an interesting phenomenon. The Faculty of Computer Science which is expected to give a high score in this survey actually has a low score. We argue that this is caused by inappropriate measurement metrics and e-learning complexity factors owned by the Faculty of Computer Science affecting the behaviour of participants. In addition, intensive e-learning and computer-related courses exposure may contribute to the students’ perception on their readiness.
6. Recommendation
We propose future research that is expected to be able to discuss the readiness of teaching MPKT courses through in-depth discussion mechanisms both with students and MPKT expert lecturers, measure the effect of the suitability of courses taken by students in the first semester along with MPKT courses, and an overview of the current situation of online learning in Universitas Indonesia.
Acknowledgement
We thank the subdirectorate of university courses administration Universitas Indonesia (UI) for allowing us to conduct a survey related to this research.
- W. Bhuasiri, O. Xaymoungkhoun, H. Zo, J.J. Rho, A.P. Ciganek, “Critical success factors for e-learning in developing countries: A comparative analysis between ICT experts and faculty,” Computers & Education, 58(2), 843–855, 2012, doi:https://doi.org/10.1016/j.compedu.2011.10.010.
- A. Popovici, C. Mironov, “Students’ Perception on Using eLearning Technologies,” Procedia – Social and Behavioral Sciences, 180, 1514–1519, 2015, doi:https://doi.org/10.1016/j.sbspro.2015.02.300.
- A. Alhabeeb, J. Rowley, “E-learning critical success factors: Comparing perspectives from academic staff and students,” Computers & Education, 127, 1–12, 2018, doi:https://doi.org/10.1016/j.compedu.2018.08.007.
- M. Krendzelak, “Machine learning and its applications in e-learning systems,” 2014 IEEE 12th IEEE International Conference on Emerging ELearning Technologies and Applications (ICETA), 267–269, 2014.
- A. Sangrà, D. Vlachopoulos, N. Cabrera, “Building an inclusive definition of e-learning: An approach to the conceptual framework,” The International Review of Research in Open and Distributed Learning, 13(2), 145–159, 2012, doi:10.19173/irrodl.v13i2.1161.
- T. Favale, F. Soro, M. Trevisan, I. Drago, M. Mellia, “Campus traffic and e-Learning during COVID-19 pandemic,” Computer Networks, 176, 107290, 2020, doi:https://doi.org/10.1016/j.comnet.2020.107290.
- T. Faisal, K. Junus, H. Santoso, “Development of the Online Collaborative Summarizing Feature on Student-Centered E-Learning Environment,” 2019 International Conference on Advanced Computer Science and Information Systems (ICACSIS), 435–440, 2019.
- M. Parkes, S. Stein, C. Reading, “Student preparedness for university e-learning environments,” The Internet and Higher Education, 25, 2014, doi:10.1016/j.iheduc.2014.10.002.
- J.-H. Wu, R.D. Tennyson, T.-L. Hsia, “A study of student satisfaction in a blended e-learning system environment,” Computers & Education, 55(1), 155–164, 2010, doi:https://doi.org/10.1016/j.compedu.2009.12.012.
- F.D. Davis, R.P. Bagozzi, P.R. Warshaw, “Extrinsic and Intrinsic Motivation to Use Computers in the Workplace1,” Journal of Applied Social Psychology, 22(14), 1111–1132, 1992, doi:https://doi.org/10.1111/j.1559-1816.1992.tb00945.x.
- T.S.H. Teo, V.K.G. Lim, R.Y.C. Lai, “Intrinsic and extrinsic motivation in Internet usage,” Omega, 27(1), 25–37, 1999, doi:https://doi.org/10.1016/S0305-0483(98)00028-0.
- H.M. Selim, “Critical success factors for e-learning acceptance: Confirmatory factor models,” Computers & Education, 49(2), 396–413, 2007, doi:https://doi.org/10.1016/j.compedu.2005.09.004.
- S. Tsang, C.F. Royse, A.S. Terkawi, “Guidelines for developing, translating, and validating a questionnaire in perioperative and pain medicine.,” Saudi Journal of Anaesthesia, 11(Suppl 1), S80–S89, 2017, doi:10.4103/sja.SJA_203_17.
- K.P. Sinaga, M. Yang, “Unsupervised K-Means Clustering Algorithm,” IEEE Access, 8, 80716–80727, 2020, doi:10.1109/ACCESS.2020.2988796.
- T. Anwar, T. Siswantining, D. Sarwinda, S.M. Soemartojo, A. Bustamam, “A study on missing values imputation using K-Harmonic means algorithm: Mixed datasets,” AIP Conference Proceedings, 2202(1), 20038, 2019, doi:10.1063/1.5141651.
- J. Wu, Advances in K-means Clustering, Springer Theses, Berlin, 2012, doi:https://doi.org/10.1007/978-3-642-29807-3.
- A. Bustamam, S. Formalidin, T. Siswantining, “Clustering and analyzing microarray data of lymphoma using singular value decomposition (SVD) and hybrid clustering,” AIP Conference Proceedings, 2023(1), 20220, 2018, doi:10.1063/1.5064217.
- S. Kapil, M. Chawla, M.D. Ansari, “On K-means data clustering algorithm with genetic algorithm,” in 2016 Fourth International Conference on Parallel, Distributed and Grid Computing (PDGC), 202–206, 2016, doi:10.1109/PDGC.2016.7913145.
- J. Bell, Hands-On for Developers and Technical Professionals, Wiley, 2014.
- D. Marutho, S. Hendra Handaka, E. Wijaya, Muljono, “The Determination of Cluster Number at k-Mean Using Elbow Method and Purity Evaluation on Headline News,” in 2018 International Seminar on Application for Technology of Information and Communication, 533–538, 2018, doi:10.1109/ISEMANTIC.2018.8549751.
- H.S. Al-Ash, A. Wibisono, A.A. Krisnadhi, “Payment Type Classification on Urban Taxi Big Data using Deep Learning Neural Network,” in 2018 International Conference on Advanced Computer Science and Information Systems (ICACSIS), 201–206, 2018, doi:10.1109/ICACSIS.2018.8618200.
- Z. Gao, L. Ding, Q. Xiong, Z. Gong, C. Xiong, “Image Compressive Sensing Reconstruction Based on z-Score Standardized Group Sparse Representation,” IEEE Access, 7, 90640–90651, 2019, doi:10.1109/ACCESS.2019.2927009.
- X. Wu, X. Gao, W. Zhang, R. Luo, J. Wang, “Learning over Categorical Data Using Counting Features: With an Application on Click-through Rate Estimation,” in Proceedings of the 1st International Workshop on Deep Learning Practice for High-Dimensional Sparse Data, Association for Computing Machinery, New York, NY, USA, 2019, doi:10.1145/3326937.3341260.