
Evidence of Improved Seawater Quality using a Slow Sand Filtration
Volume 6, Issue 2, Page No 359-367, 2021
Author’s Name: Eyad Abushandia)
View Affiliations
Civil Engineering Stream, Faculty of Engineering, Sohar University, Sultanate of Oman
a)Author to whom correspondence should be addressed. E-mail: eabushandi@gmail.com
Adv. Sci. Technol. Eng. Syst. J. 6(2), 359-367 (2021); ![]() DOI: 10.25046/aj060241
DOI: 10.25046/aj060241
Keywords: Slow Flow, Seawater, Water Quality, Sand

Export Citations
In recent years water treatment methods under pressurized systems have been considered as the optimum high-rate filtration techniques. Unpressurized-slow sand filtration can be the cheapest and most efficient method, among others. This research aims to test the performance of a reliable seawater filtration system, using three different iterations. The filters have been designed considering many types of filtration layers such as sand, gravel, palm chlorophyll and other layers. The results of routine tests showed that the seawater pH, and TSS, and conductivity in the Gulf of Oman are relatively high. The pH values were decreased from 9.4 to 8.4 (filter 1), 9.0 (filter 2), and 8.7 (filter 3). Filter three has a reduced value of conductivity from 13.06 to 12.81 Ms/cm while a slight increase in filters 1 and 2. The TSS values were significantly reduced from 12.42 mg/L to 1.682 mg/L (filter 1), 2.478 mg/L (filter 2), and 1.200 mg/L (filter 3). This reflects the efficiency for each filter for this parameter is 86.5% for filter 1, 80% for filter 2, while 90.3% for filter three. Water velocity through each layer was monitored using Darcy law where the water of filter three has the longest residence time and slowest flow per time. The fastest flow was in filter one with an average of 0.5 L/minutes, filter two has an average flow of 0.088 L/minutes, while filter 3 has a flow rate of 0.026 L/minutes. The third filter has provided the best performance according to the results. Statistical analysis was conducted to understand the correlation between different parameters. As per Pearson correlation, there is a significant correlation between pH and conductivity values for 19 samples (0.989), while the correlation with TSS is relatively weak (0.364).
Received: 08 January 2021, Accepted: 15 February 2021, Published Online: 17 March 2021
1. Introduction
Oman lies in an arid climatic strip where the fresh water is limited [1]. Most of desalination processes in the country based on pressurized systems which require huge amount of energy and cost. Many kinds of particles can be found in seawater such as organic materials, suspended and dissolved solid coupled with high turbulence. Slow sand filtration is a method used for hundreds of years to produce better quality water [2]. In general term, water purification is a process of removing pollutants from water mainly to produce water for human use while the process can also be extended for various other purposes including agricultural and industrial needs especially in regions where water resources are limited. Depending on the sources of raw water, particle removal can be accomplished through physical, chemical, and biological processes [2]. However, slow sand filtration used mainly physical process such as sedimentation and adsorption starting by removing fine particles to some organic matters. Because of the slow flow rates within the filtration media, the raw water sits above the sand for several hours before passing through [3]. Slow sand techniques are considered to be an proper for small scale systems such as farms and houses since the operating procedure and maintenance are simple [4]. As slow sand filters are simple, efficient, and economic, they are appropriate methods of water treatment in developing countries [5]. The purification efficiency of water in slow filters is high where the rate of removal turbidity may reach 100%, bacteria removal ranges between 89% and 99% [6] while the removal of color of 20-30% and 60% iron compounds [7].
Biological process is essential in the slow sand filtration operation, which is based on fine sand particles ranging from 0.15 to 0.35 mm [8], a bed thickness of 0.8 to 0.9 meters [9]. In [10], the authors summarized the advantages of using slow-sand filters in two major points: first, acceptable levels of treated water quality, and second, low cost and easy of construction. While the disadvantages of slow-sand filters were cited by [11]:
- Not efficient in filtering viruses
- No protection against chemicals, especially chlorine which may lead to recontamination
- Routine cleaning can damage the bio-layer and reduce efficiency
- Not easy to move the unit into another place due to the weight and initial cost of installation.
In addition, slow sand filtration treatment unit will occupy a large area of land and require more control tests on a regular basis, which means more labor is required during cleaning process. In some tropical climates, there is a risk algae grows which will proliferate in slow sand filters causing filter blocking, change water taste and odor [12]. Sand filters may consist different layers and depths of sand, gravel, and activated carbon. In fact, there are different hypotheses on the depth of each filter layer based on the efficiency and amount of water required. In some cases, the depth of the sand layer can reach 2.5 m, while in compressed units or compressed filters; the depth of sand layer is not more than 1.2 m and not less than 80cm for required efficiency [13].
In [14], the authors tested new granular materials for dual-media bed filtration of seawater and to assess the quality of the filtrate regarding criteria for feeding reverse osmosis desalination installations. Two different filter columns, one with the new materials namely clay and Mono Multi filter, and another filter with anthracite coal 1.2–2.5 mm on upper part of a sand layer 0.8–1.25 mm. However, both filters had similar performance in removing particulates and producing filtrates of acceptable quality. In fact, the authors studied the impact of relatively high or low temperature gradients simulating summer and winter conditions. A formation of larger aggregates occurred in the column where the temperature is higher, thus reducing the flow rate and hydrostatic head. While the impact of the materials physical properties played a key role, the authors concluded that the higher temperature (summer) campaigns performed better.
In [15], the authors investigated the nature of the biological accumulation in filters during the filtration process of North seawater. The biological accumulation of two different types of filters (coarse, 80 μm and fine 5 μm) was investigated over a 24-months duration. They assessed the seasonality effect, particularly; temperature during cold and hot seasons on the accumulation of both organic and inorganic materials showed that the filter life in hot seasons is shorter due to higher biological activities. The research of [16] was conducted to assess the viability of slow sand filter using dolochar to filter waste water from an industrial source. Efficiency of slow sand filters was assessed using two laboratory conditions. A dual media filter showed higher removal ability, particularly, average chemical oxygen demand removal of up to 80.96% compared to 64.68% of a single sand media filter, and turbidity removal of 91.13% compared to 82.27% of a single sand filter. In addition, the total suspended solids (TSS) removal efficiencies of sand and dolochar media filter 89.08%, while in the single sand media filter removal efficiency was 82.48%. The authors concluded that the dual media filter which includes a biofilm layer has better performance in comparison with a single sand media. The performance of slow sand filters in removing bacteria was carried by [17]. They study the physical properties of the layers mainly the grain size distribution and grain shape intermittently. Bacteria removal was conducted using two different filter media namely Rhine sand-spherical shape and Lava sand-angular shape with three different particle size distributions. A better achievement was observed by the filter unit which included lava sand layer. This result reflects the effect of smaller grain size and an angular shape of sand grain lead which lead to an increase in bacteria removal.
The research carried by [18] demonstrated the ability of slow sand filtration as tertiary treatment operating with municipal wastewaters. At a laboratory scale the filtration process was capable to remove at least 90% of suspended solids, over 65 % of BOD, and more than 95 % of the bacteria. As per the study physical properties of the layers plays a major role in removing contaminates. In addition, a laboratory study was carried out by [19] to assess the efficiency of slow sand filtration. The results showed that slow sand filtration with 0.43 mm particle sand size is highly effective at a filtration rate of 0.14 meter/hour. It removes around 91 % of turbidity, 89 % of suspended solids (SS), 77% of chemical oxygen demand (COD) and 85% of bio-chemical oxygen demand (BOD). Although that the authors have mad many layer iterations, they determined the optimum flow for each iteration. In [20], the authors were not fully satisfied of his results as the filtered water did meet the standard of drinking water. However, it is recommended to fill the filters with finer sand particles (0.2 to 0.45 mm), and the sand layer should not be less than 40 cm in order to see better results.
In terms of modeling approach, [21] proposed the first mathematical model in 1935 based on laboratory experiments. The filtration columns contained algae and white clay. The filtration coefficient was basically based on deposited material accumulates. In [22], the authors studied several pretreatment techniques applied for seawater reverse osmosis desalination process. They measure the silt density index (SDI) of the produced water in addition to other important parameters such as filtrate flux, trans membrane pressure, total suspended solids, colloidal silica, total organic carbon, etc. According to the quality produced sample by the conventional media-filtration technique the SDI varied from 2.8 to 3.6 which reflect a slight consistency as SDI should be less than 3.0.
In [23], the authors reviewed the early consideration history of slow sand filtration and presented a column designing method with a theoretical aspect. They discussed the advantages and disadvantages of slow filtration especially the simplicity of operation and the ability of the process to remove microorganisms from water. They tried to find out the techniques suit the pre-treatment water and the applicability in developing countries.
The size and uniformity coefficient of sand particles stay the major concerns for many researchers as explained before. Based on previous research findings, the most effective size for sand filtration is between 0.35 mm and 0.15 mm, while the best performance can be if the uniformity coefficient is less than 2 [24]. In [25], the authors have designed a Bio-Sand slow filter to treat water coming from wells, spring, river, and rainwater. Their filter does not have any replaceable parts and can remove up to 90% of bacteria, 100% parasites, 50 to 90% of organic and inorganic toxins, 95 to 99% of zinc copper and lead and 47% of arsenic.
The climate class plays an important role in designing filtration unit. The unit can be built as an open system or as a closed box depending on surrounding conditions. For instance, cold humid climate requires a closed box because low temperature reduces process performance [10], while the arid climate requires an open system. In general application, a slow sand filtration consists a box often made of concrete placed a bed of sand on layer of gravel and ended by a pipes system to collect treated water. Recently, plastic boxes have been used as filter containers [26].
The major objectives of this research are to produce water for the specific purpose of agriculture consumption and encourage the use of -low cost-slow sand filtration technique in order to improve clean water availability for Al-Batinah region. The purpose of this research is to evaluate the filtration process under several media and layer properties.
2. Methods and setting experiment
Seawater in the world’s oceans has a salinity average of about 3.5% (35 g/L, 599 mM) [27]. In general, seawater pH ranges between 7.5 and 8.4 [27, 28]. Seawater salinity is not uniformly distributed throughout the world, whereas, the majority of seawater has a salinity of between 31 g/kg and 38 g/kg [29]. The most dominant dissolved ions in seawater are sodium, chloride, magnesium, sulphate, and calcium [30]. The compositions of the total salt component are: Cl− 55%, Na+ 30.6%, 7.7%, Mg2+ 3.7%, Ca2+ 1.2%, K+ 1.1%, other 0.7% [31]. However, small amounts of other substances are found.
2.1. Seawater sampling
In November 2017, 19 grab samples of seawater from Sohar area, Gulf of Oman were collected at 5m to 20 m interval. Usually, the temperature in November is less than other months of the year; therefore, the evaporation rate is relatively less. Consequently, the sea water is slightly diluted.
The latitude and longitude were recorded in order to interpolate the parameter values in further steps. Figure 1 shows samples collection area in Sohar at Gulf Oman. However, an investigation presented by the Middle East Desalination Research Center (MEDRC) in Muscat, Sultanate of Oman indicated that seawater quality in the Gulf of Oman has significantly greater parameters values than other sites in the world [32] adding another challenge to the current research.
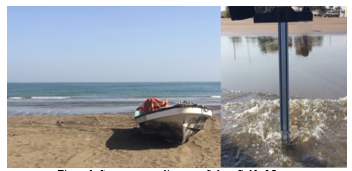 Figure 1: Seawater sampling area, Sohar, Gulf of Oman
2.2. Routine tests
Total suspended solids (TSS) test was conducted to determine the level of inorganic and organic substance contained in seawater before and after the filtration process. The lower level of TSS indicates purer water. The method of measuring TSS is based on evaporating sample of water and then weighting the residues (Figure 2). Nevertheless, TSS remains an important parameter to evaluate filtered water quality (examples [33–35]).
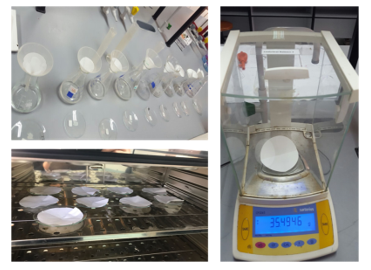 Figure 2: TSS test weighing procedure
In addition, pH and electric conductivity tests were conducted to measure how filtration process has affected the water quality. The conductive ions indicated the dissolved salts and inorganic materials such as alkalis, chlorides, and carbonate compounds are in higher concentration.
2.3. Design of Filters
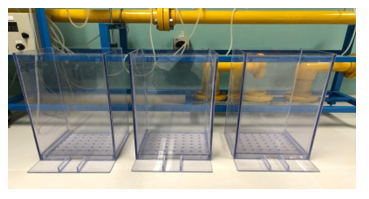
There are different design dimensions of filter units ranging from 20 cm to 4 m based on the purpose of the research [36–38]. Three acrylic column filters with different layers components have been used. The height of each filter is 60 cm, while the width is 30 by 30 cm (Figure 3).
Adding a limestone layer to the filter unit will improve its efficiency in removing heavy metals, ammonium ions, and phosphates [39,40]. Therefore, limestone was collected from a near area called Wadi Hibi, west part of Sohar, and used as a layer among many others (Figure 4). The stone samples were crushed using the Loss Angeles machine for 10 minutes to produce fine particles. Each sample contains 2000 g of limestone. Sieve analysis was used to assess particles size distribution. The size distribution is often of critical importance to the way the material performs in use. The limestone particles size was between 6.3 mm and 425µm.
Many researchers have placed coarsest gravel at the bottom while the a finest gravel and sand layers placed above [41,42] sand and gravel layers were collected, washed using distilled water, and particles size has been recorded which was between 9.5 mm and 425µm (Figure 5).
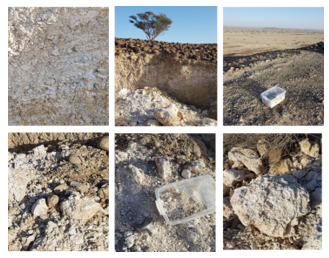 Figure 4: Limestone samples collection site used in the filtration units
 Figure 5: Samples of gravel and sand layers
Furthermore, chlorophyll was extracted from the palm leaves (Phoenix dactylifera) a common tree in Oman. Palm leaves are having significant concentration of chlorophyll a and b [43]. Chlorophyll is known as the green substance responsible for the photosynthesis process. The photosynthesis process is strongly interconnected with pH values. The target from this step is to reduce the high values of seawater pH values by adding a layer of chlorophyll to produce glucose and oxygen from water and carbon dioxide. Rubber particles and activated carbon were used as separate two layers in the filtration process. In fact, those two layers have been used for several purification purposes: chemical, physical, and biological treatment [44,45]. Figure 6 shows the recycled rubber provided from Rubber-NEKTEL Company in Sohar Industrial Zone. This implementation might give an environmental concern.
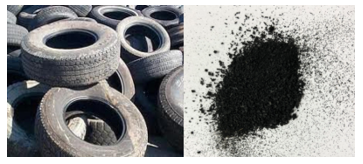 Figure 6: Rubber particles
The pH is a major parameter of water quality evaluation. Most of cited research papers have conducted pH test before and after filtration processes. Additional pH test was made to evaluate how seawater is influenced by each material separately (Figure 7) under continuous mixing process for 24 hours.
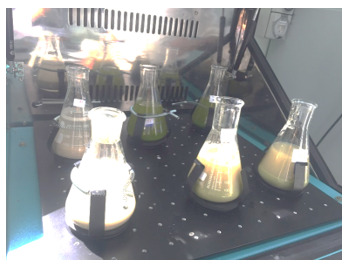 Figure 7: individual pH test of each material
However, several iterations including present or absent of the materials, order of the layers, and thickness were evaluated. First filter contains 7 different layers, second filter contains 9 different layers, and third filter contains 12 different layers with different thickness. Tables 1 to 3 show details filter profiles according to their order, thickness, and types of material. The arrangement of layers are from up to down. The Freeboard is around 25 cm. Figure 8 shows a filter sample and materials setup.
Table 1: First filter layers order, types of material, and thickness
| Thickness | Type of material | Layers order |
| 5 cm | Gravel | 1 |
| 4 cm | Cotton | 2 |
| 5 cm | Fine sand | 3 |
| 2 cm | Cotton | 4 |
| 5 cm | Carbon | 5 |
| 2 cm | Chlorophyll | 6 |
| 10 cm | Gravel | 7 |
Table 2: Second filter layers order, types of material, and thickness
| Layers order | Type of Material | Thickness |
| 1 | Gravel | 6 cm |
| 2 | Fine Limestone | 2 cm |
| 3 | Powder calcium | 2 cm |
| 4 | Chlorophyll | 3 cm |
| 5 | Fine sand | 6 cm |
| 6 | Shell | 1 cm |
| 7 | Carbon | 6 cm |
| 8 | Fine Limestone | 2 cm |
| 9 | Gravel | 8 cm |
Table 3: Third filter layers order, types of material, and thickness
| Thickness | Type of Material | Layer order |
| 9 cm | Gravel | 1 |
| 0.5 | Textile | 2 |
| 3.5 cm | Fine calcium | 3 |
| 0.5 | Textile | 4 |
| 5 cm | Rubber | 5 |
| 0.5 | Textile | 6 |
| 3.5 cm | Fine sand | 7 |
| 0.5 | Textile | 8 |
| 1.5 cm | Powder calcium | 9 |
| 1 | Algae | 10 |
| 8 cm | Carbon | 11 |
| 7.5 cm | Gravel | 12 |
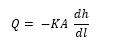
The flow within each layer was tested using Darcy equation [46] which relates the head loss or pressure loss due to friction along a given profile length. The equation is suitable for an incompressible flow where water moves by gravity. The equation according to Darcy as following [47]:
 where:
is the change of head loss due to layer friction over the given length of the profile
is the change of layers length
A is the cross-sectional wetted area (m2).
K is Darcy friction factor for each material used, the representative values were taken from [48].
To assess the relationships between different variables results Pearson correlation was used based on the following formula:
![]() The values of Pearson correlation are always between -1 and 1, and if x and y are not related the correlation is equal to zero. The relationships between routine tests before and after were evaluated. Filter unit results with significant correlation reflect a weak purification process.
The values of Pearson correlation are always between -1 and 1, and if x and y are not related the correlation is equal to zero. The relationships between routine tests before and after were evaluated. Filter unit results with significant correlation reflect a weak purification process.
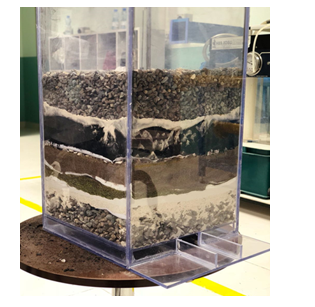 Figure 8: Filter sample and materials setup
3. Results and discussion
Due to a lower turbulation process, low rainfall rates, and higher evaporation rates in comparison to other parts of the world; the seawater in the Gulf of Oman has higher values of pH, conductivity and, TSS. Water Samples collected from seas near France, Korea, and Malaysia showed a significant lower value of those parameters [49].
The average pH value for the collected seawater samples was 9.17, conductivity was 12.97 mS/cm, and the total suspended solid (TSS) was 12.42 mg/L. Figures 9, 10, and 11 shows the spatial location and distribution values of conductivity, pH, and TSS respectively. All samples indicate that, seawater is a base solution because the pH is higher than 7. Even the sample were collected in a short distance interval (5 m), still one can recognize the differences between the samples. Overall, it is conspicuous that the pH values are higher in samples 12, 13, 14 and 15 which were equal to 9.3 while the lowest value of the pH was in sample number 1 (8.9). As mentioned by [50] a high pH value of seawater is connected to a high concentration of minerals such as Boron, Copper and Nickel.
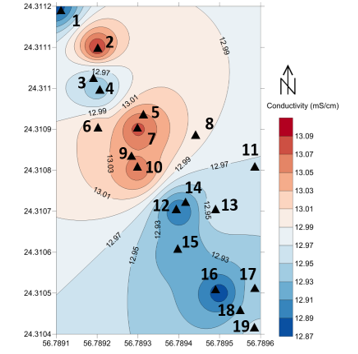 Figure 9: the location of the 19 seawater samples and conductivity values in Ms/cm of the before filtration in the study area
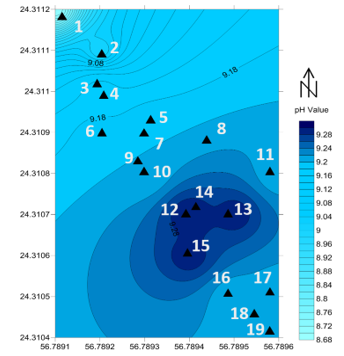 Figure 10: the pH values of the 19 seawater samples before filtration in the study area
In general seawater is a good conductor because of the presence of salts and impurities. Samples number 8 and 9 showed the highest conductivity values namely 13.12 Ms/cm which reflects a higher the concentration of solid minerals in those samples. With no significant drop; sample number 14 has the lowest conductivity value which was 12.85 Ms/cm. In this regards, [51] recommended the use ceramic microfiltration membrane to enhance sea water quality, while reverse osmosis unit remains the efficient method to remove complex matrix of seawater minerals [49]. However, slow sand filtration has failed in reducing the conductivity into an acceptable level.
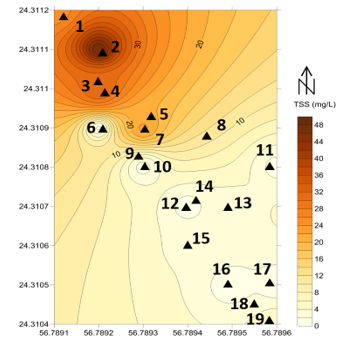 Figure 11: the TSS values in mg/L of the 19 seawater samples before filtration in the study area
In addition, the TSS tests of untreated samples showed that the values were between 0.2 mg/L and 50 mg/L for samples number 12 and 3 respectively. The three filters have showed very optimistic results in removing TSS, decreasing the value from 12.42 mg/L in average into less than 2.5 mg/L. Similarly, a technique proposed by [14] to use granular materials for dual-media filtration of seawater showed very matching results.
As per Pearson correlation, there is a significant correlation between pH and conductivity values for 19 samples. However, this was not the case for the correlation pH or conductivity values with TSS values which indicates a weak relationship (Table 4).
Table 4: Pearson correlations for measured parameters
| PH | Conductivity | TSS | ||
| pH | Pearson Correlation | 1 | 0.989 | .077 |
| N | 19 | 19 | 16 | |
| Conductivity | Pearson Correlation | 0.989 | 1 | .364 |
| N | 19 | 19 | 16 | |
| TSS | Pearson Correlation | 0.077 | 0.364 | 1 |
| N | 16 | 16 | 16 |
Typically, there are many alternatives to develop or add layer materials in order to improve filtered water quality. At a Nanoscale the pH test was conducted after individually mixing seawater samples with each layer materials for 24 hours with seawater samples. This procedure helped to understand the level that each layer materials impact pH values. The results show that all materials reduced the pH from 9.17 to 8.9 (fine limestone), 8.4 (Mix of fine limestone and palms chlorophyll), and 7.8 (palms chlorophyll). Due to the photosynthesis reactions the levels of pH value has been reduced [52].
In a different approach, sieve analysis was conducted in this research to determine the particles size distribution of the selected filtration materials. It is an evident that sieve can be used to separate both fine and coarse aggregate into different particles size in order to select a proper K value for the flow using Darcy law. Based on Darcy law and flow records, filter three has the longest residence time and lower flow per time. However, the water residence time and flow rate is different from one filter to another because of material types and thickness. The fastest flow was in filter one with an average of 0.5 L/minutes, filter two has an average flow of 0.088L/minutes, while filter 3 has a flow rate of 0.026 L/minutes. Therefore, the water residence time in filter three is longest among all filters.
By introducing an average seawater sample into the three filters, the results showed that for the value of pH in all filters has been reduced. In more details, filter one has the lowest value of pH which reflects the reaction made by palm leaves chlorophyll and limestone in with oxygen worked to reduce the value of pH. On the other hand, the results of TSS showed alternative value and filter 3 has the lowest value in TSS.
The results of conductivity test for the first and second filters have indicated a slight increase while filter three has a reduced value of conductivity from 13.06 to 12.81 Ms/cm. In fact, filter three has more layers than the other two, a thicker activated carbon layer, and additional fine rubber layer. Unfortunately, the iterations of layers in filters one and two were not able to reduce the conductivity. Table 5 shows the comparison between routine tests before and after the filtration process for the three filters. There are two major reasons of having better results in filter three:
- Increasing the thickness and the number of limestone and activated carbon layers, this will increase water residence time which gives the chance to flow slower. However, increased flow rates in filter one and two have an adverse effect.
- Adding a rubber media has also brought decreased range of conductivity in filter three thus proving to be an upcoming new filter material.
However, the values of the three filters fall within the water quality standard required for agricultural activities as per water quality legalization report [53].
The methodology used for outlining seawater quality combines the advantages of implementing new materials in the filtration process with statistical reality. In fact, to support best decision, multiple performance criteria indicated that filter three can provide a better water quality as the reduction of pH, TSS, and conductivity was significant. However, highly appreciated designs require more iteration, deeper media layers, and more time to apply. Its challenging to have a proper water quality due to constrains of the experimental filter unit dimensions.
Table 5: pH, TSS, Conductivity comparison (before and after filtration)
| Before
Filtration |
After filtration | Water Quality Legislations* | ||||
| Filter 1 | Filter 2 | Filter 3 | ||||
| pH | 9.4 | 8.4 | 9 | 8.7 | 6.5-8.4 | |
| TSS (mg/L) | 12.42 | 1.682 | 2.478 | 1.200 | 1.2-10 | |
| Conductivity
Ms/cm |
13.06 | 13.33 | 13.21 | 12.81 | <1302 | |
*Oman Standard for unbottled Drinking Water [53].
Considering the current water scarcity in Oman, this paper is an additional effort to meet the expectation of Oman strategic plan and the vision of 2040. Cheap and easy techniques to produce and use the current state-of-the-art filtration materials are highly required.
4. Conclusion
This research has proposed a new method to improve water filtration, particularly, seawater. Generally, slow sand filter have a successful implantation in reducing pH, TSS, and conductivity of seawater samples. The use of natural material such as palms chlorophyll, and local limestone showed a great influence on filtration process. In addition, the use of the rubber which considered a major waste dilemma in developing countries is also improving the results of filter three. Although it’s not the standard of drinking water, all routine test values including pH, and TSS in all filters have been decreased which can meet the agricultural needs. While conductivity test for filtered seawater showed only filter three has improved the quality in comparison to the other two filters.
Through this research, it has been recommended to increase the dimensions of filters to accommodate larger quantities of water during filtration process. In addition, Increase the number of layers used in each filter will give more accurate results.
Conflict of Interest
The author declares no conflict of interest.
Acknowledgment
The research leading to these results has received funding from the Research Council (TRC) of the Sultanate of Oman under the Open Research Grant Program.
- E. Abushandi, “Flood Water Management in Arid Regions, Case Studies: Wadi Al Jizzi, Oman, Wadi Abu Nsheifah, Saudi Arabia, and Wadi Dhuleil, Jordan,” in Euro-Mediterranean Conference for Environmental Integration, Springer: 1813–1814, 2017.
- A. Thomas, K. Kani, “Efficiency of Slow Sand Filter in Wastewater Treatment,” International Journal of Scientific & Engineering Research, 7(4), 315–317, 2016.
- ITACA, An Introduction To Slow Sand Filtration, ITACA, Spain, 2005.
- G. Logsdon, A. Hess, M. Horsley, Guide to Selection of Water Treatment Process , McGraw-Hill Inc, New York, 1999.
- J. Visscher, “Slow Sand Filtration: Design, Operation, and Maintenance,” Journal (American Water Works Association), 82(6), 67–71, 1990.
- G. Hutton, L. Haller, Evaluation of the Costs and Benefits of Waterand Sanitation Improvements at the GlobalLevel, World Health Organization, Geneva, 2004.
- Environmental Protection Agency, E.P. Agency, Water Treatment Manual , Environmental Protection Agency, Ardcavan, Wexford, Ireland, 1995.
- M. Pachocka, Intermittent Slow Sand Filtration: Imptoving Their Desgin for Developing World Application, University of Delaware, New Jersey, USA, 2010.
- G. of N.U. Ministry of Irrigation and Water Resources, Technical Guidelines for the Construction and Management of Slow Sand Filters, Ministry of Irrigation and Water Resources, Government of National Unity, Khartoum, 2009.
- L. Huisman, W.E. Wood, Slow Sand Filtration, World Health Organization, Geneva, 1974.
- G. Logsdon, R. Kohne, S. Abel, S. LaBlonde, “Slow Sand Filtration for Small Water Systems,” Journal of Environmental Engineering and Science, 1(5), 339–348, 2002.
- O.B.E. Pescod, Slow Sand Filtration: A Low Cost Treatment for Water Supplies in Developing Countries , World Health Organization’s Regional Office for Europe by the Water Research Centre, England, 1977.
- A. Gottinger, D. McMartin, D. Price, B. Hanson, “The effectiveness of slow sand filters to treat Canadian rural prairie water,” Canadian Journal of Civil Engineering, 38, 455–463, 2011.
- S.T. Mitrouli, A.J. Karabelas, S.G. Yiantsios, P.A. Kjølseth, “New granular materials for dual-media filtration of seawater: Pilot testing,” Separation and Purification Technology, 65(2), 147–155, 2009, doi:https://doi.org/10.1016/j.seppur.2008.10.041.
- C.J. Williams, R.G.J. Edyvean, “An investigation of the biological fouling in the filtration of seawater,” Water Science and Technology, 38(8), 309–316, 1998, doi:https://doi.org/10.1016/S0273-1223(98)00706-9.
- S. Chan, K. Pullerits, J. Riechelmann, K.M. Persson, P. Rådström, C.J. Paul, “Monitoring biofilm function in new and matured full-scale slow sand filters using flow cytometric histogram image comparison (CHIC),” Water Research, 138, 27–36, 2018, doi:https://doi.org/10.1016/j.watres.2018.03.032.
- E. Yogafanny, S. Fuchs, U. Obst, “Study of Slow Sand Filtration in Removing Total Coliforms and E.Coli,” Jurnal Sains Dan Teknologi Lingkungan, 6(2), 107–116, 2014.
- K. V Ellis, “Slow sand filtration as a technique for the tertiary treatment of municipal sewages,” Water Research, 21(4), 403–410, 1987, doi:https://doi.org/10.1016/0043-1354(87)90187-4.
- V. Tyagi, A. Khan, A. Kazmi, I. Mehrotra, A. Chopra, “Slow sand filtration of UASB reactor effluent: A promising post treatment technique,” Desalination, 249(2), 557–571, 2009.
- R. Kohne, G. Logsdon, Slow Sand Filtration, World Water and Environmental Resources Congress 2001, 2001.
- T. Iwasaki, “Some Notes on Sand Filtration,” American Water Works Association, 29(10), 1591-1602., 1937.
- K.T. Chua, M.N.A. Hawlader, A. Malek, “Pretreatment of seawater: Results of pilot trials in Singapore,” Desalination, 159(3), 225–243, 2003, doi:https://doi.org/10.1016/S0011-9164(03)90075-0.
- K. V. Ellis, W. E. Wood, Slow sand filtration, 1985, doi:10.1080/10643388509381736.
- A. Logan, T. Stevik, R. Siegrist, “Transport and fate of cryptosporidium parvumoocysts in intermittent sand filters,” Water Resources , 35(18), 4359–4369, 2001.
- G. Palmateer, D. Manz, A. Jurkovic, R. McInnis, S. Unger, K. Kwan, B.J. Dutka, “Toxicant and Parasite Challenge of Manz Intermittent Slow Sand Filter,” Environmental Toxicology, 14(2), 217–225, 1999.
- GlobalGiving Foundation, Clean Water and Sanitation -Rainforest of Peru, 2019(13/04/2019), 2011.
- D. Li, S. Liu, Chapter 9 – Seawater Quality Detection, Academic Press: 233–249, 2019, doi:https://doi.org/10.1016/B978-0-12-811330-1.00009-0.
- G.M. Marion, F.J. Millero, M.F. Camoes, P. Spitzer, R. Feistel, C.-T.A. Chen, “ pH of Seawater,” Mar. Chem., 126, 89–96, 2011.
- B. Peucker-Ehrenbrink, G.J. Fiske, “A continental perspective of the seawater 87Sr/86Sr record: A review,” Chemical Geology, 510, 140–165, 2019, doi:https://doi.org/10.1016/j.chemgeo.2019.01.017.
- F. Telahigue, B. Agoubi, F. Souid, A. Kharroubi, “Assessment of seawater intrusion in an arid coastal aquifer, south-eastern Tunisia, using multivariate statistical analysis and chloride mass balance,” Physics and Chemistry of the Earth, Parts A/B/C, 106, 37–46, 2018, doi:https://doi.org/10.1016/j.pce.2018.05.001.
- A.J. Edwards, S. Howard, “Oceanography and marine biology, annual review: Volume 20. Margaret Barnes (ed.). Aberdeen University Press. 777 pp, 19 plates. Price £45.00. ISBN 0 08 028460 4,” Marine Pollution Bulletin, 14(8), 315–316, 1983, doi:https://doi.org/10.1016/0025-326X(83)90548-9.
- R. Brinkman, M.S. of R. Reports, Data Bank of Seawater Composition , The Middle East Desalination Research Center, Muscat, Sultanate of Oman, Delft Hydraulics, The Netherlands, 2005.
- T.F. Gibson, W.O. Watanabe, T.M. Losordo, R.F. Whitehead, P.M. Carroll, “Evaluation of chemical polymers as coagulation aids to remove suspended solids from marine finfish recirculating aquaculture system discharge using a geotextile bag,” Aquacultural Engineering, 90, 102065, 2020, doi:https://doi.org/10.1016/j.aquaeng.2020.102065.
- L. Fortunato, A.H. Alshahri, A.S.F. Farinha, I. Zakzouk, S. Jeong, T. Leiknes, “Fouling investigation of a full-scale seawater reverse osmosis desalination (SWRO) plant on the Red Sea: Membrane autopsy and pretreatment efficiency,” Desalination, 496, 114536, 2020, doi:https://doi.org/10.1016/j.desal.2020.114536.
- J.T.I. Tanzil, N.F. Goodkin, T.M. Sin, M.L. Chen, G.N. Fabbro, E.A. Boyle, A.C. Lee, K.B. Toh, “Multi-colony coral skeletal Ba/Ca from Singapore’s turbid urban reefs: Relationship with contemporaneous in-situ seawater parameters,” Geochimica et Cosmochimica Acta, 250, 191–208, 2019, doi:https://doi.org/10.1016/j.gca.2019.01.034.
- ITACA, ITACA, An Introduction To Slow Sand Filtration , ITACA , Spain, 2005.
- U.C. Terin, L.P. Sabogal-Paz, “Microcystis aeruginosa and microcystin-LR removal by household slow sand filters operating in continuous and intermittent flows,” Water Research, 150, 29–39, 2019, doi:https://doi.org/10.1016/j.watres.2018.11.055.
- F. Bichai, Y. Dullemont, W. Hijnen, B. Barbeau, “Predation and transport of persistent pathogens in GAC and slow sand filters: A threat to drinking water safety?,” Water Research, 64, 296–308, 2014, doi:https://doi.org/10.1016/j.watres.2014.07.005.
- I.M. Kumatse, H.M.K. Essandoh, N.Y. Asiedu, S. Oduro-Kwateng, “Evaluation of selected activated carbon filters and sand media for nutrient and pathogen removal from an anaerobic baffled reactor effluent system,” Scientific African, 9, e00523, 2020, doi:https://doi.org/10.1016/j.sciaf.2020.e00523.
- J. Fronczyk, K. Markowska-Lech, “Treatment efficiency of synthetic urban runoff by low-cost mineral materials under various flow conditions and in the presence of salt: possibilities and limitations,” Science of The Total Environment, 145199, 2021, doi:https://doi.org/10.1016/j.scitotenv.2021.145199.
- A. Agrawal, N. Sharma, P. Sharma, “Designing an economical slow sand filter for households to improve water quality parameters,” Materials Today: Proceedings, 2020, doi:https://doi.org/10.1016/j.matpr.2020.09.450.
- Y. Zhao, X. Wang, C. Liu, S. Wang, X. Wang, H. Hou, J. Wang, H. Li, “Purification of harvested rainwater using slow sand filters with low-cost materials: Bacterial community structure and purifying effect,” Science of The Total Environment, 674, 344–354, 2019, doi:https://doi.org/10.1016/j.scitotenv.2019.03.474.
- A. Alkhalifa, K. Abbas, K. Awad, Phytohormones and Pigments Content in Date Palm Phoenix dactylifera L. under Salinity Stress, 2017, doi:10.12983/ijsras-2017-p0036-0042.
- S.M. Rao, R.E. Joshua, M. Rekapalli, “Batch-scale remediation of toluene contaminated groundwater using PRB system with tyre crumb rubber and sand mixture,” Journal of Water Process Engineering, 35, 101198, 2020, doi:https://doi.org/10.1016/j.jwpe.2020.101198.
- D.G. Bourne, R.L. Blakeley, P. Riddles, G.J. Jones, “Biodegradation of the cyanobacterial toxin microcystin LR in natural water and biologically active slow sand filters,” Water Research, 40(6), 1294–1302, 2006, doi:https://doi.org/10.1016/j.watres.2006.01.022.
- M.A. Kendouci, B. Kharroubi, R. Khelfaoui, A. Bendida, B. Dennai, A. Maazouzi, “Simulation of Water Filtration in Porous Zone Based on Darcy’s Law,” Energy Procedia, 36, 163–168, 2013, doi:https://doi.org/10.1016/j.egypro.2013.07.019.
- C. Crowe, D. Elger, J. Robertson, Engineering Fluid Mechanics (8th ed.), John Wiley & Sons, 2005.
- P.A. Domenico, F.W. Schwartz, Physical and Chemical Hydrogeology , John Wiley & Sons, New York , 1990.
- N. Najid, S. Kouzbour, A. Ruiz-García, S. Fellaou, B. Gourich, Y. Stiriba, “Comparison analysis of different technologies for the removal of boron from seawater: A review,” Journal of Environmental Chemical Engineering, 105133, 2021, doi:https://doi.org/10.1016/j.jece.2021.105133.
- W.D. Oh, M.G.-H. Lee, W.D.C. Udayanga, A. Veksha, Y. Bao, A. Giannis, J.-W. Lim, G. %J J. of E.C.E. Lisak, “Insights into the single and binary adsorption of copper (II) and nickel (II) on hexagonal boron nitride: Performance and mechanistic studies,” 7(1), 102872, 2019.
- A. Belgada, B. Achiou, S. Alami Younssi, F.Z. Charik, M. Ouammou, J.A. Cody, R. Benhida, K. Khaless, “Low-cost ceramic microfiltration membrane made from natural phosphate for pretreatment of raw seawater for desalination,” Journal of the European Ceramic Society, 41(2), 1613–1621, 2021, doi:https://doi.org/10.1016/j.jeurceramsoc.2020.09.064.
- C. Del Fierro, R. Lloyd, H. %J e-R.A.J. of U.W. el-Askary, “Effects of Ocean Acidification on Chlorophyll Content,” 1(2), 6, 2014.
- D.G. for S. and Measurement, M. of C. and Industry, Oman Standard for Unbottled Drinking Water , Ministry of Commerce and Industry, Oman, 2006.