
Architecture of Real-Time Patient Health Monitoring Based on 5G Technologies
Volume 6, Issue 2, Page No 351-358, 2021
Author’s Name: Majda Lakhala), Mohamed Benslimane, Mehdi Tmimi, Abdelali Ibriz
View Affiliations
Innovative Technologies Laboratory, Higher School of Technology, Sidi Mohamed Ben Abdellah University FEZ, 30050, Morocco
a)Author to whom correspondence should be addressed. E-mail: majda1lakhal@gmail.com
Adv. Sci. Technol. Eng. Syst. J. 6(2), 351-358 (2021); ![]() DOI: 10.25046/aj060240
DOI: 10.25046/aj060240
Keywords: COVID-19, Wireless Sensor Network (WSN), Wireless Body Area Network (WBN), Sensors, Telemedicine, Electrodes, Electrocardiograph (ECG), Oximeter

Export Citations
Worldwide, the epidemiological situation is constantly changing and with the exponential increase in the number of confirmed coronavirus cases, the number of health care workers has decreased significantly and this is due to the direct and daily contact of patients. One of the major challenges of the last few months is to prevent the spread of the new Covid-19 virus. The most recommended solution to this problem is telemedicine, which brings benefits in terms of reducing healthcare expenditure, improving the quality and safety of care, in order to protect healthcare workers from the risks of contamination and reduce the constraints related to patient shifting. This document presents our thoughts on how to guarantee the safety of healthcare workers, by implementing an application based on wireless sensor networks with introducing the 5G technologies to satisfy high-speed transmission. This involves transmitting medical data from several sensors placed on the patient’s body, which measure physiological signs in real time, to the hospital server via the Internet, to produce medical information useful for diagnostic and monitoring purposes. Therefore, the doctor will be able to consult and analyze the patient’s medical file through a communication interface between the patient and the doctor developed in JEE, as it can receive an SMS in case of emergency.
Received: 11 December 2020, Accepted: 28 February 2021, Published Online: 17 March 2021
1. Introduction
On January 9 2020, the world has known the emergence of a new coronavirus officially called SARS-CoV-2. This new virus has been identified for the first time in the city of Wuhan in China in December 2019. This new infectious respiratory disease called Covid-19 [1] spread rapidly in China and several other countries within six months after its appearance, infecting more than 188 countries and territories around the world. As of December 2020, nearly 70 million people were infected and 1.6 million people have died worldwide since the beginning of the pandemic [1]. In April 2020 the countries with the most reported physician deaths were Italy (44%), Iran (15%), Philippines (8%), Indonesia (6%), China (6%), Spain (4%), USA (4%) and UK (4%) and yet healthcare professionals must continue to face the health crisis [2].
Every person working in the health sector has the right to be safe and every sick person has the right to receive the appropriate treatment and care. In this respect, the best solution is to opt for telemedicine in order to reduce the risk of contamination while avoiding direct contact between patients, professional healthcare, and managing asymptomatic cases or symptomatic patients from their homes.
The objective of our article is to present the new technologies used in telemedicine, thus, we propose to ensure the continuous monitoring of patients by introducing 5G technology to ensure the coverage of necessary medical care remotely, regardless of the patient’s geographical location, and also to meet the requirements of high-speed transmission of massive multimedia medical data. At the same time, this architecture can be valuable to protect and provide a healthy and safe working environment for healthcare workers and reduce the pressure on health centers which can no longer accommodate infected people.
The proposed system is equipped with the most commonly used medical sensors in the clinic for diagnosing and monitoring patients, such as Electrocardiograph (ECG), Oximeter and temperature sensors that are linked together to form a wireless network using communication protocols such as ZigBee. These sensors are managed by the TinyOS system, which is the most widely used system in sensor applications today. This system is used to check the patient’s state of health whether he is well or not by analyzing the medical signals collected from the sensors. If the results of the analysis are abnormal, an SMS containing the measured values and the patient’s details will be sent by the server to the healthcare professional to save his or her life.
To consult and analyze the patient’s medical record, an application in JEE programming (struts 2, hibernate 3, MVC 2, JavaMail and DisplayTag) is already developed by our team. It offers to cardiac patients a space for communication, consultation and medical monitoring. The proposed architecture is an additional module to store in the patient’s database measurements taken in real time by the sensors.
2. Telemedicine Serving Populations
Telemedicine is a remote medical practice using information and communication technologies to provide home monitoring of patients by one or more health professionals. It can be carried out using any technological means currently available such as computer, mobile phone or tablet equipped with Internet connection. Also, we can set up developed devices that can-do detection, data processing, networking and communication to facilitate to the caregiver to monitor patients by receiving the necessary information.
2.1. Monitoring devices used in telemedicine
E-stethoscope is one of the devices designed for routine monitoring of heart disease, it has been developed for real-time cardiac monitoring, this device performs pre-processing and signal supply, and allows to display these signals on the LCD screen. In addition, data can be transmitted to the PC via Bluetooth or a serial port, in order that the doctor can diagnose from his computer. This device is suitable for assisted healthcare, its advantage is to reduce the frequent contact of the patient [3].
There is also a new stethoscope that can be connected to a smartphone that allows patients to use this device from home, as they can perform various tests on the signals observed using a mobile application and send data to a doctor for diagnosis [4].
The developers have designed a more advanced monitoring system that can monitor patients who have chronic diseases, in real time, such as heart rate, blood pressure, diabetes and it can even measure temperature, it also has the ability to store data and alert doctors to quickly intervene in case of emergency [5].
For elderly patients, a biosensor is used to monitor vital signs in real time and can even detect the patient’s location. This portable system is used to collect physical data. This data is then transmitted to the intelligent server via GPRS (General packet radio services) for further analysis [6].
Smart beds are a highly recommended solution at this time because they contain biosensors for respiration, temperature and heartbeat that allow doctors to monitor patients remotely. The data can be reviewed for sleep, heart rate and respiratory rate analysis. In emergency situations, these devices can generate an alarm or send an alert to caregivers for immediate intervention [7].
For patients who are monitored remotely or who receive treatment at home, Sivaraj and other developers proposed an idea of an intelligent ambulance in order to reach hospitals faster. This ambulance is equipped with devices that observe the vital signs of a patient and send the information to the hospital for prearrangement. It also contains a system that can automatically change the traffic lights. Another study aims to find the fastest route for the ambulance [8].
In order to prevent the spread of the virus a technique of real-time detection of facial disorders has been proposed by installing devices at the entrance of hospitals, schools or public places. The technique offers a great potential for monitoring and surveillance and it is useful for colds, flu and detection of facial temperature, which allows the identification of people with contagious diseases [9].
3. The Wireless Sensor Network
The wireless sensor network is a field composed of sensor nodes as shown in figure 1. Each node has the capacity to collect information and transmit it to the node, which then transfers this information via the Internet or satellite to the central computer to study and analyze the data.
In the field of Internet of Things applications, sensor networks are made up of sensor devices which is an organ that collects information from physical quantities (temperature, force, position, speed, brightness) to transform them to a digital signal.
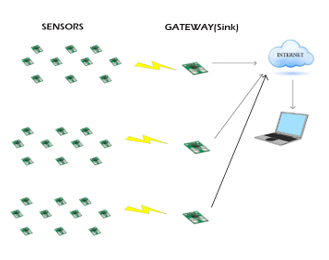 Figure 1: WSN Architecture
3.1. Transmission techniques of a WSN
Operations on networks around the world require transmission media. The main transmission techniques used are radio communication, infrared media and optical media. To deploy a large number of sensors we need maintenance of the network topology. This maintenance consists of three phases: Pre-deployment and deployment phase (installation of sensors), Post-deployment phase (some sensors may fail), Phase of redeployment of additional nodes (replace failed nodes).
3.2. Wireless sensors in different fields
In many fields, we need to monitor physical parameters in order to study and monitor phenomena, events or diseases [10].
- Military field: There are military applications for battlefield surveillance, recognition and detection of nuclear, biological and chemical attacks…
- Agriculture: implement sensors in the soil to measure humidity, temperature, etc.
- Environmental control: WNS built to study complex phenomena such as earthquakes, volcanoes and storms…
- Health-related applications: these applications allow the monitoring and surveillance of a disease progression, the implementation of sensor nodes in the patient’s body for real-time diagnosis, blood glucose monitoring, early detection of cancers, etc. [10]
3.3. Wireless body network and the main sensors used in the medical field
A WNS in the medical field is known as a WBAN. This Wireless Body Area Network (WBAN) is a network that provides continuous monitoring of the human body through sensors located inside or outside a body to take measurements and transmit them to the base station. It allows the information collected to be shared anytime and anywhere over a long period of time. We find in the Table 1 the main sensors most used in medicine.
Table 1: The most used sensors in medicine
| SENSOR | DESCRIPTION |
| Electrocardiogram | The Electrocardiogram (ECG) records the electrical activity of the heart. It is used to diagnose heart disease or to monitor heart rhythm disorders. |
| Electromyogram | The Electromyogram (EMG) is used to diagnose the functioning of nerves and muscles by means of electrical impulses. |
| Electroencephalogram | The Electroencephalogram (EEG) measures the electrical activity of the brain by attaching small electrodes to various locations on the scalp. |
| Blood glucose | This sensor measures the concentration of glucose in the interstitial fluid (interstitial glucose). |
| Temperature sensors | It allows to measure the temperature of the human body |
| Oximeter | The Oximeter allows to measure in real time and continuously the concentration of oxygen circulating in the arteries. It is used to monitor patients who have respiratory problems. |
| Blood pressure | The blood pressure sensor is used to measure diastolic and systolic pressure. |
| Accelerometer | This sensor is used to recognize the posture of the body (standing, sitting, kneeling, walking, running …). |
4. Architecture of the proposed solution based on wireless sensors
Figure 2 represent the architecture proposed in our project is applied on some patients with corona virus and who have chronic diseases. It can also be applied on patients who have other chronic diseases, the difference will be just in the choice of the sensor.
The WBAN network can be divided into 3 sections. The first section represents Intra-BAN communication, which is a communication between the sensor node and the personal server. The sensor node stores physiological data retrieved from the sensors placed on the human body and then transmits them via a wireless network to a central processing device known as the personal server. The second section represents Inter-BAN communication, it is done between the personal server, which can be a cell phone, a personal assistant (PDA) or a personal computer, and the access point. Communication between the access point and the medical team via 5G connection represents the third section, which is the communication outside the BAN.
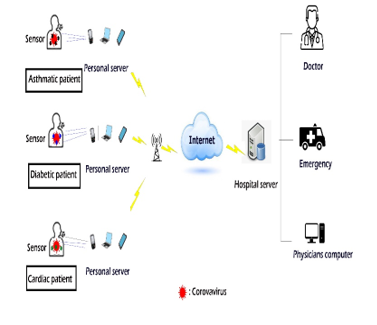 Figure 2: Architecture of the proposed solution based on wireless sensors
The electronic medical records of patients are stored in the hospital server, which can also provide various services such as user authentication, recognition of health anomalies, transmission and sending of emergency alerts to medical staff. The patient’s doctor can access the patient’s data from his PC via the Internet and examine it to ensure that the patient is complying with the expected health parameters (temperature, heart rate, blood pressure, etc.).
In the case of a cardiac patient with corona virus and respiratory problems, we will need a body temperature sensor that will be placed on the patient’s hand to measure the body temperature, a sensor that measures the concentration of oxygen flowing in the arteries, placed on the patient’s finger as with the pulse oximeter, and we will also need sensors that allow us to record the electrical activity of the heart. Their location will be like the location of the electrodes of the ECG to have the exact data.
4.1. Communication protocols
Among the most used wireless communication protocols that allow data transmission in networks are WiFi, Bluetooth, Zigbee.
ZigBee is designed to manage short distance communications, it range of 300 meters and it offers low energy consumption,it has three radio bands that operate in 868MHz, 915MHz, and 2.4GHz and it can accommodate up to 6000 devices [11].
Bluetooth is based on the IEEE 802.15.1 standard, it preferred in the case of a system whose interoperability is essential and whose autonomy may be limited, it ranges of 10 meters [11]. Wifi is based on the IEEE 802.11 standards, it operates in 2.4GHz and 5GHz bands and it requires high power and has the advantages of a high data rate and long distances [11].
4.2. ZIGBEE protocol
In our system we have opted for ZigBee technology which is an “open source” network, it is the most widely used in medical monitoring applications. It is supported by the IEEE802.15.4 standard, which standardizes two basic PHY and MAC layers of the network, which are layers 1 and 2 of the OSI model, and is a wireless data transmission standard allowing machine-to-machine communication at very low cost, low data rates, small footprint and with very low power consumption [12].
The Physical Layer (PHY) is the lowest layer defined in the IEEE 802.15.4 standard. This layer translates the frames sent and received into bits and manages the use of radio transmission and channel communication [13].
The role of the MAC layer is to control access to the radio channel via the CSMA/CA (Carrier Sense Multiple Access with Collision Avoidance) mechanism. This includes coordinating access to the common radio link and scheduling and routing data frames. Using the CSMA/CA mechanism is an access method used on bus topologies. Its purpose is to avoid collisions and to detect them if they occur [14].
The ZigBee protocol uses only four of the seven layers of the OSI model. It includes a Physical (PHY) layer that contains the radio frequency (RF) of the transceiver and its low-level control mechanism, and a MAC (Medium Access Control) sublayer that provides access to the physical channel for all types of transfers. The upper layers consist of a NWK (Network Layer), which provides network configuration, message handling and routing, and an APL (Application Layer), which is equipped with two APS (Application Support Sub-Layer) sub-layers, which is in charge of managing the mapping table used to associate the devices with each other and the ZDO (Zigbee Device Object) entity, which is responsible for defining the role of an object in the network and securing the relations between the devices [15].
4.3. Why choose the 5g technology?
Compared to other generations of wireless communications, 5G offers advantages in terms of low latency, high reliability and mobility, providing an excellent opportunity to the development of telemedicine [16].
Telemedicine based on 5G technologies integrates the wireless communication technology of intelligent equipment and high-speed mobile communication technology in different modes, which can perform remote surgery, remote consultation, patient monitoring, decision making in case of emergency rescue. In addition, 5G-based telemedicine can also support the high-speed transmission of massive multimedia medical data, and further realize the sharing of medical resources.
5G networks are built around three development axes [17]:
- Speeds: in the continuity of current networks and to cope with the increasing demand of traffic, 5G networks will need to be able to achieve speeds up to ten times greater than in 4G.
- Latency: The response time of 5G networks will be divided by 10 to allow the development of new uses such as the autonomous car or telemedicine.
- Density: 5G embeds the Internet of Things (IoT) and will therefore have to manage millions of connections.
4.4. TinynOs and there Simulation tools
TinyOS [18] is an operating system designed for wireless sensor networks, developed by the American University of BERKELEY, which works in an event-driven mode (i.e. it only becomes active when certain events occur). It has the advantage of allowing simple and powerful programming while keeping the portability of the code for many supported platforms. Its design has been entirely made in NesC [19], a component-oriented language that is syntactically similar to the best known language C. TinyOS has been created to meet the characteristics and requirements of sensor networks, such as: Small memory size, low power consumption, intensive support operations, robust operations and is optimized in terms of memory and power usage.
TinyOs offers Simulation tools [20] (TinyViz /Tossim / PowerTossim )
- TOSSIM is the simulator of TinyOs. It is a simulator / emulator with discrete events of wireless sensor network. It gives us an idea on the network operation, transmission/reception, radio links between nodes, error messages, etc.
- PowerTossim allows to model the energy consumption of an application. It performs simulations in the same way as TOSSIM except that it takes into account the power consumption.
- TinyViz is a graphical application that gives an overview of our network of sensors at any time, as well as the various messages they emit. The application allows a step-by-step analysis by activating the different available modes, it also has options to simulate energy consumption.
4.5. The functioning and the placement of sensors ECG
The standard peripheral electrodes are placed as shown in figure 3, they explore the cardiac electric field in a frontal plane. On the posterior aspect of the wrist joint place the red electrodes on the right and the yellow electrodes on the left and on the inner aspect of the ankle joint place the black electrodes on the right and the green electrodes on the left [21].
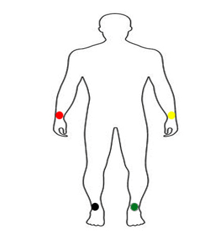 Figure 3: Peripheral electrode location [22]
These electrodes define 6 leads as shown in figure 4: 3 bipolar leads, I records the potential changes between the left arm and the right arm, II records the potential changes between the right arm and the left leg, and III records the potential changes between the left arm and the left leg. The other 3 leads (aVR, aVL, aVF) are unipolar. They record the same phenomenon, but in relation to a reference zero, obtained by a mounting device (Wilson bridge).
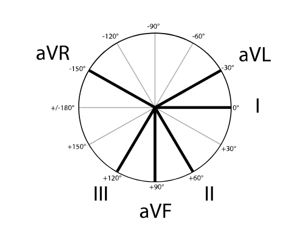 Figure 4: Direction of peripheral branches and angles separating them [21]
In addition to the peripheral electrode, there are the precordial electrodes which are placed on the costal grid as shown in figure 5. They are arranged on a horizontal plane to explore different parts of the ventricles, each electrode being placed at a different location [23] :
- V1 is placed in the right parasternal position at the edge of the sternum.
- V2 is symmetrical to V1 with respect to the sternum in the left parasternal position.
- V3 between V2 and V4
- V4 5th intercostal space and it’s placed in the mid-clavicular line.
- V5 on the anterior axillary line between V4 and V6
- V6 is on the middle axillary line,
- V7 on posterior axillary line,
- V8 under the tip of the scapula and even horizontal as V4,
- V9 halfway between V8 and the posterior spines .
- V3R symmetrical to V3
- V4R symmetrical of V5
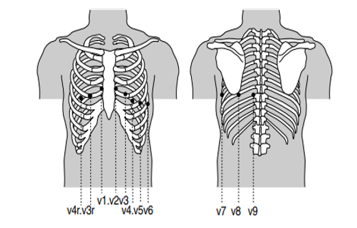 Figure 5: Location of the electrodes on the costal grid [24].
Figure 6 is a graphic representation of the electrical activation of the heart using an electrocardiograph, for each lead an ECG trace is recorded, 12 leads are classically recorded on the ECG trace and can be extended to 18 leads under certain circumstances.
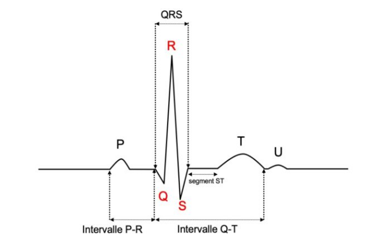 Figure 6: ECG Signal [22]
This activity is collected on a patient lying down, at rest, by electrodes that record electrical signals (deflections) placed on the surface of the skin. In order for an ECG to be normal, several points must be present, among which are [23]:
- In adults The normal heart rate (coming from the sinus node in the right atrium) is a regular rhythm with a sinus rate between 60-100/min. Below 50/minute it is called bradycardia and above 100 it is tachycardia.
- Each sinus P wave precedes each QRS to detect conduction disorders between the atria and ventricles.
- The space between two QRSs must always be the same, which indicates that the heart rhythm is regular.
- The morphology of the atrial P wave and the ventricular QRS complex should be normal.
- The P-R (or P-Q) interval has a constant duration (0.12 to 0.20 s).
- QRS have a frontal axis between -30 to 90°.
- The ST segment is isoelectric to the PQ segment.
- The T wave is asymmetric and positive and its maximum amplitude < 2/3 of QRS and minimum > 10% of R.
4.6. The operation and the position of an oximeter
In the intensive care setting, oximeter is one of the most widely used monitoring tools in intensive care units, operating rooms and at the patient’s home to monitor sleep disorders. It distinguishes arterial saturation from hemoglobin in O2 [25]. The oximeter is often placed on the fingertip such as figure 7, which is very well vascularized, it can also be placed on the nose, ear or toe.
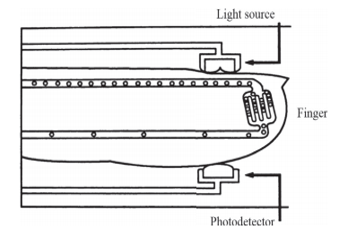 Figure 7: Optical setup [21]
The sensor contains two diodes emitting red light, the principle is based on the emission of two lights (red and infrared) [25], respectively 660 and 940 nm.
The absorption of the red and infrared light will vary depending on whether it encounters reduced non-oxygenated hemoglobin (Hb) or oxyhemoglobin (HbO2).
The information collected by the temperature sensor, oximeter and cardiac disorder sensors will be collected and transmitted to the hospital server after having gone through the steps shown in Figure 2.
5. Healthcare platform
In order for doctors to be able to consult and analyze the patient’s medical record, we need a medical platform reserved for patients and healthcare professionals with access rights granted by the administrator who is responsible for maintaining the application and managing user accounts. He ensures the proper functioning of the data server and its security.
Once authentication is accepted, the doctor will be able to retrieve a specific patient’s medical file containing all the information necessary for the patient’s care and monitoring. The patient’s record is not just the written observation of the doctor or the notes of the nurse. It encompasses everything that can be stored in a patient’s file: administrative, clinical, paraclinical, diagnostic, therapeutic, preventive and prognostic data as well as the intervention of all those involved in the care of the patient.
The application also offers a communication space to keep contact between the patient and the doctor via correspondence or notification. Figure 8 represent the platform’s interface developed by our teams.
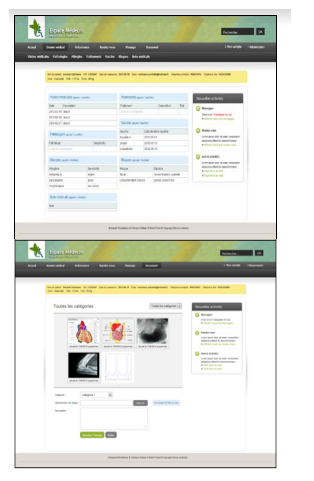 Figure 8: platform’s interface [22]
6. The relevance of the proposed solution
The coronavirus disease (COVID19) has been a major concern because of its very rapid spread in many countries. The statistics in the figure 9 show the number of people infected and dead by the coronavirus worldwide as of March 1, 2021. Out of a total of 113,820,168 confirmed cases of virus-related infections, 2,527,891 died [26].
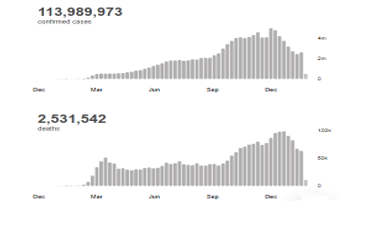 Figure 9: Number of infections and deaths due to COVID-19 worldwide [26]
This contagious and deadly disease also exposes the medical profession to major risks. On May 8, 2020, the total number of healthcare workers reported infected was 152,888 and 1413 deaths worldwide (as shown in figure 10 and figure 11). This suggests that for every 100 healthcare workers who were infected, one died. The number of infected healthcare workers represents 3.9% of the total number of 3,912,156 patients with COVID-19 and the number of healthcare workers who died represents 0.5% of the total number of 270,426 deaths by COVID-19 worldwide. It should be noted that 118,801 of these patients with COVID-19 and 2,922 deaths were reported in countries where data on healthcare worker infections and deaths were not available. A total of 130 countries reported at least one case of COVID-19 infection among healthcare workers and 67 countries reported at least one healthcare worker death related to COVID-19. China and Italy were the first two countries to report health worker deaths due to Covid-19, and the first deaths in each of these countries occurred more than one month apart [27].
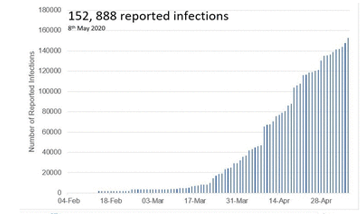 Figure 10: Number of reported COVID-19 infections in healthcare workers worldwide [27]
The high rate of infected patients requiring follow-up has exhausted the efforts of the medical staff and the number of hospital beds. Statistically, the majority of countries with hospital bed data are in the range of 0 to 299 hospital beds per 100,000 population. As shown in the figure 12, 79 (43%) countries had less than 200 hospital beds per 100,000 population, while 37 (20%) countries reported between 200 and 299 hospital beds per 100,000 population and only 13 countries (7.1%) reported more or equal to 700 beds per 100,000 population. For countries shaded in grey, data on the number of hospital beds are not available [28].
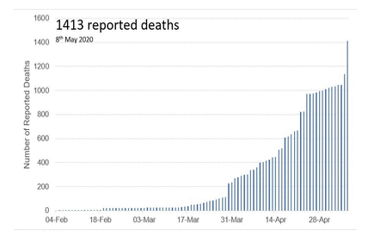 Figure 11: Number of reported COVID-19 deaths in healthcare workers worldwide [27]
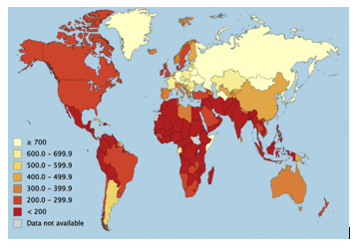 Figure 12: Number of Hospital Beds per 100,000 Population [28]
With regard to the points mentioned, which mainly concern the life of the medical staff, the conditions of their work, and the capacity of the hospital centers, our solution seems to be very important which will limit the infection of the staff, absorb the wave of hospitalizations of patients suffering from COVID-19 and continue to take care of those suffering from chronic diseases.
7. Conclusion
Around the world, doctors, nurses, caregivers, administrators and paramedics work in stressful and frightening environments and risk their lives to save their patients. Much scientific and clinical research has been proposed to control patients infected with COVID-19 but knowledge of this disease remains incomplete and evolving, posing an ongoing challenge to our understanding and clinical management. Therefore, the proposed architecture for remote patient monitoring based on the wireless sensor network and 5G technologies will reduce patient travel and frequent contact with physicians while obtaining the necessary medical care. Healthcare workers will be able to perform a global assessment of the patient through the physiological information retrieved from the sensors placed on the patient’s body that will be transmitted to the hospital server that will interpret and send it to the doctors. The future extension of this work consists of implementing this architecture using a simulator in order to apply it to real patients.
- Coronavirus Disease (COVID-19) Situation Reports-51, Mar. 2021.
- K.P. Iyengar, P. Ish, G.K. Upadhyaya, N. Malhotra, R. Vaishya, V.K. Jain, “COVID-19 and mortality in doctors,” Diabetes and Metabolic Syndrome: Clinical Research and Reviews, 14(6), 1743–1746, 2020, doi:10.1016/j.dsx.2020.09.003.
- Y. Tang, G. Cao, H. Li, K. Zhu, “The design of electronic heart sound stethoscope based on Bluetooth,” in 2010 4th International Conference on Bioinformatics and Biomedical Engineering, iCBBE 2010, 2010, doi:10.1109/ICBBE.2010.5516342.
- C. Aguilera-Astudillo, M. Chavez-Campos, A. Gonzalez-Suarez, J.L. Garcia-Cordero, “A low-cost 3-D printed stethoscope connected to a smartphone,” in Proceedings of the Annual International Conference of the IEEE Engineering in Medicine and Biology Society, EMBS, Institute of Electrical and Electronics Engineers Inc.: 4365–4368, 2016, doi:10.1109/EMBC.2016.7591694.
- A. Abdullah, A. Abou-Elnour, M. Tarique, “Real Time Wireless Health Monitoring Application Using Mobile Devices Article in International journal of Computer Networks & Communications ·,” 2015, doi:10.5121/ijcnc.2015.7302.
- A. Bourouis, M. Feham, A. Bouchachia, “Ubiquitous Mobile Health Monitoring System for Elderly (UMHMSE),” International Journal of Computer Science & Information Technology (IJCSIT), 3(3), 74–82, 2011.
- F. Al-Turjman, M.H. Nawaz, U.D. Ulusar, Intelligence in the Internet of Medical Things era: A systematic review of current and future trends, Computer Communications, 150, 644–660, 2020, doi:10.1016/j.comcom.2019.12.030.
- P. Manikanta, S.H. Sk, R. Tamil Kodi, “Iot Ambulance with Automatic Traffic Light Control,” in Proceedings – International Conference on Vision Towards Emerging Trends in Communication and Networking, ViTECoN 2019, Institute of Electrical and Electronics Engineers Inc., 2019, doi:10.1109/ViTECoN.2019.8899469.
- R. Mccready, Real-Time Face Detection on a Configurable Hardware Platform.
- B. Mohamed, A. Ibriz, H. Mostafa, “COOPERATIVE COMMUNICATION AND COOPERATION TECHNIQUES IN SENSOR NETWORKS,” Journal of Theoretical and Applied Information Technology, 10(1), 2013.
- S.J. Danbatta, A. Varol, “Comparison of Zigbee, Z-Wave, Wi-Fi, and bluetooth wireless technologies used in home automation,” in 7th International Symposium on Digital Forensics and Security, ISDFS 2019, Institute of Electrical and Electronics Engineers Inc., 2019, doi:10.1109/ISDFS.2019.8757472.
- M.H. Aly, Scalable ZigBee-Based Smart Authentication and Access Control System Design Using XMOS Programmable Chips, 2011.
- M. Bakkari, B. Mohammed, B. Adnan, “Implémentation du Wireless Personal Area Network ( WPAN ) dans les PME marocaines: cas du protocole ZigBee,” (February 2016), 2014.
- S.C. Ergen, ZigBee/IEEE 802.15.4 Summary, 2004.
- D.E. La, M. En, G. Électrique, UNIVERSITÉ DU QUÉBEC À MONTRÉAL ÉTUDE COMPARATIVE DES PROTOCOLES ZIGBEE PRO ET ZIGBEE IP MÉMOIRE PRÉSENTÉ COMME EXIGENCE PARTIELLE.
- A.H. Sodhro, M.A. Shah, “Role of 5G in medical health,” in ICIEECT 2017 – International Conference on Innovations in Electrical Engineering and Computational Technologies 2017, Proceedings, Institute of Electrical and Electronics Engineers Inc., 2017, doi:10.1109/ICIEECT.2017.7916586.
- N. Al-Falahy, O.Y. Alani, Technologies for 5G Networks: Challenges and Opportunities, IT Professional, 19(1), 12–20, 2017, doi:10.1109/MITP.2017.9.
- TinyOS Home Page, Mar. 2021.
- nesC: A Programming Language for Deeply Networked Systems, Mar. 2021.
- K. Lahmar, M.F. Megdiche, C. Belleudy, M. Abid, M. Auguin, Estimation de la consommation dans les réseaux de capteurs sans fils: étude de cas.
- Michel Nahon, Positionnement des électrodes, UOL Université Paris V, (2005).
- B. Mohamed, A. Bouayad, A. Ibriz, H. Mostafa, “ARCHITECTURE OF A TELEMEDICINE SYSTEM FOR MONITORING SICK HEART REMOTELY,” Journal of Theoretical and Applied Information Technology, 10(1), 2013.
- J.J. Goy, J.-C. Stauffer, J. Schlaepfer, P. Christeler, eds., Electrocardiography (ECG), BENTHAM SCIENCE PUBLISHERS, 2013, doi:10.2174/97816080547941130101.
- C. Chapelon-Abric, Méthode d’analyse des électrocardiogrammes de surface douze dérivations, EMC – Cardiologie-Angeiologie, 1(2), 97–105, 2004, doi:10.1016/j.emcaa.2004.03.003.
- A. Von Chong, M. Terosiet, A. Histace, O. Romain, “Towards a novel single-LED pulse oximeter based on a multispectral sensor for IoT applications,” Microelectronics Journal, 88, 128–136, 2019, doi:10.1016/j.mejo.2018.03.005.
- WHO Coronavirus Disease (COVID-19) Dashboard | WHO Coronavirus Disease (COVID-19) Dashboard, Mar. 2021.
- S. Bandyopadhyay, R.E. Baticulon, M. Kadhum, M. Alser, D.K. Ojuka, Y. Badereddin, A. Kamath, S.A. Parepalli, G. Brown, S. Iharchane, S. Gandino, Z. Markovic-Obiago, S. Scott, E. Manirambona, A. Machhada, A. Aggarwal, L. Benazaize, M. Ibrahim, D. Kim, I. Tol, E.H. Taylor, A. Knighton, D. Bbaale, D. Jasim, H. Alghoul, H. Reddy, H. Abuelgasim, A. Sigler, K. Saini, et al., Infection and mortality of healthcare workers worldwide from COVID-19: A scoping review, MedRxiv, 2020.06.04.20119594, 2020, doi:10.1101/2020.06.04.20119594.
- B. Sen-Crowe, M. Sutherland, M. McKenney, A. Elkbuli, “A Closer Look Into Global Hospital Beds Capacity and Resource Shortages During the COVID-19 Pandemic,” Journal of Surgical Research, 260, 56–63, 2021, doi:10.1016/j.jss.2020.11.062.