
Investigation of the Impact of Distributed Generation on Power System Protection
Volume 6, Issue 2, Page No 324-331, 2021
Author’s Name: Ayoade F. Agbetuyi1, Owolabi Bango1, Ademola Abdulkareem1, Ayokunle Awelewa1, Tobiloba Somefun1,a), Akinola Olubunmi2, Agbetuyi Oluranti3
View Affiliations
1Department of Electrical and Information Engineering, Covenant University, Ota, 112107, Nigeria
2Department of Electrical and Electronics Engineering, Federal University of Agriculture Abeokuta, Nigeria
3Department of Physics, Ekiti State University, Ado Ekiti, Nigeria
a)Author to whom correspondence should be addressed. E-mail: tobi.shomefun@covenantuniversity.edu.ng
Adv. Sci. Technol. Eng. Syst. J. 6(2), 324-331 (2021); ![]() DOI: 10.25046/aj060237
DOI: 10.25046/aj060237
Keywords: Power system, Protection relay, Distributed generators, Distribution network

Export Citations
Integration of Distributed Generation (DG) on distribution networks has a positive impact which includes the following: low power losses, improved utility system reliability and voltage improvement at buses. A real distribution network is radial in which energy flow is unidirectional from generation to transmission and from distribution to the load. However, when a DG is connected to it, the power flow becomes bidirectional, and the protection setting of the network may be affected. Therefore, the aim of this research work is to investigate the impact of distributed generation DG on power system protection. The test distribution network is first subjected to load flow analysis to determine its healthiness with and without DG connection. The load flow results confirm that the integration of the DG into the distribution network reduces the active power load loss by 92.68% and improves voltage profiles at each bus of the network by 90.72%. Thereafter, the impact of DG on the protection setting of the existing test network was investigated. Integrating DGs to the network, from our result, shows an increase in the fault currents, which in turn caused false tripping, nuisance tripping, and blinding of protection relay compared with when DGs are not connected. The protection relays were reset at the point of common coupling (PCC) to prevent any abnormal tripping. This is the major contribution of the research work.
Received: 18 November 2020, Accepted: 24 January 2021, Published Online: 17 March 2021
1. Introduction
Integration of distributed generation (DG) into the distribution systems offers many advantages and disadvantages to the distribution network [1, 2]. Economic and environmental benefits, and increased penetration of DGs, will impose significant technical barriers on the efficient and effective operation of the distribution systems. Increase in fault current and changes of power flow from unidirectional to bi-directional are the major two impacts of DG on the distribution networks, and these affect the existing protection of the distribution system relay, especially the over-current relays. Therefore, the impacts of DGs on the existing distribution system must be thoroughly investigated in order to ensure the stability and reliability of the system. The integration of DG into the distribution network has a great impact on the steady-state and transient behaviour of the network which depends on the DG capacity and penetration levels, type of generator, the method by which the generator is interfaced with the network and the location of the connected DG [3, 4], just as in the case of capacitor and or phase measurement unit (PMU) placement. The steady-state behaviour of the network describes the healthiness of distribution network before and after the integration of the DG. This is carried out by load flow analysis on the network, while the transient behaviour of the network has to do with the stability and the setting of the protection relay [3] which is a major concern in this research work. Among all other challenges affecting the integration of DG into the distribution networks, protection issues are considered one of the major concerns because they are directly related to the system’s safety and reliability.
DG has positive and negative impacts on the distribution networks. DG positive impacts are as follows, improved the voltage profile, improved power quality, and reduces the power losses in the distribution network; it eliminates the additional transmission and distribution capacity and improved reliability of the system [5, 6] among others. The negative impacts include lack of safety of the public and utility personnel, damage to the plant in the event of unsynchronized reclosure protection performance degradation, etc. [7, 8]. The integration of DGs makes the distribution network no longer operate as a passive system but now operates as bidirectional power flow which may affect the network protection. This could lead to lack of relay coordination among the different protection schemes of the system [9, 10]. Therefore, the traditional protection schemes used in the distribution system need to be re-evaluated or reset with the integration of DG. However, before the protection issues are considered, it is very necessary to ascertain the healthiness of the existing distribution network with and without DG connection. Emphasizes here are on the power losses and voltage profile at each bus.
2. Literature Review
This section provides a critical review of the relevant literature that is related to the study. The impact of DG on short circuit current flowing in the network depends on the location, capacity and the type of bus to which the DG is connected. Utilities are no longer embarking on building large generating plants. Distributed generator serves as an alternative for generating energy resources [11]. There are many benefits of DG integration, but the penetration of DG into the distribution network may cause protection issues in the existing distribution network because it is designed to operate as a radial network. The major challenges that are related to power system protection as a result of the integration of DGs according to reference [12] include the following: blinding, false tripping of feeders, nuisance tripping of protection schemes, unintentional islanding, increasing of fault levels, neutral shifting, resonance, automatic recloser out of synchronism.
False tripping and islanding operations were prevented via proper coordination of the protection relay with high penetration of DG into the distribution network according to the investigation by authors in references [9,13]. Also, [14] researched the effect of protection and fault current on high penetration of DG with the distribution system. His result showed that the penetration of DG in the distribution increased the fault current in the system. Author [15] also worked on the DG imposed technical barriers for effective and efficient operation on distribution network with fast reclosure, his result revealed that fault current increased with the capacity and penetration level of the DG connected to the distribution network. Authors in [16] also investigated the relay protection coordination in the presence of high penetration of DG with the distribution system, and he concluded that the penetration of DG affects the protection of the existing distribution network which required resetting of the protection relays. Authors in reference [17] worked on reducing the fault current and improving the quality of power system reliability with Solid State Fault Limiter (SSFL) to replace substation equipment he concluded that the protection system of DG with SSFL is preferable to compare to without SSFL. Author in reference [18] analyzed the relay coordination challenges in the presence of DG with different types of DGs and its capacity using Fault Current Limiter FCL series reactance, and he concluded that the fault current on synchronous generators (SG) is more pronounced compared with other DG such as doubly-fed Induction Generator (DFIG). He stated that the protection relay coordination’s integrity could be more preserved using series reactance fault current limiter.
In this research work, the load flow analysis of the test distribution network is first analyzed using Neplan software to confirm the distribution network’s healthiness before and after the integration of DG. This is because an unhealthy distribution network will be much more affected negatively with DG integration. Many of the authors above failed to do this. Also, a real distribution network is used for this investigation and not test distribution network. The DG penetration level into the distribution network is analyzed and with the relay tripping time. The maximum DG penetration level in each bus that will not give rise to protection miscoordination is analyzed.
3. Materials and Methods
The distribution system is modelled using Neplan software. The grid components parameters are collected from Eko Electricity Distribution Company which include the transmission line, number of buses, transformers and load information. The essence of load flow study is to investigate the voltage profile on each bus, the real and reactive power load loss in the network. The load flow analysis was designed to assess the steady-state performance of the distribution network under no-fault conditions. The load flow analysis was carried out on the distribution network with or without distributed generation connected to it. The distribution network was modelled for protection relay coordination with Neplan software. Simulation of the entire distribution system was done to investigate the effect of the penetration level of DG on distribution system protection. The single line diagram of the modelled distribution network is as shown in Figure 1.
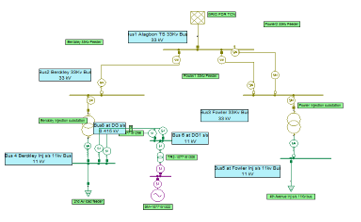 Figure 1: Single line diagram of the modelled distribution network
3.1. Description of Berkeley and Fowler Injection substations is used as the test distribution network
From the single line diagram of the test distribution network in Figure 1, the distribution network is being fed from Transmission Company of Nigeria (TCN) grid. The real power and reactive power are 17.362MW and 0.308MVar connected to 33kV bus1, three 33kV lines radiated from TCN are Berkeley, 33kV single line and Fowler 1&2, 33kV line double circuit with 3km and 5km respectively. Festac1, 33Kv line feeds Berkeley Injection substation via 33kV bus2, the primary of 15MVA power transformer is connected to bus2 while the secondary side is connected to 11kV load bus4 with 8.3MW load. The units of hybrid generators (wind plus diesel) turbine DGs with the rating of 22MW is connected to bus4 by 11kV double line circuit via bus6 with a power transformer and 0.415kV bus8. Fowler 1&2, 33kV line double circuit feeds Fowler 15MVA Injection substation via 33kV bus3, the primary side of the power transformer is connected to bus3 while the secondary side is connected to 11kV load bus5 with 9MW load. Interconnector line is connected to the bus2 and bus3 for flexibility of the network. The line impedance of the distribution network used for this research is R = 0.101 and X = j0.077, data collected from the utility company. From this, it can be seen that R/X Ratio is 1.311688, which is high compare to the transmission network, which is always less than 1. Also the conventional load flow analysis will not converge for the distribution network because of the high R/X Ratio [19]. Hence NEPLAN software is used to carry out the load flow analysis of this study.
3.2. Results of Load-flow on the test distribution network
The result of power loss with and without DG attached to 11Kv bus in Berkeley injection substation is shown in Table 1 while Table2shows the voltage profile of the system with and without DG connected to the distribution network. Figure 2 gives the graphical representation of voltage profile with and without DG.
Table 1: Result of power loss without and with DG
| S/N | Substation Load (MW) | Active Power load loss (Mw) | Reactive Power load loss (Mvar) | Status |
| 1 | 8.3 | 0.123 | 1.111 | without DG |
| 2 | 8.3 | 0.009 | 0.007 | with DG |
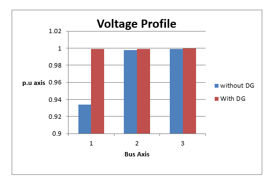 Figure 2: graphical representation of the voltage profile of with or without DG
Table 2: The voltage profile of the system with and without DG
| S/N | BUS | Nominal voltage (Kv) | Bus voltage (Kv) | Per Unit (p.u) | Status |
| 1 | 4 | 11 | 10.269 | 0.934 | without DG |
| 2 | 2 | 33 | 32.922 | 0.998 | |
| 3 | 7 | 33 | 32.999 | 0.999 | |
| 4 | 4 | 11 | 10.986 | 0.999 | with DG |
| 5 | 6 | 11 | 10.988 | 0.999 | |
| 6 | 8 | 0.415 | 0.415 | 1 |
4. DG Penetration at Berkeley (buses 4,6&8) Injection Substations
The effect of distributed generation can be analyzed by connecting the generators to the load buses one after the other and confirming their simultaneous effect on the system [20]. Traditionally the power flow in the distribution system is unidirectional without distributed generation, but the integration of Distributed Generation makes the energy flow bi-directional, causing loss of relay coordination in the systems. The technical challenges between DG and protection schemes are the increase in short circuit fault currents, lack of relay coordination in the protection system, failure to the closure of line after the occurrence of a fault in the networks, effect of islanding and untimely tripping of DG interface on the protection systems of the distribution systems.
The impact of penetration level of the DG on the distribution network cause protection miscoordination which can be analyzed as follows, the Distributed Generation Penetration Factor (DPF) and is plotted against the Protection Mis-coordination Index (PMI) [21].
5. Results and Discussion
5.1. Simulation by Penetration of DG at bus 4 of Berkeley Injection Substation
Figures 3 and 4 show the single line diagram of three-phase fault simulated without and with DGs connected respectively. The penetration level of DGs into the test distribution network is done by simulation of three-phase fault using Neplan software to confirm the level at which the penetration of DGs affects the distribution network’s protection system. Table 3 shows the simulation result of fault current and time of tripping without DGs connected. Also, it can be observed from the result of the simulation in Table 4 that as the capacity of the penetration level of DGs increases, the fault current likewise increases while the tripping time of the relay protection decreases. This is to confirm that the integration of DG into the distribution network causes an increase of the fault current in the distribution network, compare with what is seen in Table 3 when DG is not connected.
Table 3: The simulation result of fault current and time of tripping without DGs connected
| Bus | Fault Current (IKA) | Time (s) |
| 1 | 0.962 | 1.66 |
| 2 | 0.962 | 0.259 |
| 4 | 2.887 | 0.129 |
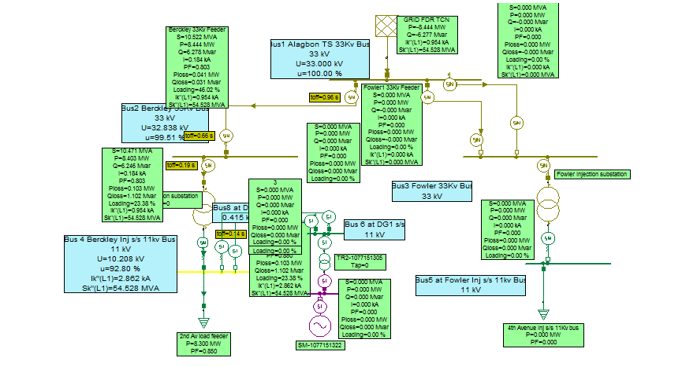 Figure 3: Single line diagram of the test distribution network simulated without DGs connected
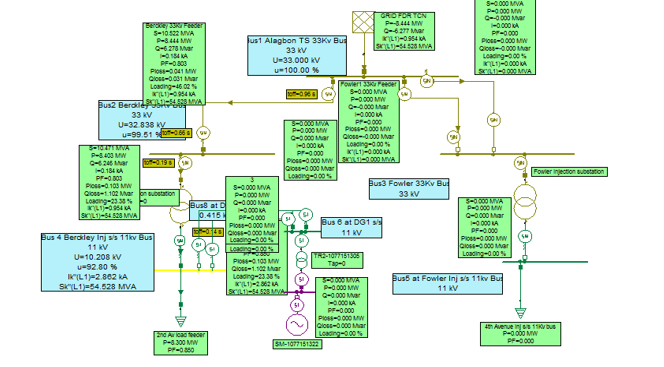 Figure 4: single line diagram of three-phase fault simulated with DGs connected
Table 4: The simulation result of the DG penetration level, fault current (kA), and protection miscoordination time (PMT)
| DG Penetration (MW) | Fault Current (KA) | PM Time (s) | Remarks |
| 0.255 | 3.323 | 3.269 | Miscoordination of relay, blinding and false tripping |
| 0.425 | 5.378 | 1.194 | |
| 0.595 | 7.227 | 6.984 | |
| 0.765 | 8.839 | 32.572 | |
| 0.935 | 10.214 | 6.798 | |
| 1.105 | 11.369 | 4.288 | |
| 1.275 | 12.331 | 3.296 | |
| 1.445 | 13.129 | 2.85 | |
| 1.615 | 13.791 | 2.542 | |
| 1.785 | 14.342 | 2.353 | |
| 1.955 | 14.801 | 2.229 | |
| 2.125 | 15.187 | 2.132 | |
| 2.295 | 15.512 | 2.056 | |
| 2.465 | 15.788 | 1.994 | |
| 2.635 | 16.023 | 1.944 | Blinding and false tripping |
| 2.805 | 16.226 | 1.891 | |
| 2.975 | 16.4 | 1.891 | |
| 3.145 | 16.551 | 1.849 | |
| 3.315 | 16.683 | 1.829 | |
| 3.485 | 16.799 | 1.812 | |
| 3.655 | 16.901 | 1.797 | |
| 3.825 | 16.992 | 1.784 | |
| 3.995 | 17.072 | 1.772 | |
| 4.165 | 17.143 | 1.762 | |
| 4.335 | 17.207 | 1.753 | |
| 4.505 | 17.265 | 1.745 | |
| 4.675 | 17.317 | 1.738 | |
| 4.845 | 17.364 | 1.731 | |
| 5.015 | 17.406 | 1.726 | |
| 5.185 | 17.445 | 1.72 | |
| 5.355 | 17.48 | 1.716 | |
| 5.525 | 17.512 | 1.711 | |
| 5.695 | 17.542 | 1.707 | |
| 5.865 | 17.569 | 1.704 | |
| 6.035 | 17.594 | 1.7 | |
| 6.205 | 17.617 | 1.697 | |
| 6.375 | 17.639 | 1.695 | |
| 6.545 | 17.659 | 1.692 | |
| 6.715 | 17.677 | 1.69 | |
| 6.885 | 17.694 | 1.687 | |
| 7.055 | 17.71 | 1.685 | |
| 7.225 | 17.725 | 1.683 | |
| 7.395 | 17.739 | 1.681 | |
| 7.565 | 17.752 | 1.68 | |
| 7.735 | 17.764 | 1.678 | |
| 7.905 | 17.775 | 1.677 | |
| 8.075 | 17.786 | 1.675 | |
| 8.245 | 17.796 | 1.674 | |
| 8.415 | 17.806 | 1.673 | |
| 8.585 | 17.8141 | 1.672 | |
| 8.755 | 17.823 | 1.671 | |
| 8.925 | 17.831 | 1.67 | |
| 9.095 | 17.838 | 1.669 | |
| 9.265 | 17.846 | 1.668 | |
| 9.435 | 17.852 | 1.667 | |
| 9.605 | 17.859 | 1.666 | |
| 9.775 | 17.865 | 1.665 | Blinding and false tripping |
| 9.945 | 17.871 | 1.664 | |
| 10.115 | 17.876 | 1.664 | |
| 10.285 | 17.881 | 1.663 |
Figure 5 shows the plotting of DG penetration (MW) against the protection miscoordination time (PMT) and corresponding fault current (kA) of the integration of DG into the test distribution network.
The DG penetration level cause protection first miscoordination to beginning at 0.595MW and 0.765MW, the second miscoordination occur at 2.805MW, and 2.975MW and third miscoordination occur at 9.945MW and 10.115MW on 11kV line with system load of 8.3MW, therefore, false tripping, nuisance tripping and blinding of protection occur when the penetration of DGs get to the point of fault at the external of the protection zone, that is when the DGs penetration level increases fault current beyond the protection relay setting as seen in Table 4.
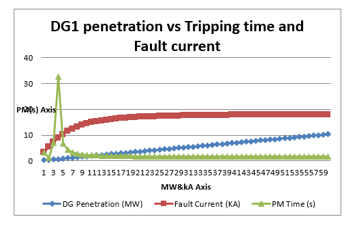 Figure 5: Graphical representation of DG penetration
Recalling equations 1&2
The first miscoordination,
and
The second miscoordination,
and
,
The third miscoordination,
and
Then,
DPF = (0.595)/(8.3) = 7.1%
and
DPF = (0.765)/(8.3) = 9.2%
The second miscoordination,
DPF = (2.805)/(8.3) = 33.8%
and
DPF = (2.975)/(8.3) = 35.8% ,
The third miscoordination,
DPF = (9.945)/(8.3) = 119.8% and
DPF = (10.115)/(8.3) = 121.8%
Then, PMI = 6/1 = 6
The calculation shows that the first blinding of protection of the system beginning at the penetration level of 7.1% and 9.2% of DG, and the second false tripping of the protection start when the penetration of the DG gets to 33.8% and 35.8% while the third false tripping protection begins at maximum penetration of DG at 119.8% and 121.8% with the system load of 8.3MW and this is the best penetration level because the DG is able to accommodate the system load of the injection substation without any further tripping after rest the protection relay..
Also, PMI shows the time of occurrence of miscoordination which is 6 times, that is, the protection miscoordination time at first miscoordination is 6.984s and 32.572s, the second miscoordination is 1.891s twice, and the third miscoordination is 1.664s twice as seen in Table 4.
From Table 1, the result of load flow analysis on the test distribution network using Neplan software shows that the active power load loss without DGs is 0.123MW compare with 0.009MW when DGs is connected to the system. It can be established that the active power load loss is very high without DGs connected to the system compared to when it is connected. This shows that the DGs connected to the distribution network improves the active and reactive power, as seen in Table 1.
From Table 2, the result of the load flow analysis shows that the voltage profiles at buses 4, 2 and 7 are 0.934p.u, 0.998p.u and 0.999p.u without DGs connected are compared with voltage profiles at buses 4, 6 and 8 are 0.999p.u, 0.999p.u and 1p.u when DGs connected to the system. The result confirmed that the voltage at each bus improved when DGs connected to the test distribution system. From the load flow analysis results, it can be concluded that the test distribution network is healthy enough to accommodate DGs.
From Table 4, as the penetration of DGs increases from 0.595MW to 0.765MW and from 0.935MW to 1.105MW, the fault currents increase likewise from 7.227KA to 8.839KA and from 10.214KA to 11.369KA respectively at first miscoordination, however the time to which the circuit breaker opens the fault fluctuates from 6.984s to 32.572s and from 6.789s to 4.288s respectively. This is abnormal because the time at which the breaker isolates the fault should not under any condition rise from 6.984s to 32.572s and later decrease to 6.789s, so this calls for protection resetting to prevent the blinding, false, and nuisance tripping that has already occurred.
The second miscoordination occurred as the penetration level is increased from 2.805MW to 2.875MW, thereby causing the fault current also to increase from 16.226KA to 16.4KA. However, the time to which the breaker isolates the fault is constant at 1.891s. This is also abnormal because the time at which the breaker opens the fault should be less than 1.891s. So, this calls for relay resetting to prevent the blinding that has already occurred.
The third miscoordination occurred as the penetration level is increased from 9.945MW to 10.115MW, thereby causing the fault current also to increase from 17.871KA to 17.876KA. Moreover, the time to which the breaker opens the fault is constant at 1.664s. This is abnormal because the time at which the breaker isolates the fault should be less than 1.664s. So this calls for relay resetting to prevent the blinding that has already occurred.
The simulation result confirms that the integration of DGs into the existing test distribution network as shown in Tables 4 causes an increase in the fault current which in turn caused false tripping, nuisance tripping and blinding of protection relay compare with when DGs not connected as shown in Table 3. At this point, the settings of the protection relay at the point of common coupling (PCC) of DGs to the test distribution network is important to prevent false tripping, nuisance tripping and blinding of the protection relay because of the flow of electricity that change from unidirectional to bi-directional flow.
6. Conclusion
A single line diagram was developed for the test network, and the impact of Distributed Generation (DG) on power system protection was also investigated in this study. It can be concluded that as the capacity of the penetration level of DGs increases, the fault current likewise increases while the tripping time of the relay protection decreases. This confirms that the integration of DG into the distribution network causes an increase in the fault current in the distribution network which in turn will affect the protection setting. For instance, integration of DGs at 11kV line, in this work, causes the miscoordination of protection relay to occur first at the penetration level of 7.1% and 9.2%, second at 33.8% and 35.8%. At the same time, the third false tripping protection begins at the maximum penetration level of the DGs at 119.8% and 121.8%. Blinding, false and nuisance tripping happened at 32.572s, 1.891s and 1.664s respectively. The protection relays at the point of common coupling within the test distribution network were reconfigured to prevent such occurrence again. This was done by calculating the following: Relay current at fault location, Plug setting multiplier, Pick-up current and the Operating time.
Conflict of Interest
The authors declare no conflict of interest.
Acknowledgment
This research work and publication charge is fully funded by Covenant University Centre for Research, Innovation and Discovery (CUCRID).
- T.S. Shomefun, A. Ademola, C.O.A. Awosope, A.I. Adekitan, “Critical review of different methods for siting and sizing distributed-generators,” Telkomnika (Telecommunication Computing Electronics and Control), 16(5), 2018, doi:10.12928/TELKOMNIKA.v16i5.9693.
- T.E. Somefun, C.O.A. Awosope, A. Abdulkareem, A.S. Alayande, “Deployment of power network structural topology to optimally position distributed generator within distribution system,” Journal of Engineering Science and Technology Review, 2020, doi:10.25103/jestr.131.2.
- J.A. Martinez, J. Martin-Arnedo, “Impact of distributed generation on distribution protection and power quality,” in 2009 IEEE Power and Energy Society General Meeting, PES ’09, IEEE: 1–6, 2009, doi:10.1109/PES.2009.5275777.
- O. Babayomi, T. Shomefun, Z. Zhang, “Energy Efficiency of Sustainable Renewable Microgrids for Off-Grid Electrification,” in 2020 IEEE PES/IAS PowerAfrica, PowerAfrica 2020, 2020, doi:10.1109/PowerAfrica49420.2020.9219958.
- S.A.M. Javadian, M. Massaeli, “Impact of distributed generation on distribution system’s reliability considering recloser-fuse miscoordination-A practical case study,” Indian Journal of Science and Technology, 4(10), 1279–1284, 2011, doi:10.17485/ijst/2011/v4i10/30172.
- F. Agbetuyi Ayoade, A. Ademola, H.E. Orovwode, K. Oladipupo Oluwafemi, M. Simeon, A. Agbetuyi Oluranti, “Power quality considerations for embedded generation integration in Nigeria: A case study of ogba 33 kV injection substation,” International Journal of Electrical and Computer Engineering, 11(2), 956–965, 2021, doi:10.11591/ijece.v11i2.pp956-965.
- P.P. Barker, R.W. De Mello, “Determining the impact of distributed generation on power systems: Part 1 – Radial distribution systems,” in Proceedings of the IEEE Power Engineering Society Transmission and Distribution Conference, IEEE: 1645–1656, 2000, doi:10.1109/pess.2000.868775.
- T.E. McDermott, R.C. Dugan, “Distributed generation impact on reliability and power quality indices,” in Rural Electric Power Conference, 2002. 2002 IEEE, IEEE: D3-1, 2002.
- S. Conti, “Analysis of distribution network protection issues in presence of dispersed generation,” Electric Power Systems Research, 79(1), 49–56, 2009, doi:10.1016/j.epsr.2008.05.002.
- A. Girgis, S. Brahma, “Effect of distributed generation on protective device coordination in distribution system,” in LESCOPE 2001 – 2001 Large Engineering Systems Conference on Power Engineering: Powering Beyond 2001, Conference Proceedings, IEEE: 115–119, 2001, doi:10.1109/LESCPE.2001.941636.
- E. Sortomme, G.J. Mapes, B.A. Foster, S.S. Venkata, “Fault analysis and protection of a microgrid,” in 40th North American Power Symposium, NAPS2008, IEEE: 1–6, 2008, doi:10.1109/NAPS.2008.5307360.
- G. Kaur, Y. Mohammad Vaziri, “Effects of Distributed Generation (DG) interconnections on protection of distribution feeders,” in 2006 IEEE Power Engineering Society General Meeting, PES, IEEE: 8 pp., 2006, doi:10.1109/pes.2006.1709551.
- E. Coster, J. Myrzik, W. Kling, “Effect of Distributed Generation on Protection of Medium Voltage Cable Grids,” in Proc. CIRED 19th Int. Conf. Electricity Distrib, 21–24, 2007.
- B. Hussain, S.M. Sharkh, S. Hussain, “Impact studies of distributed generation on power quality and protection setup of an existing distribution network,” in SPEEDAM 2010 – International Symposium on Power Electronics, Electrical Drives, Automation and Motion, IEEE: 1243–1246, 2010, doi:10.1109/SPEEDAM.2010.5545061.
- H. Zayandehroodi, A. Mohamed, H. Shareef, M. Mohammadjafari, “Impact of distributed generations on power system protection performance,” International Journal of Physical Sciences, 6(16), 3873–3881, 2011, doi:10.5897/IJPS11.674.
- S. Rahman, Impact of Distributed Generation on Power System Protection PV-STATCOM View project Traction power analysis View project, 2010.
- R. Elavarasi, P. Saravanan, Impact of Distributed Generation on Distribution Systems and its Protection, 2014.
- M. Khederzadeh, H. Javadi, S.M.A. Mousavi, “Source type impact of Distributed Generation (DG) on the distribution protection,” IET Conference Publications, 2010(558 CP), 2010, doi:10.1049/cp.2010.0299.
- T.E. Somefun, O. Babayomi, C.O.A. Awosope, A. Abdulkareem, C.T. Somefun, “Software for Improved Online Teaching of Power System Analysis for Undergraduates,” in 2020 IEEE PES/IAS PowerAfrica, PowerAfrica 2020, 2020, doi:10.1109/PowerAfrica49420.2020.9219910.
- J. Mutale, G. Strbac, S. Curcic, N. Jenkins, “Allocation of losses in distribution systems with embedded generation,” IEE Proceedings: Generation, Transmission and Distribution, 147(1), 7–14, 2000, doi:10.1049/ip-gtd:20000003.
- T.M. Masaud, R.D. Mistry, “Fault current contribution of Renewable Distributed Generation: An overview and key issues,” in 2016 IEEE Conference on Technologies for Sustainability, SusTech 2016, IEEE: 229–234, 2017, doi:10.1109/SusTech.2016.7897172.