
Factors Affecting Behavioural Intention to Shop in Self-Service Retail Case Study: JD.ID X Mart
Volume 6, Issue 2, Page No 285-294, 2021
Author’s Name: Tuga Mauritsius, Annisa Safira Brazaa)
View Affiliations
BINUS Graduate Program-Master of Information Systems Management, Information Systems Management Department, Bina Nusantara University, Jakarta, 15530, Indonesia
a)Author to whom correspondence should be addressed. E-mail: safirabraza@yahoo.com
Adv. Sci. Technol. Eng. Syst. J. 6(2), 285-294 (2021); ![]() DOI: 10.25046/aj060233
DOI: 10.25046/aj060233
Keywords: Just Walk Out Technology, Smart Shopping, JD.ID X Mart, Self Service Retail

Export Citations
This paper aims to measure the acceptance level of Indonesian customers to JD.ID X retail and to reveal the driving factors of behavioral intention to shop at the retail. JD.ID X is new retail that implements a new shopping technology called Just walk-out technology (JWOT) also known as retail without a cashier. JWOT is one of the latest innovations in the retail business that draws the authors intention as with this technology the shopping experiences becomes more efficient, effective, and enjoyable. We, therefore, examine some constructs related to this characteristic which are then classified as utilitarian and hedonic motivation. The method used in collecting data for this research is by distributing questionnaires through the Google form. Data is analyzed using Smart PLS 3.2.9. The results of this study indicate that there is a significant direct effect between automation, security/privacy risk, hedonic motivations on behavioral intention to shop at JD.ID X Mart. On the other hand, trust and utilitarian motivations do not have a significant direct effect on the dependent variable. Another finding is that, whilst trust does not mediate automation to the dependent variable, hedonic motivation shows a significant intermediating role between automation and the behavioral intention to use.
Received: 20 July 2020, Accepted: 07 December 2020, Published Online: 17 March 2021
1. Introduction
1.1. The development of the retail industry in Indonesia
Retail is an important chain in the process of distribution of goods and is a chain in a distribution process. Through retail, a product can meet directly with its consumers. Based on data from the Indonesian Retail Entrepreneurs Association (Aprindo), the value of modern retail sales in 2016, 2017, and 2018 reached Rp205 trillion, Rp212 trillion, and Rp233 trillion, respectively. Whereas in 2019 modern retail sales are estimated to reach Rp256 trillion or grow by around 10% from last year’s realization [1].
The modern market is the main driver of the development of modern retail in Indonesia. In 2004 – 2008, Modern Market turnover grew by 19.8%, the highest compared to other modern retail formats. Turnover of Department Stores, Specialty Stores, and other modern retail formats increased by only 5.2%, 8.1%, and 10.0% per year [2].
Progress in the economy has contributed to the development of modern markets and retail businesses in Indonesia. The growth of the middle class in the country encourages increased investment interest and a passion for shopping. The World Bank states the number of middle-class populations in Indonesia in 2010 amounted to 56.5% of the total population. This figure has increased sharply compared to 1999 data when the number of middle class in Indonesia was estimated at 25% of the total population [3].
The retail network in Indonesia is currently growing, especially with the existence of modern retails. As a consequence, the rivalry between the retailers is also growing. Retailers do not want to just stand idly as a place to sell goods from other manufacturers. Many retailers are enthusiastic about creating innovations in shopping at their retail. One of them is a breakthrough in the retail industry which is retail without a cashier which is also known as Just walk out technology (JWOT). This technology combines the power of artificial intelligence (specifically machine learning in computer vision) that can track what items are taken on the shelf.
This shopping technology makes everyone shop calmly, without having to queue long at the cashier. Because all transactions are done automatically. Amazon Go in the United States is one of the retail of this kind. In Indonesia, in the year 2019, JD.ID X Mart a retail chain under PT. The National Joint Retail group was launched implementing the technology and business process similar to Amazon Go.
This research aims to examine costumer’s acceptance of the technology and retail in Indonesian context. The authors conducted a preliminary survey by interviewing several visitors at the JD.ID X Mart store. From this preliminary study, it was revealed that two main factors responsible for the people willing to use these services, namely IT and non-IT factors. The IT factor includes the implementation of the latest technology in Artificial Intelligence techniques such as face recognition and RFID technology that result in customers feel more effective and efficient shopping. As for the non-IT factor, the customer feels comfortable shopping at JD.ID X Mart because the price offered is also relatively cheaper than other retail stores, the location of JD.ID X Mart is in a shopping center that is easy to access from any part of Jakarta.
1.2. JD.ID and JD.ID X Mart
JD.ID is an e-commerce owned by a company PT. National Joint Retail and operates in Jakarta, Indonesia. JD.ID develops the mission of “make the joy happen”, which is to bring happiness to all customers in Indonesia by providing reliable, fast, and safe services to choose a range of original quality products at competitive prices.
JD.ID’s business is growing very rapidly. The number of products offered grew rapidly from less than 10,000 SKUs in 2015 to around 100,000 SKUs at the end of 2016. JD.ID also provides shipping services that reach 365 cities throughout Indonesia with thousands of fleets ready to deliver directly to JD.ID customers. According to iPrice’s report, JD.ID is ranked 6th out of the top 10 e-commerce sites in Indonesia [4].
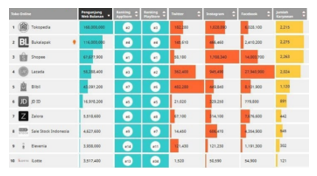 Figure 1: Largest E-Commerce in Indonesia During Q4 2018 (Source: iPrice)
Seeing the rapid development of e-commerce on Figure 1, this makes e-commerce always create innovations for the benefit of the community. That is what e-commerce JD.ID does. E-commerce JD.ID announced that it has presented a retail shop technology operating without cashier in Indonesia called JD.ID X Mart. As the most sophisticated retail store in Indonesia, JD.ID X Mart comes by offering a futuristic shopping concept with the support of artificial intelligence (AI). In this shop, consumers can experience shopping by utilizing various advanced technologies such as face scanners, radio-frequency identification (RFID), and non-cash payment methods. The products offered are available exclusively at JD.ID X also comes with special prices and consists of various popular products, including the fashion category for men and women, cosmetics, accessories and beauty, non-electronic household products, and daily needs. Here is the process to shop at JD.ID X Mart as can be seen on figure 2:
 Figure 2: The processes of JD.ID X Mart
2. Literature Review
2.1. Just Walk Out Technology
Just walk out technology is an expression of smart shopping technology where the technology can automatically detect when a product is taken off the shelf and when the product is returned to the rack and can track the product in a virtual cart. When we have made the payment, we can just leave the store. This self-checkout shopping technology offers various kinds of expertise in shopping and makes shopping more effective and efficient.
The biggest reason for customers to use self-checkout machines themselves is because of the ease of payment and payments become more effective and efficient. Some people don’t want to interact with cashiers and prefer to scan their items. In short, this technology has been attractive to the community.
With the development of technology, retailers are always developing innovation to create a new technology to make it easier for people to shop. One of them is just to walk out of technology innovation. There are many technological functions of this just walk out technology such as:
- Sensor Fusion
The fusion sensor is a method of combining two different types of sensors that have almost the same characteristics to get a new function. One function of sensor fusion is to get a comparison between two combined.sensors.
- Deep Learning
Deep learning is another type of Machine Learning, it is inspired by the function of our brain cells called neurons that lead to the concept of artificial neural networks (ANN). Just walk out technology is one example of deep learning. Other examples of the application of deep learning are face recognition, human speech recognition and translation (google translate by voice), driver assistance.
- RFID Tag
RFID or can also be called Radio Frequency Identification is a wireless-based identification machine that allows data retrieval without having to touch such as a barcode or magnetic card. This tool uses an electromagnetic radiation engine to transmit codes.
- Computer Vision
Computer Vision is how a computer/machine can see. Computer vision is a field that includes methods for obtaining, processing, analyzing, and understanding visual data such as images and videos. The main purpose of Computer Vision is that the computer or machine can mimic the perceptual abilities of the human eye and brain, or even be able to outperform it for certain purposes
2.2. Related Works
This research was conducted at retail stores that have a shopping process similar to Amazon Go. The author in [5] conducted a research to identify the main features of the stores, and interview to some Amazon Go users and staffs to reveal the factors that motivate someone to use the channel. The shopping experience is designed for those who don’t like it standing in the payment line. Profits go to Amazon by eliminating check out personnel. Advanced technology tracks their purchases, allows them to leave the store without a physical check-out, and automatically withdraws a certain amount of money from pre-registered accounts. This paper also reports on the results of the author’s interviews with several visitors. One relevant finding is that nearly all respondents agree that the automatization implemented by Amazon go brings many benefits and convenience to their shopping experience.
The researcher in [6] attempts to find hedonic and utilitarian motivational indicators that can influence UK wholesale consumers to adopt and use proposed new features of mobile applications in stores. The results of the study support that utilitarian motivation to shop for groceries includes time convenience, performance expectations and information availability. For hedonic motivation, the attributes supported include idea motivation, personalization, value motivation and experiential shopping.
The author explore the same problem, namely understanding the factors that encourage buyers to shop at a JWOT retail in Thailand similar to [7]. From this study, it is found that the original constructs derived from the TAM model significantly influence the desire to shop at the retail. Researchers also found that perceived entertainment value, trust, and technology anxiety do not have a significant role in the decision to use the JWOT.
Utilitarian and hedonics motivation in shopping has also been examined by [6]. In their paper the authors emphasized the utilitarian elements of efficiency, personalized services and convenient operation process were shown to be the dominant factors.
The effect of smart technology to customer dynamics and customer experience has been also be investigated by [8]. Their findings show that the commitment to learn plays a critical role to explain the behavioral intention, customer participation, customer dynamics and customer experience.
The researcher in [9] employed an extended IS success model to investigate the failure of self-service technology implementation. The author found that the individual technology anxiety and the need for the personal interaction became major factors affecting the technology acceptance.
3. Methodology
3.1. Research Model
In this study we used a combination model taken from the paper “User acceptance of smart home services: An extension of the theory of planned behavior” on figure 3 and “An In-Store Mobile App for Customer Engagement: Discovering Hedonic and Utilitarian Motivations on figure 4
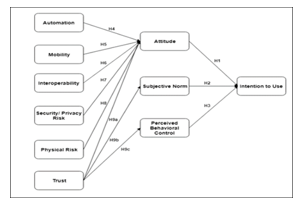 Figure 3: Paper research model “User acceptance of smart home services: An extension of the theory of planned behavior”
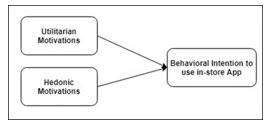 Figure 4: Paper research model “An In-Store Mobile App for Customer Engagement: Discovering Hedonic and Utilitarian Motivations”.
The reason for combining the two models of the paper is because according to the results of the initial interview with the user/consumer of JD.ID X Mart is that the user/consumer wants to shop at JD.ID X Mart due to IT factors and non-IT factors. Examples of IT Factors are from the Artificial Intelligence technology side and the security system application. While examples for non-IT factors are users/consumers feeling happy shopping at JD.ID X Mart, feeling shopping at JD.ID X Mart can save more time. Therefore we adopt the model of the two paper models. After looking at each of the variables in the two models, some indicators do not match the model obtained from these two papers. For the Mobility, Interoperability, and Physical Risk variables, we don’t use these variables because these variables are not by this study. The definition of Mobility and Interoperability is a system/application that can be done anywhere and can be remote anywhere. Humans have control/control of the system. Whereas in this research, the JD.ID X application can only be accessed and controlled when entering the JD.ID X Mart store and the customer has no control over the application. For Physical Risk this means that the possibility of smart home users can endanger themselves or others. This is not following this study because shopping at JD.ID X Mart is not dangerous because the customer only interacts with JD.ID X system and application. Therefore, the writer re-modifies the model for the removal of several indicators so that it becomes a model like the picture below:
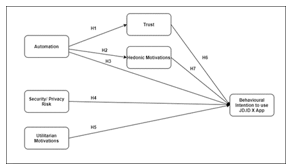 Figure 5: Research Model
As seen on figure 5, the hypotheses in this study include:
H1: Variation Automation has a significant effect on the variable Trust in shopping at JD.ID X Mart.
H2: Variable Automation has a significant effect on the Hedonic Motivations variable in shopping at JD.ID X Mart.
H3: Variable Automation has a significant effect on Behavioral Intention to use JD.ID X App in shopping at JD.ID X Mart.
H4: The Security / Privacy Risk variable has a significant influence on the Behavioral Intention to use JD.ID X App variable in shopping at JD.ID X Mart.
H5: Utilitarian Motivations Variable has a significant influence on the Behavioral Intention to use JD.ID X App variable in shopping at JD.ID X Mart.
H6: Trust variable has a significant influence on Behavioral Intention to use JD.ID X App in shopping at JD.ID X Mart.
H7: The Hedonic Motivations variable has a significant effect on the Behavioral Intention to use JD.ID X App variable in shopping at JD.ID X Mart.
H8: Trust variables have a significant mediating role between the Automation variables and the Behavioral Intention to use JD.ID X App.
H9: Hedonic Motivations has a significant mediating role between the Automation variables on Behavioral Intention to use JD.ID X App.
H10: Trust and Hedonic Motivations together have a significant mediating role between the Automation variable on Behavioral Intention to use JD.ID X App.
The questionnaire was made using a Likert scale with interval types. This Likert scale relates to statements about someone’s attitude towards something, such as agreeing or disagreeing, happy or not happy, and good or not good. On a Likert scale, each item scale has five categories, namely “strongly disagree” to “strongly agree”. To run the analysis, each statement is given a numerical score, ranging from 1 to 5, as follows:
1 = Strongly disagree
2 = disagree
3 = Quite Agree
4 = Agree
5 = Strongly Agree
To determine the number of samples in the study, the authors used the Slovin formula. From the calculation of the Slovin formula above it can be concluded that the minimum number of samples in this study is a total of 400 samples.
This paper running data in 2 ways, namely the outer model and the inner model. Outer models are done by testing convergent validity, discriminant validity, and reliability testing. Convergent validity tests can be seen with the outer loading value and AVE (Average Variance Extracted). Discriminant validity test can be assessed by cross-loading. While the reliability test can be assessed with the Cronbach’s alpha value. The inner model is done by testing R2 and Path Coefficient.
3.2. Operational Variable (Question of questionnaire)
Here are the questions to collect the data to conduct this study:
Table 1: Question of questionnaire
| No | Construct | Item No. | Indicator |
| 1 | Automation (ATM) | ATM1 | I feel comfortable shopping at JD.ID X Mart because the technology services provided allow me to actively shop without human intervention. |
| ATM2 | Using artificial intelligence technology at JD.ID X Mart makes shopping less complicated. | ||
| ATM3 | The Artificial Intelligence technology at JD.ID X Mart makes shopping even more time-saving. | ||
| 2 | Security/ Privacy risk (SPR) | SPR1 | I don’t feel worried about shopping at JD.ID X Mart by using the JD.ID X application because of its strong security system. |
| SPR2 | I do not feel any personal data leak when shopping using JD.ID X. | ||
| SPR3 | I feel that internet hackers (hackers) cannot control my payment account data when shopping using the JD.IDX application. | ||
| 3 | Trust (TRS) | TRS1 | I feel that JD.ID X Mart’s AI technology services are reliable. |
| TRS2 | I feel confident when using JD.ID X Mart’s AI technology services. | ||
| TRS3 | I feel JD.ID X Mart’s AI technology services can meet my expectations in shopping. | ||
| TRS4 | I believe the products and services offered by JD.ID X Mart are of high quality | ||
| 4 | Utilitarian Motivations (UMT) | UMT1 | Using the JD.ID X application when shopping in a store makes shopping activities less time-consuming. |
| UMT2 | Using the JD.ID X application makes me shop according to my shopping preferences. | ||
| UMT3 | Using the JD.ID X application when shopping at JD.ID X Mart allows me to access relevant product information. | ||
| UMT4 | Shopping at JD.ID XMart makes the shopping process complete faster. | ||
| 5 | Hedonic Motivations (HMT) | HMT1 | Shopping at JD.ID X Mart is an adventure for me. |
| HMT2 | I enjoy shopping at JD.ID X Mart using the JD.ID X application. | ||
| HMT3 | I feel happy when I manage to shop at JD.ID X Mart | ||
| HMT 4 | I feel proud to be able to shop at JD.ID X Mart | ||
| 6 | Behavioural Intention (BIT) | BIT1 | I find it useful to shop at JD.ID X Mart. |
| BIT2 | I’m planning to shop at JD.ID X Mart in the near future | ||
| BIT3 | I predict that I will be shopping at JD.ID X Mart in the coming month. | ||
| BIT4 | I intend to do some shopping at JD.ID X Mart in the months to come. | ||
| BIT5 | I will recommend to my friends to shop at JD.ID X Mart |
4. Result and Discussion
4.1. Respondent Profile
In this part of the respondent’s profile, the author will display respondents in terms of demographics based on gender, age range, type of work, intensity of respondents shopping at JD.ID X Mart and from where respondents received information on the store JD.ID X Mart.
- Profile of Respondents by Gender
Based on the results of the questionnaire collection on figure 6, it can be seen that the highest number of respondents is female gender as many as 203 respondents (55%), while respondents with male gender are 169 respondents (45%).
 Figure 6: Respondents by Gender
- Profile of Respondents Based on Age Range
Based on the collection of questionnaire results on figure 7, it can be known that based on age range, the highest number of respondents is 21-29 years old with 156 respondents (42%). While respondents with an age range of 30 – 39 years were 84 respondents (23%), an age range of 18-20 years were 73 respondents (20%), an age range of 40 – 49 years were 47 respondents (12%), age range 50 – 59 years as many as 12 respondents (3%) and no respondents from the age range of more than 60 years.
 Figure 7: Age Range
- Profile of Respondents by Type of Employment
Based on the collection of questionnaire results on figure 8, it can be known that based on the type of work, the largest number of respondents is the type of work of private employees, which is 160 respondents (43%). While respondents with the type of work as students were 148 respondents (40%), the type of work as a civil servant were 30 respondents (8%), 18 respondents (5%) did not work and 5 types of jobs as traders were traders (4%).
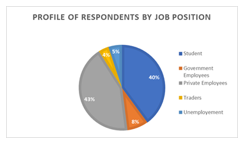 Figure 8: Type of Employment
- Shopping intensity at JD.ID X Mart
Based on the results of the questionnaire collection, it can be seen on figure 9 that from the intensity of shopping at JD.ID X Mart, the number of respondents is the highest with the intensity of shopping at JD.ID X Mart, which is the respondent who only 1 times in a month shopped at JD.ID X Mart with 237 respondents (64%). While respondents with shopping intensity at JD.ID X Mart 2 to 5 times in a month were 119 respondents (32%), respondents with shopping intensity at JD.ID X Mart were more than 5 to 10 times in a month as many as 8 respondents (2%). And respondents with shopping intensity more than 10 times in a month as many as 8 respondents (2%).
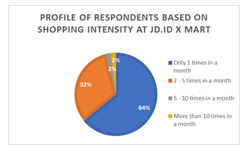 Figure 9: Shopping intensity
- Profile of Respondent by Get Store Information Sources
Based on the collection of questionnaire results on figure 10, it can be seen that based on JD.ID X Mart store information, the highest number of respondents gets JD.ID X Mart store information from social media (Instagram, Twitter, Facebook, etc.) with 205 respondents (55% ). While respondents get JD.ID X Mart store information from print media (newspapers, magazines, brochures, posters, etc.) as many as 8 respondents (2%), respondents get JD.ID X Mart store information from electronic media (television, radio, internet, etc.) as many as 73 respondents (20%), respondents get store information JD.ID X Mart from verbal information (family, friends, relatives, relations, etc.) as many as 74 respondents (20%), and respondents get store information JD.ID X Mart went straight from his shop because he happened to pass the JD.ID X Mart stores as many as 12 respondents (3%).
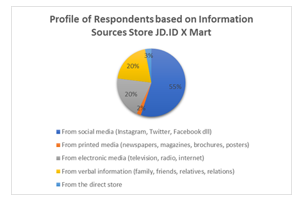 Figure 10: Type of information
The model testing is carried out with two steps, namely the measurement model (outer model) and the structural model (inner model). The outer model is done to test the validity and reliability of a model, while the inner model is done to predict the relationship between latent variables. Here are the structural models formed using Smart PLS.
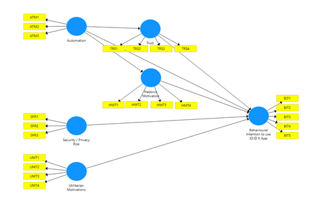 Figure 11: Research Model
4.2. Test Convergent Validity with Loading Factor
As seen on Table 2, In this loading factor, 2 indicators are removed, namely BIT3 and UMT3, because they have a factor value that is smaller than 0.7.
From the results of the loading factor above, it can be seen that:
- The ATM 1 indicator (active without human intervention) has the greatest influence on variable automation with a value of 0.902
- The BIT1 indicator (the value of benefits in shopping) has the greatest influence on the behavioral intention variable to use the JD.ID X application with a value of 0.887.
- The HMT2 indicator has a great influence on the hedonic motivation variable with a value of 0.865.
- The SPR2 (system security) indicator has the greatest influence on the security / privacy risk variable with a value of 0.882.
- e) TRS1 indicator (believe in using) has the greatest influence on the trust variable with a value of 0.888.
- f) The UMT4 indicator (fast oriented process) has the greatest influence on the utilitarian motivation variable with a value of 0.903.
Table 2: Loading Factor
| Number of Questionnaire | Automation | Behavioral Intention to use JD.ID X App | Hedonic Motivation | Security / Privacy Risk | Trust | Utilitarian Motivations |
| ATM1 | 0.902 | |||||
| ATM2 | 0.878 | |||||
| ATM3 | 0.821 | |||||
| BIT1 | 0.887 | |||||
| BIT2 | 0.855 | |||||
| BIT4 | 0.869 | |||||
| BIT5 | 0.879 | |||||
| HMT1 | 0.823 | |||||
| HMT2 | 0.865 | |||||
| HMT3 | 0.831 | |||||
| HMT4 | 0.823 | |||||
| SPR1 | 0.867 | |||||
| SPR2 | 0.882 | |||||
| SPR3 | 0.839 | |||||
| TRS1 | 0.888 | |||||
| TRS2 | 0.887 | |||||
| TRS3 | 0.770 | |||||
| TRS4 | 0.793 | |||||
| UMT1 | 0.868 | |||||
| UMT2 | 0.823 | |||||
| UMT4 | 0.903 |
4.3. AVE
Based on the results of the AVE value shown on Table 4 by SmartPLS 3.2.9 as in the table above, it can be concluded that all question items are valid because they have an AVE value greater than 0.50 [10].
Table 3: Loading Factor
| Construct | AVE |
| Automation (ATM) | 0.753 |
| Behavioral Intention to use JD.ID X App (BIT) | 0.762 |
| Hedonic Motivation (HMT) | 0.698 |
| Security / Privacy Risk (SPR) | 0.745 |
| Trust (TRS) | 0.699 |
| Utilitarian Motivations (UTM) | 0.749 |
4.4. Crossloading
From the results of cross loading on table 4, it is known that each cross loading value of the indicator on its own construct is greater than the cross loading of other construct indicators, so it can be said that the questionnaire indicator is valid.
Table 4: Crossloading
| ATM | BIT | HMT | SPR | TRS | UTM | ||||||
| ATM1 | 0.902 | 0.749 | 0.755 | 0.628 | 0.721 | 0.720 | |||||
| ATM2 | 0.878 | 0.739 | 0.707 | 0.619 | 0.737 | 0.696 | |||||
| ATM3 | 0.821 | 0.528 | 0.531 | 0.471 | 0.637 | 0.684 | |||||
| BIT1 | 0.731 | 0.887 | 0.785 | 0.616 | 0.712 | 0.657 | |||||
| BIT2 | 0.597 | 0.855 | 0.685 | 0.578 | 0.580 | 0.558 | |||||
| BIT4 | 0.652 | 0.869 | 0.735 | 0.626 | 0.611 | 0.574 | |||||
| BIT5 | 0.747 | 0.879 | 0.813 | 0.579 | 0.701 | 0.702 | |||||
| HMT1 | 0.599 | 0.662 | 0.823 | 0.472 | 0.588 | 0.536 | |||||
| HMT2 | 0.714 | 0.805 | 0.865 | 0.603 | 0.687 | 0.671 | |||||
| HMT3 | 0.722 | 0.715 | 0.831 | 0.584 | 0.687 | 0.658 | |||||
| HMT4 | 0.538 | 0.706 | 0.823 | 0.500 | 0.507 | 0.481 | |||||
| SPR1 | 0.594 | 0.653 | 0.585 | 0.867 | 0.648 | 0.541 | |||||
| SPR2 | 0.580 | 0.581 | 0.601 | 0.882 | 0.588 | 0.505 | |||||
| SPR3 | 0.550 | 0.533 | 0.490 | 0.839 | 0.561 | 0.516 | |||||
| TRS1 | 0.695 | 0.613 | 0.652 | 0.583 | 0.888 | 0.721 | |||||
| TRS2 | 0.746 | 0.705 | 0.698 | 0.593 | 0.887 | 0.817 | |||||
| TRS3 | 0.551 | 0.489 | 0.470 | 0.526 | 0.770 | 0.564 | |||||
| TRS4 | 0.685 | 0.669 | 0.638 | 0.623 | 0.793 | 0.602 | |||||
| UMT1 | 0.739 | 0.647 | 0.643 | 0.558 | 0.758 | 0.868 | |||||
| UMT2 | 0.585 | 0.576 | 0.550 | 0.486 | 0.647 | 0.823 | |||||
| UMT4 | 0.758 | 0.635 | 0.642 | 0.521 | 0.711 | 0.903 | |||||
| UMT4 | 0.758 | 0.635 | 0.642 | 0.521 | 0.711 | 0.903 | |||||
4.5. Cronbach’s Alpha
Based on the results of the cronbach’s alpha value on Table 5, it is known that each construct (Automation, Behavioral Intention to use JD.ID X App, Hedonic Motivations, Security / Pivacy Risk, Trust, Utilitarian Motivations) has high reliability or reliability because it has a value above 0.70 [10].
Table 5: Cronbach’s Alpha
| Construct | Cronbach’s Alpha |
| Automation | 0.836 |
| Behavioral Intention to use JD.ID X App | 0.896 |
| Hedonic Motivation | 0.856 |
| Security / Privacy Risk | 0.829 |
| Trust | 0.856 |
| Utilitarian Motivations | 0.832 |
4.6. R2 Square
Based on the results of the R-square value in the table on table 7, it can be concluded that:
- The influence of Automation, Hedonic Motivations, Security / Privacy Risk, Trust and Utilitarian Motivations on Behavioral Intention to use JD.ID X App is 0.798. This means that the ability to influence the variables Automation, Hedonic Motivations, Security / Privacy Risk, Trust and Utilitarian Motivations to explain the Behavioral Intention to use JD.ID X App variable is 79.8%, while 20.2% is explained by factors other than this research.
- The effect of Automation on Hedonic Motivations is 0.602. This means that the ability of the influence of the Automation variable to explain the Hedonic Motivations variable is 60%, while 40% is explained by other factors outside of this study.
- The effect of Automation on Trust is 0.653. This means that the ability of the influence of the Automation variable to explain the Trust variable is 65.3%, while 34.7% is explained by other factors outside of this study.
Table 6: R2 Square
| Construct | Cronbach’s Alpha | Detail |
| Automation | – | |
| Behavioral Intention to use JD.ID X App | 0.798 | High |
| Hedonic Motivation | 0.602 | Average |
| Security / Privacy Risk | – | |
| Trust | 0.653 | Average |
| Utilitarian Motivations | – |
4.7. Path Coeffitient
Path coefficient test is used to indicate whether there is influence between variables. If the greater the value of the path coefficient on one variable to another, the stronger the influence between these variables. To find out whether latent variables have a significant relationship or not, t-statistics or p values are used. In this study the authors used p-values.
 Figure 12: Path Coeffitient
As seen on Figure 12, to see from the path diagram the path coefficient and the value of the path coefficient will be calculated based on the regression equation formula as follows:
From Figure 11 above, the equations to be tested for the coefficients are:
ME1 = I0 + β1 X1 + ϵ0 (1)
ME2 = I1 + β2 X1 + ϵ1 (2)
Y = I2 + β6 ME1 + β7. ME2 + β3 X1 + β4. X2 + β5. X3 + ϵ2 (3)
If equation 1 and equation 2 are substituted for equation 3, the main equation is obtained:
Y = I + (β3 + β1. Β6 + β2. Β7) X1 + β4. X2 + β5. X3 + ϵ (4)
4.8. Hypothesis Testing
Table 7: Hypothesis Testing
| Original
Sample (O) |
Sample
Mean (M) |
Standard
Deviation (STDEV) |
T Statistics (|O/STDEV|) | P – Values | |
| Automation -> Trust | 0,808 | 0,807 | 0,024 | 33,716 | 0,000 |
| Automation -> Hedonic Motivation | 0,776 | 0,776 | 0,024 | 32,759 | 0,000 |
| Automation -> Behavioural Intention to use JD.ID X App | 0,163 | 0,167 | 0,065 | 2,488 | 0,013 |
| Security / Privacy Risk -> Behavioural Intention to use JD.ID X App | 0,135 | 0,133 | 0,041 | 3,312 | 0,001 |
| Utilitarian Motivation -> Behavioural Intention to use JD.ID X App | 0,056 | 0,054 | 0,060 | 0,921 | 0,357 |
| Trust -> Behavioural Intention to use JD.ID X App | 0,048 | 0,050 | 0,064 | 0,751 | 0,453 |
| Hedonic Motivation -> Behavioural Intention to use JD.ID X App | 0,578 | 0,576 | 0,070 | 8,263 | 0,000 |
| Specific Indirect Effect | |||||
| Automation -> Trust -> Behavioural Intention to use JD.ID X App | 0,039 | 0,040 | 0,052 | 0,750 | 0,454 |
|
Automation -> Hedonic Motivation -> Behavioural Intention to use JD.ID X App |
0,448 |
0,447
|
0,055 |
8,194 |
0,000 |
| Total Indirect Effect | |||||
| Automation -> Behavioural Intention to use JD.ID X App | 0,487 | 0,487 | 0,068 | 7,183 | 0,000 |
It can be concluded that overall the sample, 3 of the 10 proposed hypotheses were accepted. Hedonic Motivation and Trust are significantly influenced by Automation. Behavioral Intention to use JD.ID X App is significantly influenced by Automation, Hedonic Motivation, Security / Privacy Risk. Whereas Trust and Utilitarian Motivation do not significantly influence Behavioral Intention to use JD.ID X App. To see from the value of specific indirect effects, Trust does not have a significant mediating role between the Automation variable and the Behavioral Intention to use JD.ID X App variable, but Hedonic Motivations has a significant mediating role. And to see from the value of total indirect effect, Trust and Hedonic Motivations together have a significant mediating role between the Automation variable on Behavioral Intention to use JD.ID X App.
Here are the result:
- Effect of Automation on Trust
The first hypothesis shows that Automation has a significant effect on Trust. Hypothesis test results show that the t-statistics is 33,176. This means that the Automation variable in terms of statistical calculations has a significant effect on Trust. Thus the first hypothesis is accepted.
The results of this study indicate that the greater the automation technology services provided at JD.ID X Mart for users / consumers, the higher the level of user confidence.
- Effect of Automation on Hedonic Motivations
The second hypothesis shows that Automation has a significant positive effect on Hedoonic Motivations. Hypothesis test results show that the t-statistics is 32,759. This means that the Automation variable in terms of statistical calculations has a significant effect on Hedonic Motivations. Thus the second hypothesis is accepted.
- Effect of Automation on Behavioral Intention to use JD.ID X App
The third hypothesis shows that Automation has a significant positive effect on Behavioral Intention to use JD.ID X App. Hypothesis test results show that the t-statistics is 2,488. This means that the Automation variable in terms of statistical calculations has a significant effect on Behavioral Intention to use JD.ID X App. Thus the third hypothesis is accepted.
- Effect of Security / Privacy Risk on Behavioral Intention to use JD.ID X App
The fourth hypothesis shows that Security / Pivacy Risk has a significant positive effect on Behavioral Intention to use JD.ID X App. Hypothesis test results show that the t-statistics is 3,312. This means that the Security / Pivacy Risk variable in terms of statistical calculations has a significant effect on Behavioral Intention to use JD.ID X App. Thus the fourth hypothesis is accepted. The results of this study indicate that the greater the value of security felt by users / consumers when shopping at JD.ID X Mart using JD.ID X App, the higher the value of people’s intention to continue shopping at JD.ID X Mart.
- The Effect of Utilitarian Motivations on Behavioral Intention to use JD.ID X App
The fifth hypothesis shows that Utilitaian Motivations does not have a significant effect on Behavioral Intention to use JD.ID X App. Hypothesis test results show that the t-statistics is 0,921. This means that the Utilitaian Motivations variable in terms of statistical calculations does not have a significant effect on Behavioral Intention to use JD.ID X App. Thus the fifth hypothesis is rejected.
The amount of benefit value in shopping at JD.ID X Mart does not in fact have an influence on the value of people’s intention to continue shopping at JD.ID X Mart
- The Effect of Trust on Behavioral Intention to use JD.ID X App
The sixth hypothesis shows that Trust does not have a significant influence on Behavioral Intention to use JD.ID X App. Hypothesis test results show that the t-statistics is 0.751. This means that the Trust variable in terms of statistical calculations does not have a significant effect on Behavioral Intention to use JD.ID X App. Thus the sixth hypothesis is rejected. It can be concluded that the value of trust in shopping at JD.ID X Mart does not have an influence on the value of people’s intention to continue shopping at JD.ID X Mart.
- Effect of Hedonic Motivations on Behavioral Intention to use JD.ID X App
The seventh hypothesis shows that Hedonic Motivations have a significant influence on Behavioral Intention to use JD.ID X App. Hypothesis test results show that the t-statistics is 8,263. This means that the Trust variable in terms of statistical calculations has a significant effect on Behavioral Intention to use JD.ID X App. Thus the seventh hypothesis is accepted.
- Effect of Trust Mediation between Automation on Behavioral Intention to use JD.ID X App
The eighth hypothesis shows that the role of trust mediation between Automation and Behavioral Intention to use JD.ID X App does not have a significant effect. Hypothesis test results show that the t-statistics is 0.750. That is, the role of Trust mediation in terms of statistical calculations does not have a significant effect between Automation on Behavioral Intention to use JD.ID X App. Thus the eighth hypothesis is rejected.
- The Influence of Mediating Hedonic Motivations between Automation on Behavioral Intention to use JD.ID X App
The ninth hypothesis shows that the mediating role of Hedonic Motivations between Automation and Behavioral Intention to use JD.ID X App has a significant effect. Hypothesis test results show that the t-statistics is 8,194. This means that the mediating role of Hedonic Motivations in terms of statistical calculations has a significant effect between Automation on Behavioral Intention to use JD.ID X App. Thus the ninth hypothesis is accepted.
- Effect of Trust Mediation and Hedonic Motivations between Automation on Behavioral Intention to use JD.ID X App
The tenth hypothesis shows that the mediating role of Trust and Hedonic Motivations between Automation on Behavioral Intention to use JD.ID X App has a significant effect. Hypothesis test results show that the t-statistics is 7,183. This means that the mediating role of Trust and Hedonic Motivations in terms of statistical calculations has a significant effect between Automation on Behavioral Intention to use JD.ID X App. Thus the tenth hypothesis is accepted.
5. Conclusion
From the results of research conducted and data processing that has also been carried out relating to any factors that influence people’s behavioral intentions in shopping by using the JD.ID X application, here are the results: factors that do not significantly influence Behavioral Intention to use JD.ID X App in this study is Trust and Utilitarian Motivation. While the factors that significantly influence Behavioral Intention to use JD.ID X App in this study is Automation, Hedonic Motivation, Security / Privacy Risk. Factors that significantly influence Trust and Utilitarian Motivation in this study are Automation’s factor.
From the results of the processed data, it can be seen that Automation does not significantly affect the Behavioral Intention to use JD.ID X App, but the effect of Automation is stronger when mediated by the Hedonic Motivation variable, which means that the main motivation of people shopping at JD.ID X Mart not because of the Automation factor, but the Automation factor gives its value to Hedonic behavior. Which is the meaning of Hedonic behavior is that people feel the value of pleasure while shopping at JD.ID X Mart. So it can be concluded that people do not shop because the goal is to get the product they want or need or to find a better price, but people shop because there is motivation to increase their prestige, which is where self-esteem is increased when shopping at JD.ID X Mart.
In this study some factors are trust and utilitarian motivations have not been significant. It can be concluded that creating trust value requires interaction with a long time with a positive impression. And this can be proven by the answers of respondents’ profiles with the intensity of shopping at JD.ID X Mart, it was noted that the highest value of respondents who had shopped at JD.ID X Mart was only one time, 237 respondents (64%). And for the utilitarian motivation factor, where the meaning of the utilitarian value is the community feels the value of benefits in shopping, in this study it can be concluded that the value of utilitarian motivation is not significant, it can be seen that the main purpose of the community in shopping at JD.ID X Mart has not been to look for the needs they want or look for the products they need because now the purpose of the community in shopping at JD.ID X Mart is because the automation factor is mediated by the hedonic factor itself. And this can also be seen from the respondents’ answers if people feel the value of benefits (utilitarian motivation) in shopping at JD.ID X Mart, then for the value of shopping intensity at JD.ID X Mart should be the highest value that does not refer in “just 1-time shopping “.
After seeing the results of this study, the authors see that initially, the automation factor can affect the behavioral intention of JD.ID X application users in shopping at JD.ID X Mart, but after seeing the results of this study it turns out that automation has not become a major factor in influencing behavioral intention in using the JD.ID X application but the hedonic motivation factor is the main factor in influencing the behavioral intention of JD.ID X application users to shop at JD.ID X Mart.
The suggestion for the future management of JD.ID X Mart is that the manager must also increase the value of utilitarian motivations and trust, not just automation. Because the automation value will sooner or later be followed by existing competitors. For how to increase it can be increased from the product being sold, make the item the main attraction, create value that consumers who shop want to find the goods they need as well, and good goods. Because based on the data obtained, the reason people shop at JD.ID X Mart is not because of that. To increase the value of trust, managers must also increase trust with various marketing strategies, so that fanatical customers will shop.
Authors believe that the results of future research with expanding the scope and adding aspects to the research model will produce theoretical and practical implications that are useful for industry and people who frequently shop at JD.ID X Mart using JD.ID X.
- M. Richard, Bisnis Ritel Modern Ditarget Tumbuh 10%, Ekonomi Bisinis.Com,.
- M.L. Pandin, POTRET BISNIS RITEL DI INDONESIA: PASAR MODERN, 2009.
- P. I. R., C.Y. Serfiyani, I. Hariyani, SUKSES BISNIS RITEL MODERN. PT. ELEX MEDIA KOMPUTINDO (GRAMEDIA GROUP), 2013.
- Khoirunnisa, Top 10 E-Commerce di Indonesia 2018, Selular.ID, 2018.
- P. Alex, K. Backes, “The amazon go concept: Implications, applications, and sustainability,” Journal of Business and Management, 24(1), 79–92, 2018, doi:10.6347 /JBM.201803_24(1).0004.
- C.J. Parker, H. Wang, “Examining hedonic and utilitarian motivations for m-commerce fashion retail app engagement,” Journal of Fashion Marketing and Management: AnInternational Journal, 20(4), 487–506, 2016, doi:https://doi.org/10.1108/JFMM-02-2016-0015.
- R. Chuawatcharin, N. Gerdsri, “Factors influencing the attitudes and behavioural intentions to use just walk out technology among Bangkok consumers,” Int. J. Public Sector Performance Management, 5(2), 2019, doi:10.1504/IJPSPM.2019.099091.
- F. Pantea, S. Gupta, U. Sivarajah, A. Broderick, “Investigating the effects of smart technology on customer dynamics and customer experience.,” Computers in Human Behavior, 80, 271-282., 2018, doi:10.1016/j.chb.2017.11.014.
- J.-W. Lian, “Why is self-service technology (SST) unpopular? Extending the IS success model,” Library Hi Tech, 2018, doi:https://doi.org/10.1108/LHT-01-2018-0015.
- H. Joe F., C.M. Ringle, M. Sarstedt, “PLS-SEM: Indeed a silver bullet,” Journal of Marketing Theory and Practice, 19(2), 139-152., 2011, doi:10.2753/MTP1069-6679190202.