A Model-Driven Digital Twin Framework Development for Sulfur Dioxide Conversion Units Simulation
 , Ridouane Oulhiq, Ahmed Souissi, Mohamed Salouhi, Khalid Benjelloun, Ahmed Bichri
Adv. Sci. Technol. Eng. Syst. J. 6(2), 122–131 (2021);
 DOI: 10.25046/aj060215
In the phosphate industry, sulfuric acid is a key compound in phosphoric acid and fertilizer production. Industrially, the sulfuric acid H2SO4 is made generally in a sequence of three main steps: burning liquid sulfur with air, catalytic oxidation of sulfur dioxide SO2 to sulfur trioxide SO3, and formation of H2SO4 by the reaction of H2O with the SO3. The catalytic conversion of the SO2 into the SO3 is considered as the crucial reaction that affects the gas emissions and the performance of the process. In this paper, an industrial SO2 conversion unit of four catalytic beds reactors with vanadium pentoxide as a catalyst, and three heat exchangers were modeled. The model was based on heat transfer, energy and mass balance equations, and the kinetic reaction of the SO2 catalytic conversion was proposed and calibrated using the experimental plant data. The simulation of the four catalytic beds was carried out in steady-state and dynamic mode using Unisim Design R451 simulator. The proposed model was tested and validated using the studied plant measurements, and the accuracy of the model has exceeded 97%. A graphical interface of the SO2 conversion unit was integrated to make it suitable for industrial use and operator training. Finally, a digital twin (DT) of the studied conversion unit was developed based on an architecture integrating the plant, the virtual system, and the communication part in a Distributed Control System (DCS) context. The developed DT in this work makes it possible to simulate in real-time the SO2 conversion unit, predict the process performance, and optimize the unit efficiency
1.Introduction
In the era of digital transformation and digital factories, a new concept has been deployed known as digital twin (DT). It is considered an important component in achieving a smart and intelligent manufacturing plant. Digital twins’ concept or the virtual representation of a physical product was introduced the first time in [1]. In [2], authors have defined the DT as a technology that refers to the method that can model and describe the performance of a physical entity. They add that DT is the tool that enables the interaction between the real physical system, and its twin in the cyber world. In manufacturing processes, DT can represent a reliable base that provides an accurate prediction of process parameters and performance, which can be used for different monitoring and optimization tasks [3, 4]. The implantation of a DT must include three important parts: the physical part, the digital part, and the physical-digital communication part that ensures the connection between the physical and the virtual product. Thus, physical product data are generated and collected from the physical part of the DT, and feed its virtual model to provide real-time simulation and prediction in real conditions [5].
In recent years, different researchers have focused on DT development and implementation for industrial issues. In [6], authors have worked on the reengineering of aircraft structural life using DT concept. They used a DT that was developed by integrating several models in a virtual software to study the design variation under different operating conditions. The virtual software model includes the most important models in the aircraft structural life field, such as the computational fluid dynamic (CFD) model, the structural dynamic model, and the fatigue cracking model. In [7], authors have investigated the DT-based geometric optimization of the centrifugal impeller (CI) with free form blades for five-axis flank milling. To do so, several experiments and variations were performed to adjust the virtual model of the studied CI to its real physical part. The virtual model in their case was developed based on the geometric modeling, the aerodynamic parameters evaluation, and the machining optimization. In [8], a DT model was proposed for hollow glass production lines. The developed DT makes it possible to simulate the production line behavior with real process data and optimize the design of the production line. Indeed, DT aims to capitalize on advances in modeling and simulation aspects, since all observations and results that will be generated by the DT are, in fact, predicted by the virtual model of the studied system.
In the literature, several studies have been carried out to develop models that can simulate sulfuric acid processes with high accuracy. The most used process in sulfuric acid manufacturing plants is the contact process [9]. This process is based on three important steps: liquid sulfur burning, sulfur dioxide SO2 catalytic conversion, and sulfur trioxide SO3 absorption. The SO2 catalytic conversion stage is considered as the most critical step in the sulfuric acid contact process. Considering the importance of this step, numerous studies have been performed to describe and optimize the SO2 conversion reactor based on process modeling and simulation aspects. In [10], authors have presented a dynamic model to simulate the SO2 catalytic oxidation over the vanadium pentoxide V2O5 catalyst. The obtained model was validated using an experimental setup of a fixed bed reactor, and a new process design was proposed to ensure zero-mission. In [11], authors have presented a model to simulate the SO2 catalytic converter using a pseudo homogeneous perfect plug flow model, and the model has been solved using the COMSOL Multiphysics software. In [12], authors have simulated the SO2 oxidation reactor by a series of tanks, and simulation results were validated using measurement collected from the pilot and industrial reactors. Another interesting work has been published recently in The Canadian Journal of Chemical Engineering, in which the SO2 converter model was developed based on mass and energy balance equations, and simulation results were validated using industrial measurement [13].
In addition to the SO2 catalytic converter, and due to the exothermicity of the SO2 conversion reactor, heat exchangers (HE) are indispensable in sulfuric acid industries. In SO2 conversion units, HE devices are used to adjust the temperature of the gas leaving each catalytic bed of the converter, before feeding the next catalytic bed. The cooling step between the SO2 converter beds is necessary to reach a high conversion rate [14]. Thus, the Shell and Tube Heat Exchanger (STHE) is the most used type of HE in this industrial process. In this context, many researchers have focused on STHE modeling and simulation to study and optimize the heat transfer performance within these devices. For example, in [15], authors have developed a dynamic one-dimensional model of multi-pass STHE, and model equations were solved using the finite volume method. In [16], flow and temperature fields modeling and simulation in a small HE were investigated using the CFD package of ANSYS Fluent 6.3. Also, they tested different turbulence models, knowing: Spalart-Allmaras model, two k-ε standard and realizable models. It was concluded that the k-ε realizable model was the best to simulate the studied HE, assuming a fine mesh and a first order discretization. Using Aspen-HYSYS V7.3 simulator, an optimization work of the air heating unit within the paddy drying process has been performed [17]. Simulation tasks of the studied HE were performed in Aspen HYSYS under many operating conditions, while the design task was carried out in Aspen Exchanger Design and Rating (EDR).
This paper represents an extension of the work that has been presented in the 5th International Conference on Renewable Energies for Developing Countries (REDEC), in which authors have modeled and simulated a STHE with different approaches, using ANSYS-Fluent, COMSOL Multiphysics software, Unisim Design R451 simulator, and Matlab-Simulink [18]. All the presented models were validated using an experimental setup under a wide range of operating conditions. However, the model developed in Unisim Design simulator was selected as the best model to simulate the studied system. Besides, the model was used to simulate an industrial sulfuric acid cooling unit and has shown a good accuracy with the plant measurement.
In the present study, a dynamic model of an industrial sulfuric acid conversion unit was proposed and simulated using Unisim Design simulator. The simulated unit comprises a SO2 conversion reactor with four catalytic beds and three HE. The kinetic parameters of the SO2 catalytic conversion reaction were determined using experimental data. The simulation was performed in steady-state and dynamic mode, and simulation results were validated using experimental measurement from the studied SO2 conversion unit. Additionally, a DT architecture of the studied system was proposed. The physical system of the DT was represented by the industrial plant unit, while the virtual part was represented by the developed SO2 conversion unit model. The communication part of the DT was developed based on the Communication Object Model (COM), to ensure the connection between the real unit and its virtual representation in Unisim Design simulator. Also, a graphical interface was developed to make the developed DT useful for industrial use.
- Sulfur dioxide conversion unit description
In the sulfuric acid double contact process, the sulfuric acid is produced in three principal steps: liquid sulfur combustion, SO2 conversion, and SO3 absorption.
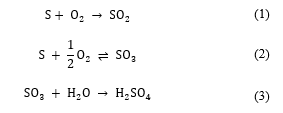
Firstly, the wet air is dried in a drying tower using the circulating sulfuric acid, to absorb moisture contained in the air. Secondly, the liquid sulfur is burned in a sulfur burner with the dry air, to produce the SO2 necessary for conversion step. The gas mixture feeds the conversion unit in which the SO2 is converted into SO3, using the vanadium pentoxide catalytic V2O5. Finally, the SO3 produced by the SO2 catalytic conversion is absorbed using the diluted circulating sulfuric acid. The three exothermic reactions governing the sulfuric acid double contact process are given as follows:
 The sulfur dioxide conversion step is considered as the main stage of each sulfuric acid manufacturing plant, and its role is to ensure the conversion of the SO2 generated by the liquid sulfur combustion into SO3. Each catalytic conversion unit comprises generally a reactor of several catalytic beds and heat exchangers that are used to regulate the inlet temperature of each catalytic bed. In this study, the SO2 catalytic converter is a four catalytic beds reactor, with three heat exchangers as shown in Figure 1.
The typical configuration of the SO2 converter consists of a vertical cylindrical adiabatic reactor. The dimensions of the equipment, as well as the height of each catalytic bed, are variable according to the conversion unit operating parameters. The packed catalytic beds of the converter are the main components SO2 conversion reactor. Each one of the packed beds is supported by perforated metal grids that help in retaining the catalyst and allowing the gas to flow through. The gases flow from the top to the bottom of the beds. Ceramic rollers are placed on the catalyst to avoid any movement that may be caused by the gases flow, and to facilitate the exit of the gases after passing through the catalyst. The vanadium pentoxide V2O5 catalyst used in the SO2 catalytic conversion reactor is highly porous and presents a specific surface in which the active phase is deposited. It is considered as the typical and highly catalyst used in the SO2/SO3 conversion step, with an operating temperature between 370 °C and 630 °C [19]. The conversion reaction in each catalytic bed is identical, but the amount of the catalyst required for the reaction changes according to the SO3/SO2 ratio in the feed. For example, in the first three catalytic beds, the amount of catalyst increases as the SO3/SO2 ratio increases.
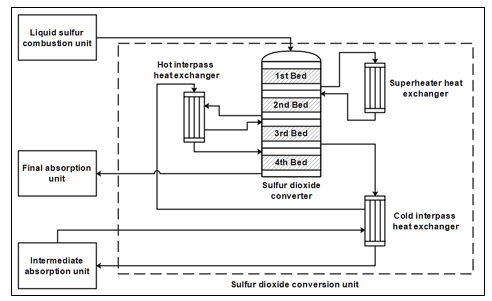 Figure 1: Sulfur dioxide conversion unit
The gas mixture feeds the first catalytic bed at a temperature of 400~440 °C. Since the catalytic conversion of SO2 is an exothermic reaction, the temperature of the gas mixture increases as the amount of the generated SO3 increases until reaching the equilibrium point. At the equilibrium point, the forward and the backward reaction rate are equal. To increase the forward reaction rate, the gas leaving the first catalytic bed is cooled to a lower temperature value using a superheater heat exchanger. After passing through the second catalytic bed, the mixture gas is cooled again before feeding the third catalytic bed. Cooling the gas before feeding each catalytic bed is a strategy that is used to further increase the SO2 conversion rate. The gas leaving the third catalytic bed passes through an intermediate absorption, in which the SO3 generated by the SO2 catalytic conversion is absorbed by the circulating sulfuric acid. This strategy is used to reduces the amount of the reaction products, which also increases the forward rate of the conversion reaction.
- Dynamic model of the conversion unit
In this study, the Unisim Design R451 simulator was used to model and simulate the studied SO2 conversion unit. To develop the virtual model of the studied flowsheet under the Unisim Design simulator, it is necessary to go through two environments. The first environment that must be configured is the basis environment of the simulator, in which the configuration starts by specifying the chemical components involved in the studied process. For the components that are not presented in the simulator components library, they can be defined as new hypo-component using their specific chemical properties, such as the molar weight and the critical temperature and pressure value. For the SO2 conversion unit, all components required to perform this simulation are available in the simulator components library. Another specification that must be defined in the basis environment is the fluid-package, which represents the equation of state that will be used to calculate and predict the fluids’ properties. Thus, the Peng-Robinson fluid-package was selected for the gaseous phase, and the Non-Random Two-Liquid model (NRTL) was selected for the liquid phase. Table (1) summarizes the chemical components and the fluid-packages used to perform this simulation.
Table 1: Unisim Design components list for the SO2 conversion unit process simulation.
| Component name | Component formula | Fluid-packages |
| Oxygen | O2 | Peng-Robinson |
| Nitrogen | N2 | |
| Sulfur dioxide | SO2 | |
| Sulfur trioxide | SO3 | |
| Water | H2O | NRTL |
| Sulfuric acid | H2SO4 |
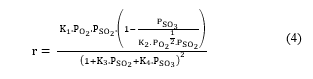
Finally, the chemical reactions involved in the process must be defined in the simulator using the stoichiometric coefficients of the reactants and the products. Note that the type of the defined chemical reaction must be also specified. In the Unisim Design simulator, five types of chemical reactions are provided: conversion reaction, equilibrium reaction, kinetic reaction, heterogeneous reaction, and simple rate reaction. For the SO2 catalytic conversion reaction, the heterogenous reaction type was selected. Thus, the reaction rate of the SO2 catalytic conversion is defined in the simulator as follows [14]:
 where:
- : kinetic conversion rate (kmole/m3.s);
- : partial pressure of the component i (atm);
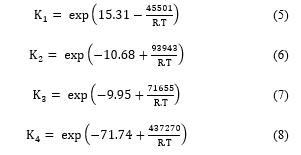
Constants K1, K2, K3 and K4 have been determined experimentally using industrial data to fit with the plant measurement, and are given as follows:
 Secondly, the simulation environment of the simulator must be configurated by developing the flowsheet of the studied process, using material and energy streams, and equipment models. Table (2) shows the equipment models that have been used in the SO2 conversion unit simulation:
Table 2: Unisim Design equipment models for the studied process simulation
| Equipment model | Description |
| Plug flow reactors | Catalytic conversion |
| Shell and tube exchangers | Heat transfer |
3.1. Catalytic converter model
The SO2 converter was modeled with a series of reactors, in which each catalytic bed was modeled with a plug flow reactor (PFR). The PFR consists of a tubular reactor with a cylindrical pipe form, in which the transport mechanism is supposed ideal plug flow type. The following assumptions were considered in the model development: (1) the internal and external transfer resistances to mass and heat transfer are neglected, (2) the gas flow in the reactor is one-dimensional in the axial direction z, (3) the gas is radially isotropic, (4) the axial mixing in each PFR is supposed negligible. Under these assumptions, the proposed dynamic model of the SO2 conversion reactor is given by the following mass and energy conservation equations:
Component i mass balance in the catalytic bed k:
![]() Energy balance in the catalytic bed k:
Energy balance in the catalytic bed k:
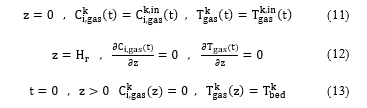
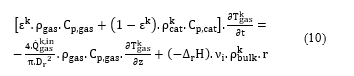 Boundary and initial conditions:
 where:
- : molar concentration of the component i in the gas (mol/m3);
- : stoichiometric coefficient of the component i in the conversion reaction;
- : bulk density (kg/m3);
- : reaction rate (kmole/kg cat.h);
- : heat capacity of the gas (J/kg.K);
- : heat capacity of the catalyst (J/kg.K);
- : void fraction of the bed k;
- : temperature of the gas in the bed k (K);
- : density of the gas (kg/m3);
- : conversion reaction heat (J/mole).
In equation (9), the term on the left-hand side represents the component i mass accumulation in the gas. The first term on the right-hand side represents the component i mass contribution, and the second term represents the mass consumption of the components i. In equation (10), the term on the left-hand side represents the heat accumulation in the gas, the first term on the right-hand side represents the heat contribution, and the second term represents the heat generated by the catalytic reaction.
In the SO2 catalytic conversion, the conversion rate is defined as the amount of SO2 that has been converted into SO3, and it is given by:
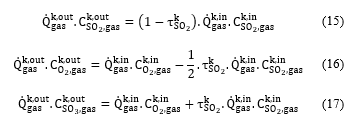
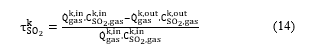 At the equilibrium state, and using the reaction stoichiometry and the mass conservation, the molar concentration of the components involved in the conversion reaction can be expressed according to the SO2 conversion rate as follows:
 Assuming that the mixture gas is ideal, the SO2 molar concentration can be given according to its molar fraction using the equation (18):
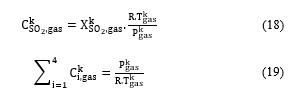 By summing the equations from (15) to (17) and using the equation (19), the gas flowrate at the outlet of the catalytic bed k can be calculated by (20):
 3.2. Heat exchangers model
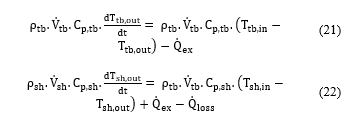
In this study, STHE used in the SO2 conversion unit was modeled based on the heat balance between fluids in the shell and the tube side. In the STHE model development, the following assumptions were considered: (1) pressure drops are negligible, (2) fluids are single-phase, (3) fluids are incompressible, (4) fluids flows are one dimensional, (4) fluids flows are radially isotropic (5) radiations heat transfer are negligible, (5) heat capacities of fluids and solids are constant. Under these assumptions, the STHE model can be written in terms of energy balance equations in the tube side and the shell side [18]:
 where:
- : densities of fluids in the tube side and the shell side, respectively (kg/m3);
- : volume flow rate of fluids in the tube side and the shell side, respectively (m3/h);
- : heat capacities of fluids in the tube side and the shell side, respectively (J/kg.K);
- : inlet and outlet temperature of fluid in the tube side (K);
- : inlet and outlet temperature of fluid in the shell side (K);
- : heat transfer and heat loss in the heat exchanger, respectively (W).
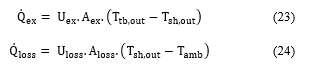
The heat transfer between the tube side and the shell side, and the heat loss in the atmosphere are defined as bellow:
 where:
- : heat transfer coefficients (W/m².K);
- : heat transfer areas (m²);
- : ambient temperature (K).
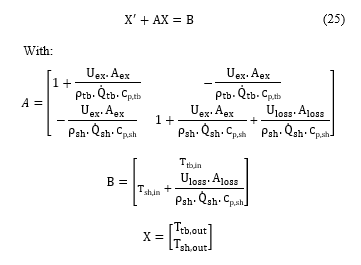
By substituting (23) and (24) in (21) and (22), the dynamic model of the STHE can be described by the following equation:
 The overall heat transfer coefficients can be calculated using the exchanger sizes and material properties:
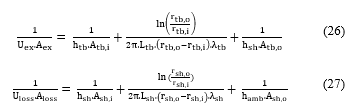 where:
- : heat transfer coefficient of fluids in the tube side and the shell side, respectively (W/m².K);
- : heat transfer coefficient of the air (W/m².K);
- : inner and outer radius of the tube (W/m².K);
- : inner and outer radius of the shell (W/m².K);
- : length of the shell and the tube, respectively (m);
- : tube side inner and outer areas (m²);
- : shell side inner and outer areas (m²).
Heat transfer coefficients in fluids circulating in the tube and shell can be estimated using the Prandtl (Pr), Reynolds (Re), and Nusselt (Nu) numbers:
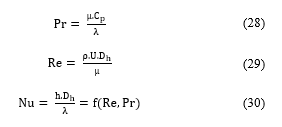 where:
- : fluid dynamic viscosity (kg/m.s);
- : specific heat (J/kg.K);
- : fluid thermal conductivity (W/m².K);
- : fluid density (kg/m3);
- : fluid velocity (m/s);
- : characteristic diameter (m).
- : convective heat transfer coefficient (W/m².K);
- : function of Re and Pr.
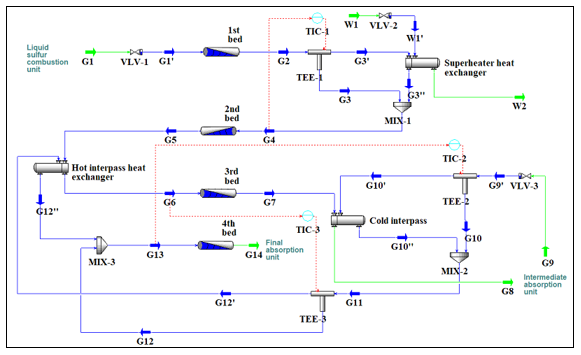 Figure 2: SO2 conversion unit model simulation under Unisim Design
Several correlations can be used to relate these three dimensionless numbers, depending to the geometry and the flow type, knowing the free convection at vertical wall or the horizontal plates, and the forced convection on flat plate. Thus, numerous equations are available to calculate the Nu number according to Re and Pr numbers, such as Dittus-Boelter equation [20], Sieder-Tate equation [21] and Gnielinski equation [22].
- Model Simulation
The conversion unit simulation of the studied sulfuric acid plant was performed under the Unisim Design R451 simulator, using PFR and STHE models. The chemical components and reactions involved in the SO2 conversion unit, and the appropriate fluid-packages were defined in the basis environment. Firstly, the simulation was configurated and performed in steady state around an operating point before running the simulation in dynamic mode. Key stream properties of the gas mixture feeding the first catalytic bed are summarized in Table (3). For the PID controllers used to adjust the inlet temperature of each catalytic bed, the setpoint in the three first catalytic beds was configurated at 440 °C, while it was set to 390 °C in the last catalytic bed. Equipment sizes and material properties were also introduced in the simulator to simulate the dynamic response of the unit. The flowsheet simulation of the studied SO2 conversion unit under the Unisim Design R451 simulator is shown in Figure 2. Note that all the simulations performed in this study were carried out in a Dell Precision 5820 desktop, using 32 Go of RAM and Intel® Xeon® W-2123 CPU @ 3.60 GH processor.
Table 3: Gas mixture properties of the stream ‘G1’ feeding the first bed
| Stream name | G1 |
| Temperature (°C) | 440 |
| Pressure (kPa) | 150 |
| Flowrate Q(m3/h) | 572,6 |
| % N2 (molar fraction) | 79,16 |
| % O2 (molar fraction) | 9,7 |
| % SO2 (molar fraction) | 10.87 |
| % SO3 (molar fraction) | 0.27 |
According to the steady-state simulation results, the gas mixture leaves the first catalytic bed at a temperature of 634.7 °C, since the catalytic conversion of SO2 into SO3 is a heat generating reaction. The conversion rate at the first catalytic bed was calculated by the model and found at the value of 63.43 %. As mentioned in the conversion unit description, the gas mixture is cooled before feeding the next catalytic bed to increase the SO2 conversion rate. The outlet temperature value of the second and the third catalytic bed was 522 °C and 460.5 °C, and the conversion rate has reached 89.99 % and 96.59 %, respectively. At the outlet of the third catalytic bed, the gas mixture is sent to the intermediate absorption unit, in which the SO3 produced in the first three catalytic beds is absorbed by the circulating sulfuric acid. The intermediate absorption step represents another way to well increase the SO2 conversion rate. The absorption rate of the SO3 in the intermediate absorption unit is about 99.98 %. The gas mixture feeds the last catalytic bed at the temperature of 390 °C and the remained SO2 is converted into SO3 before feeding the last absorption unit. The outlet temperature of the fourth catalytic bed was about 403.8 °C, and the cumulative conversion rate of SO2 has reached the value of 99.97 %. Note that the gas transport along the four packed catalytic beds is accompanied by a pressure drop, and it is calculated using the Ergun equation. Table (4) summarizes the steady state simulation results of the SO2 catalytic conversion reactor.
Table 4: Steady state simulation results of the SO2 catalytic converter.
| Reactor beds | 1st bed | 2nd bed | 3rd bed | 4th bed |
| Inlet temperature (°C) | 440 | 440 | 440 | 390 |
| Outlet temperature (°C) | 634.7 | 522 | 460.5 | 403.8 |
| Pressure drop (kPa) | 1.707 | 1.735 | 2.084 | 1.662 |
| Cumulative conversion rate (%) | 63.43 | 89.99 | 96.59 | 99.97 |
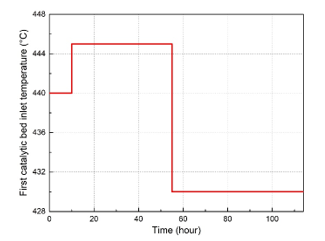 Figure 3: First catalytic bed inlet temperature variations for the dynamic simulation
To simulate the dynamic response of the studied system, slight variations were applied on the first catalytic inlet temperature as shown in Figure 3. In this study, only the dynamic response of one catalytic bed was considered since the model is the same and remains applicable for all the other catalytic beds. Afterward, the SO2 conversion rate and the outlet temperature of the first catalytic bed have been calculated and observed using the dynamic simulation of the studied unit. Simulation results of the first catalytic bed dynamic response are presented in Figure 4 and Figure 5. Firstly, the inlet temperature of the first catalytic bed has been set to the value of 445 °C. As shown in the dynamic simulation results, the outlet temperature increased from 634.7 °C to 637 °C after a rise time 28.5 hours, and with a time constant of 10 hours. Then, a new steady state has been established at this point. When it comes to the SO2 conversion rate, it decreased to the value of 62.68 %. After decreasing the inlet temperature of the gas mixture at the first catalytic bed from 445 °C to 430 °C, the system has evolved towards a new steady state point. The transit response of the system after this variation can be also described approximately with a time constant of 9.75 hours and a rise time of 29 hours. After that, the outlet temperature decreased from 637 °C to the value of 629.5 °C, while the SO2 conversion rate increased from 62.68 % to the value of 64.91 %.
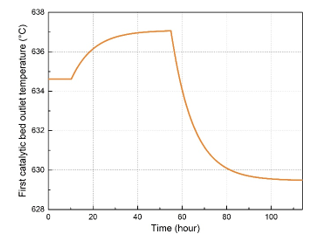 Figure 4: First catalytic bed outlet temperature dynamic response
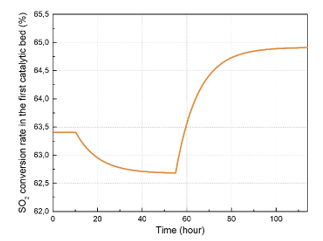 Figure 5: First catalytic bed SO2 conversion dynamic response
- Digital Twin architecture development and simulation
There are different understandings of Digital Twins. In some papers, the focus is on simulation [23, 24]. Others argue that DT integrates three dimensions: physical, virtual, and communication parts [25, 26]. In this paper, based on the three-dimension model, the proposed architecture involves three main components: the physical system, the virtual system, and the communication protocol. The physical system represents the real sulfuric acid process. The virtual system is the developed and simulated model. For communication, the Open Platform Communications Unified Architecture (OPC UA), an industrial communication protocol that enables interoperability and connectivity of devices with different protocols [27], is used. In [28], a literature review discussing digital twins, it was mentioned that one of the main gaps in digital twins is the integration with the control system.
In the proposed architecture, the DT is integrated into a DCS context. The DT is installed on a server in the engineering room of the process distributed control system (DCS) (Figure 6) A copy of the graphical interface of the DT is also integrated into the control room for operators’ daily uses. Using the OPC UA, an OPC server is developed to read real time data from field control stations (FCS) (Figure 7), which are connected to the real process. Then an OPC client is used to read data from the server and feed it to the core simulator developed using Unisim Design R451. A friendly user interface, inspired by the supervisory interfaces, is then integrated to show the results in both the engineering room and the control room. The communication between the modules of the DT, the OPC client, the core simulator, and the graphical interface is ensured based on the COM protocol. To communicate with the FCSs, the DT unit uses the appropriate DCS interface card. Regarding the Human Interface Station DT (HIS-DT), the communication with the DT uses the Distributed COM (DCOM) protocol.
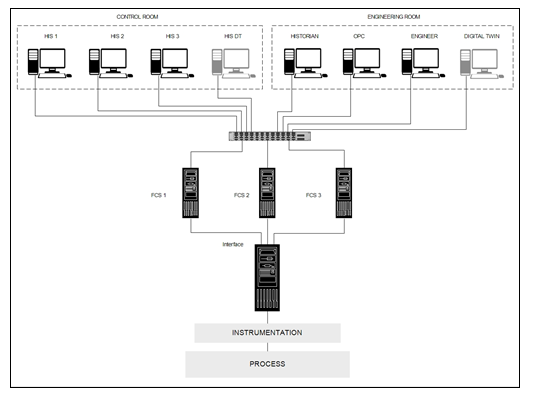 Figure 6: Digital Twin integration with DCS
The proposed DT of the studied SO2 conversion unit was implemented and tested in a period of 24 hours. Measurements of the liquid sulfur and the air supply properties (flowrate, temperature, and pressure) were collected online with a sampling time of 1 min. Thus, the simulation of the studied unit was performed in real-time using the generated data and the actual operating parameters of the plan as inputs. In Figure. 8 is shown the temporal variation of the four beds outlet temperature obtained by the DT simulation and the plant measurements. To compare and validate the simulation results, some statistical measures were calculated based on data illustrated in Figure. 8, knowing the determination coefficient R², the maximum error ME, the mean absolute error MAE, and the root mean square error RMSE. Table (5) regroups the results of the statistical comparison between the simulation results and the measurement values. Referring to Table (5), it is shown that results obtained by the simulation are in good agreement with the plant data with 97 %, which validates the model employed in the development of the SO2 conversion unit DT.
Table 5: Statistical measures of the simulation results and plant data.
| Measure | 1st bed | 2nd bed | 3rd bed | 4th bed |
| R-squared | 0.9708 | 0.9838 | 0.9842 | 0.9787 |
| Maximum error (°C) | 11.14 | 6.32 | 8.52 | 6.20 |
| Mean absolute error (°C) | 7.76 | 3.97 | 6.20 | 5.16 |
| Root mean square error (°C) | 2.07 | 2.40 | 1.89 | 1.25 |
6. Conclusion
In this work, a digital twin framework of an industrial SO2 conversion unit of four catalytic beds reactors was developed. The proposed digital twin integrates the plant, the virtual system, and the communication part. In the virtual system, Unisim Design R451 simulator was used to model and simulate the studied SO2 conversion unit. For a smooth industrial integration, a graphical interface, inspired by the operator’s graphical displays, was used. The graphical interface makes it possible to visualize the most important parameters obtained by the unit simulation, knowing the outlet temperature, the conversion rate and the pressure drop within the four catalytic bed. Regarding the communication part,
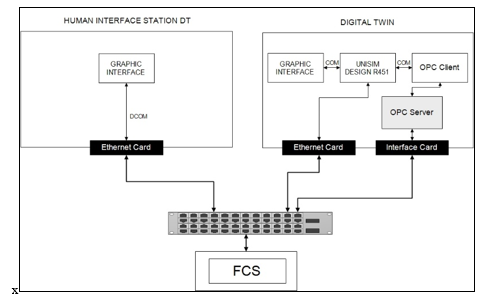 Figure 7: Digital Twin proposed architecture
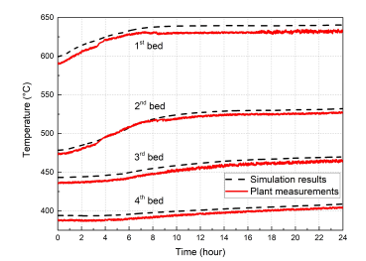 Figure 8: Real-time simulation results of the proposed SO2 conversion unit model
an OPC server is developed to read process real time data. Then an OPC client is used to feed it to the core simulator. The simulation model was tested and validated using data from the studied sulfuric acid plant, and the comparison has shown an accuracy that exceeds 97%. The digital twin will then be used to improve operations and simulate production scenarios for real time optimization and decisions.
In future works, the proposed approach will be combined with suitable control strategies for performance improvement of the studied industrial sulfuric acid plant.
- F. Tao, J. Cheng, Q. Qi, M. Zhang, H. Zhang, F. Sui, “Digital twin-driven product design, manufacturing and service with big data,” International Journal of Advanced Manufacturing Technology, 94(9–12), 3563–3576, 2018, doi:10.1007/s00170-017-0233-1.
- C. Zhuang, J. Liu, H. Xiong, “Digital twin-based smart production management and control framework for the complex product assembly shop-floor,” International Journal of Advanced Manufacturing Technology, 96(1–4), 1149–1163, 2018, doi:10.1007/s00170-018-1617-6.
- T.H.J. Uhlemann, C. Lehmann, R. Steinhilper, “The Digital Twin: Realizing the Cyber-Physical Production System for Industry 4.0,” Procedia CIRP, 61, 335–340, 2017, doi:10.1016/j.procir.2016.11.152.
- G.L. Knapp, T. Mukherjee, J.S. Zuback, H.L. Wei, T.A. Palmer, A. De, T. DebRoy, “Building blocks for a digital twin of additive manufacturing,” Acta Materialia, 135, 390–399, 2017, doi:10.1016/j.actamat.2017.06.039.
- A. Ustundag, E. Cevikcan, Managing The Digital Transformation, 2018.
- E.J. Tuegel, A.R. Ingraffea, T.G. Eason, S.M. Spottswood, “Reengineering aircraft structural life prediction using a digital twin,” International Journal of Aerospace Engineering, 2011, 2011, doi:10.1155/2011/154798.
- Y. Zhou, T. Xing, Y. Song, Y. Li, X. Zhu, G. Li, S. Ding, “Digital-twin-driven geometric optimization of centrifugal impeller with free-form blades for five-axis flank milling,” Journal of Manufacturing Systems, (June), 0–1, 2020, doi:10.1016/j.jmsy.2020.06.019.
- H. Zhang, Q. Liu, X. Chen, D. Zhang, J. Leng, “A Digital Twin-Based Approach for Designing and Multi-Objective Optimization of Hollow Glass Production Line,” IEEE Access, 5, 26901–26911, 2017, doi:10.1109/ACCESS.2017.2766453.
- A.O. Oni, D.A. Fadare, S. Sharma, G.P. Rangaiah, “Multi-objective optimisation of a double contact double absorption sulphuric acid plant for cleaner operation,” Journal of Cleaner Production, 181, 652–662, 2018, doi:10.1016/j.jclepro.2018.01.239.
- R. Günther, J.C. Schöneberger, H. Arellano-Garcia, H. Thielert, G. Wozny, Design and modeling of a new periodical-steady state process for the oxidation of sulfur dioxide in the context of an emission free sulfuric acid plant, 1677–1681, 2012, doi:10.1016/B978-0-444-59506-5.50166-8.
- H. Nouri, A. Ouederni, “Experimental and modeling study of sulfur dioxide oxidation in packed-bed tubular reactor,” International Journal of Innovation and Applied Studies, 3(4), 1045–1052, 2013.
- P.A. Sørensen, M. Møllerhøj, K.A. Christensen, “New dynamic models for simulation of industrial SO2 oxidation reactors and wet gas sulfuric acid plants,” Chemical Engineering Journal, 278, 421–429, 2015, doi:10.1016/j.cej.2014.09.023.
- J. He, J. Zhang, H. Shang, “Dynamic modelling and simulation of the sulphur dioxide converter in an industrial smelter,” Canadian Journal of Chemical Engineering, 97(6), 1838–1847, 2019, doi:10.1002/cjce.23446.
- A. Mounaam, Y. Harmen, Y. Chhiti, A. Souissi, M. Salouhi, M. El Khouakhi, “UniSim-design simulation and analysis of a sulphuric acid manufacturing plant with double absorption process,” SIMULTECH 2020 – Proceedings of the 10th International Conference on Simulation and Modeling Methodologies, Technologies and Applications, (Simultech), 91–100, 2020, doi:10.5220/0009832300910100.
- F. Zaversky, M. Sánchez, D. Astrain, “Object-oriented modeling for the transient response simulation of multi-pass shell-and-tube heat exchangers as applied in active indirect thermal energy storage systems for concentrated solar power,” Energy, 65, 647–664, 2014, doi:10.1016/j.energy.2013.11.070.
- E. Ozden, I. Tari, “Shell side CFD analysis of a small shell-and-tube heat exchanger,” Energy Conversion and Management, 51(5), 1004–1014, 2010, doi:10.1016/j.enconman.2009.12.003.
- J. Janaun, N.H. Kamin, K.H. Wong, H.J. Tham, V. V. Kong, M. Farajpourlar, “Design and simulation of heat exchangers using Aspen HYSYS, and Aspen exchanger design and rating for paddy drying application,” IOP Conference Series: Earth and Environmental Science, 36(1), 2016, doi:10.1088/1755-1315/36/1/012056.
- A. Mounaam, Y. Harmen, Y. Chhiti, A. Souissi, M. Salouhi, K. Benjelloun, M. Elkhouakhi, L. Deshayes, “Dynamic behavior analysis of tubular heat exchanger: Experimental and theoretical study,” 2020 5th International Conference on Renewable Energies for Developing Countries, REDEC 2020, 5, 1–6, 2020, doi:10.1109/REDEC49234.2020.9163862.
- M.J. King, W.G. Davenport, M.S. Moats, Overview, Elsevier, Oxford: 1–9, 2013, doi:10.1016/b978-0-08-098220-5.00001-0.
- M. Yang, X. Wang, Z. Wang, Z. Li, Y. Zhang, “Correlation for turbulent convection heat transfer in elliptical tubes by numerical simulations,” Frontiers in Heat and Mass Transfer, 11, 2018, doi:10.5098/hmt.11.7.
- Y. Matsuda, O. Kawanami, R. Orimo, K. Uete, A. Watanabe, Y. Egami, H. Yamaguchi, T. Niimi, “Simultaneous measurement of gas-liquid interface motion and temperature distribution on heated surface using temperature-sensitive paint,” International Journal of Heat and Mass Transfer, 153, 119567, 2020, doi:10.1016/j.ijheatmasstransfer.2020.119567.
- S. Ebrahim Ghasemi, A. Akbar Ranjbar, “Numerical thermal study on effect of porous rings on performance of solar parabolic trough collector,” Applied Thermal Engineering, 118(April), 807–816, 2017, doi:10.1016/j.applthermaleng.2017.03.021.
- S. Weyer, T. Meyer, M. Ohmer, S. Dominic, T. Meyer, M. Ohmer, S. Dominic, T. Meyer, M. Ohmer, D. Gorecky, “Future Modeling and Simulation of CPS-based Factories: Future Factories: Future Factories: Example from the Automotive Industry Future an Factories: an Example from the Automotive Example from the Automotive an Example from the Automotive Industry,” IFAC PapersOnLine, 49(31), 97–102, 2016, doi:10.1016/j.ifacol.2016.12.168.
- T. Gabor, M. Kiermeier, M.T. Beck, A. Neitz, “A Simulation-Based Architecture for Smart Cyber-Physical Systems.”
- Q. Qi, F.E.I. Tao, S. Member, “Digital Twin and Big Data Towards Smart Manufacturing and Industry 4 . 0: 360 Degree Comparison,” IEEE Access, 6, 3585–3593, 2018, doi:10.1109/ACCESS.2018.2793265.
- V. Souza, S. Member, R. Cruz, W. Silva, S. Lins, V. Lucena, “A Digital Twin Architecture Based on the Industrial Internet of Things Technologies,” 2019 IEEE International Conference on Consumer Electronics (ICCE), 1–2.
- L.F. C. Cimino, E. Negri, “OPC Unified Architecture,” 2009.
- C. Cimino, E. Negri, L. Fumagalli, “Computers in Industry Review of digital twin applications in manufacturing,” Computers in Industry, 113, 103130, 2019, doi:10.1016/j.compind.2019.103130.