
An Analysis of the Reliability of Reported COVID-19 Data in Western Balkan Countries
Volume 6, Issue 2, Page No 1055-1064, 2021
Author’s Name: Eralda Gjika1,a), Lule Basha1, Llukan Puka1,2
View Affiliations
1Department of Applied Mathematics, Faculty of Natural Science, University of Tirana, Tirana, 1001, Albania
2Canadian Institute of Technology (CIT), Tirana, 1001, Albania
a)Author to whom correspondence should be addressed. E-mail: eralda.dhamo@fshn.edu.al
Adv. Sci. Technol. Eng. Syst. J. 6(2), 1055-1064 (2021); ![]() DOI: 10.25046/aj0602120
DOI: 10.25046/aj0602120
Keywords: Probability, COVID-19, Bedford law, Epidemic, Chi-square

Export Citations
More than one year after the outbreak of the COVID-19 pandemic the behavior of figures published by official sources of the countries are skeptical for the public. Many probability tests are used to detect the reliability of information among which Benford’s Law. This study focused on the Western Balkan countries, as one of the foremost regions of South East Europe, where the appearance of COVID-19 was delayed by almost two months compared to the rest of Europe. In our work, we have analyzed the reliability of new cases and deaths figures published daily by official sources. Two study periods are considered separating the two waves of infections in the region. We have used Benford Law as one of the probability laws which has shown effectiveness in detecting possible data incorrectness or lack of information. Statistical tests such as Chi-Square have been used to check the probability adequacy of real data with Benford distribution. The results show a significant fluctuation of the figures from the Benford Law, especially during the first observed period. The study may be used by the policy makers to detect incorrectness or delays in reported number of new cases and/or deaths that have occurred during the COVID-19 pandemic.
Received: 23 February 2021, Accepted: 01 April 2021, Published Online: 28 April 2021
1. Introduction
1.1. Evolution of COVID-19 in Western Balkan Countries
It all started in December 2019 in Wuhan, Hubei Province of China and in January this outbreak was attributed to SARS-CoV-2. On 30 January WHO declares a global public-health emergency and on 11 March declares the outbreak a pandemic. Globally based on the reports of WHO, up to 5 December 2020, there have been 65,007,974 confirmed cases of COVID-19, including 1,507,018 death [1].
In Western Balkan countries the first state which confirmed to been affected by the virus was North Macedonia.Its first case was reported on 26 February 2020, latter on 10 March, the Ministry of Health of North Macedonia implemented more reliable measures to prevent further spreading of the virus, including temporary two-week closure of all education institutes, the prohibition of travelling to the most infected countries and the ban of all public events. In North Macedonia up to 5 December, have been 65,231 confirmed cases of COVID-19 with 1,847 deaths [1]. Current population is 2,083,337 people. Latter on the last week of November, North Macedonia has experienced a sharp increase of new cases arriving at a confirmed number of 2,768 active cases per 100,000 inhabitants and 57,451 cases in total, almost the double from October reported figures. It reported 1,600 deaths [2].
The second country which reported the first case of COVID-19 was Bosnia and Herzegovina on 5 March 2020. On 17 March, a state of emergency in the entire country was declared and from 30 March 2020 all borders were closed for passengers. In Bosnia and Herzegovina, from January 3 to 5 December 2020, have been 91,539 confirmed cases of COVID-19 with 2,812 deaths [1]. Current population is 3,272,109 people. By this date, 432,980 people were tested [3]. In mid-October the situation in Bosnia and Herzegovina significantly worsened displaying an exponential increase in the number of new cases. In mid-November, the number of new cases slowly started being rewarded by recoveries, showing an noticeable stabilization in the growth of active cases. At the end of November the number of confirmed cases was 2,402 cases per 100,000 inhabitants [2].
Serbia was the third country which reported the first case of COVID-19 on 6 March 2020. Latter on 15 March, closed its borders to all foreigners not living in Serbia and schools, faculties and kindergartens were also closed. On 17 March,the country introduced night curfew as a protection measure. As of 5 December 2020 there have been 199,158 confirmed cases of COVID-19 with 1,765 deaths [1]. By that time, 1,844,731 individuals had been tested [3]. Current population is 8,722,302 people which makes Serbia the largest country in Western Balkan. In early September the government declared the epidemiological situation stable and under control with a decreasingtrend observed in new cases. This was a short period because at the end of September and start of October the situation began to worsen with reported number of a total 155,994 registered cases with 1,423 fatalities, and a rate of 123 active cases per 100,000 inhabitants at the end of November [2].
The fourth country, Albania has confirmed the first case of the virus on 8 March 2020. Imediately on 8 March, the country stopped all flights and ferries with quarantined areas of northern Italy until 3 April, halted all schools for two weeks, ordered cancellation of all large public gatherings, and asked sports federations to cancel scheduled matches. On 15 March, Albania closed all of its land borders until further notice, making all travel from Montenegro, Kosovo, North Macedonia, and Greece prohibited. In Albania, up to 5 December have been 41,302 confirmed cases of COVID-19 with 870 deaths. Total number of tests is 194,927 [4]. Current population in Albania is 2,876,446 people.After the summer touristic season the number of new cases in Albania has been steadily growing which forced the governmentto a re-introduction of restrictive measures. During the first part of November the daily rate of new cases surprisingly almost tripled from a minimum of 321 to 836 new cases per day [2].
Only one week later on 13 March, the first two cases were confirmed in Kosovo and on 15 March, the Ministry of Health requested that the Government of Kosovo declare a state of public health emergency. In Kosovo, up to 5 December, have been 41,256 confirmed cases of COVID-19 with 1,052 deaths [1]. Current population in Kosovo is 1,811,377 people. During November the COVID-19 situation significantly aggravated showing a rapidly increase of the new cases reported per day. The same situation as in Albania, was observed also in Kosovo. After a decline through August and September, a rise from 300 up to 715 new cases per day was recorded in the country [2].
Table 1: Population, cases, deaths and tests by country
| Country | Population | Total cases | Total deaths | Tests |
| Albania | 2,876,446 | 41,302 | 870 | 194,927 |
| Kosovo | 1,811,377 | 41,256 | 1,052 | Missing |
| Montenegro | 628,100 | 37,015 | 516 | Missing |
| North Macedonia | 2,083,337 | 65,231 | 1,847 | Missing |
| Serbia | 8,722,302 | 199,158 | 1,765 | 1,844,731 |
| Bosnia and Herzegovina | 3,272,109 | 91,539 | 2,812 | 432,980 |
(Period: up to 5 December 2020)
The last country in Western Balkan and also the last European country to register the first case of COVID-19 was Montenegro on 17 March 2020. From 24 May until 14 June when the first imported case was reported, Montenegro had no active cases. However, by 14th June, Montenegro undergo to a second wave of infections which this time was significantly observed in the evolution of the cases and deaths figures reported. In Montenegro, up to 5 December, have been 37,015 confirmed cases of COVID-19 with 516 deaths. Current population is 628,100 people. During September and October the situation aggravated in the country and on 23 November, the total number of cases reached 31,618 and 11,143 active cases. This figures make Montenegro the second state in Europe with the highest rate of cases about 5,034 total cases per 100 000 people [2].
1.2. Review of literature on COVID-19
Observing the development situation of COVID-19 in the Western Balkan countries with a very close resemblance to developments in economy, social life and demography, we consider that their response to this pandemic will be similar. Therefore, one of the purposes of this paper is to test whether this data reported by these countries leaves room for uncertainty in the rapid and accurate response to daily reporting.
One of the indicators of reliability we have studied is Benford Law (BL) applied in daily reported numbers of new cases and deaths.
It is has been shown in the study of [5, 6], that if random numbers are simulated from an exponential distribution with a parameter λ then they will follow Benford Law. As a result, if we start observing that the curve of epidemic growth in these countries does not seem to follow an exponential distribution than we can start suspect that they do not obey the Benford’s Law.
Starting from March 2020, when the epidemic was confirmed as a pandemic a huge work has been done by many researchers in different countries to study the behavior of this virus through mathematical methods and up to the construction of models to predict the future. In their work [7], discuss on country-based mitigation measures that will influence the course of the COVID-19 epidemic. The reporting process was studied by [8], who observed the number of infections in China, USA and Italy and confirmed that the reported numbers match the distribution expected in Benford’s Law. An epidemic growth model that could capture the intrussion efforts in different countries in order to obtain a better understanding ofthe growth rate for COVID-19 infections was proposed by [9]. In their work they showed that epidemic growths without intervention are likely to satisfy Benford Law. They reported that all countries they took into consideration, except Japan, satisfied this law and indicating the growth rates of COVID-19 were close to an exponential trend. This exponential trend was also observed by [10], in the number of infected patients in Italy. In another study by [11], a digital forensic analysis technique based on Benford’s Law was used to analyze the COVID-19 data for 23 countries and conclude that results from some countries were suspicious of manipulated arranged data.
The reliability of COVID-19 was studied by [12], which also used Benford Law to the total number, new cases and deaths in Russia and found a high possibility of incorrecteness manipulation on reported numbers. In their report [13] found for European countries such as: France, Germany, Spain, UK, Switzerland and Italy that records of cumulative infections and deaths fitted well to the BL and show consistent reporting. Other work on modelling and analysis of COVID-19 has been done also by [14], who provide a toolkit of statistical and mathematical models for analysing the early stages of an outbreak and assessing interventions. A further study [15], looked at an SEIR (susceptible, exposed, infected, and recovered) type of a mathematical model to describe the COVID-19 dynamic in Sri Lanka. A comparison of the COVID-19 events in the Asian countries and studied a new flexible extended Weibull distribution to describe the total death data in the Asian countries was presented by [16].
Another side of analysing COVID-19 was trying to make predictions about the impact of this virus. In their paper [17], lists some main reasons underlying forecasting failure in COVID-19 data. A pandemic time series is a sequence of regular observations observed over time (each day) and it is also an univariate time series, which is considered also as the simplest form of temporal data [18, 19].
Can we have reliable predictions if the data are not reported correctly? If so, what forecasting methodology can be justified for the given numbers? During this period there are enough scientific research articles which have used many forecasting models to predict the evolution of COVID-19 time series. The accuracy of classical, smoothing, advance, machine learning, hybrid and ensemble time series models by analyzing the accuracy of the forecasting models in: USA, Russia, Brazil, India and Peru was presented by [20]. They show that the predicted numbers for Russia are not quite good. Russia is one of the countries where other research authors also have found data incorrectness. The interest for the study of COVID-19 has expanded towards finding the key parameters responsible for outbreak [21, 22].
We are aware that, for many reasons, such as the lack of information on the signs of the virus, the logistics, the ability to provide medical care in the Western Balkans, the figures reported at the early phase of the pandemic may raise obvious doubts.
2. Benford Law
This is an added value of COVID-19 study in many countries around the world. In this study we focused our interest on using Benford Law to investigate whether the epidemic growth model can be affected by errors in reported number of new cases and deaths in Western Balkan countries.
Table 2: Benford’s law distribution of first and second digit.
| Benford distribution | 0 | 1 | 2 | 3 | 4 |
| 1st digit | 0.301 | 0.176 | 0.125 | 0.097 | |
| 2nd digit | 0.1018 | 0.1139 | 0.1088 | 0.1043 | 0.1003 |
| Benford distribution | 5 | 6 | 7 | 8 | 9 |
| 1st digit | 0.079 | 0.067 | 0.058 | 0.051 | 0.046 |
| 2nd digit | 0.0967 | 0.0934 | 0.0904 | 0.0876 | 0.085 |
Benford Law (also known as Law of anomalous numbers) was presented in [23]. This law is the observation that in many collections of numbers from real-life data or mathematical tables, the significant digits are not uniformly distributed; they are heavily skewed toward the smaller digits. Specifically, the significant digits in many real data sets obey a very particular logarithmic distribution where the law for the first significant digit is:
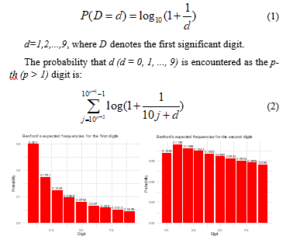
Figure 1: Benford’s expected frequencies for the first and second digits. The values on the vertical axis are the distribution probabilities of digit d as shown on the horizontal axis, where d=1,2,…,9 in first digit graph (left) and d=0,1,2,…,9 in the second digit graph (right)
Among many statistical tests for comparing a random sample with a theoretical probability distribution to analyze the goodness of fit of the reported data we have used the Chi-Square Goodness-of-Fit Test [24]. The objective of the test is to conduct a hypothesis test of matching a theoretical distribution using histogram representation of the data. The null hypothesis is that the random variable corresponding to the sample variable follows the theoretical distribution (using the parameter estimates). The null hypothesis is rejected if the test statistic: .
In our situation the null hypothesis and the alternative hypothesis are as below:
Chi-Square statistics is used as a measure of the divergence between the observed data and theoretical Benford distribution. A value of the Chi-Square statistic greater than the critical value yields to hypothesis H1. A value of the Chi-Square statistics less than the critical value, yields to the null hypothesis and conclude that the data follow the Benford distribution. Anderson-Darling and Kolmogorov-Smirnov goodness-of-fit tests are an alternate of the chi-square test, but are restricted to continuous distributions. We choose to use chi-square goodness-of-fit test in our data because it can be applied to multinomial distributions. The conditions of expected frequency to be at least 5 for approximation by the chi-square test are valid.
In his paper [25], suggest that the probability distributions of the data fluctuate around Benford distributions but in the view of Blondeau there is an upper bound which enables to find a better adjusted law compared with Benford’s one. We have used the BeyondBenford package in the R statistical environment which enables to compare the goodness of fit of Benford’s and Blondeau Da Silva’s [24] digit distributions in a given dataset using as a measure of accuracy the Pearson Chi-Squared test. Through this package we first draw the histograms of digit frequencies and the prediction confidence intervals.
3. Empirical analysis
3.1. Data
The confirmed COVID-19 data of new cases and deaths used in this analysis are publicly available from the European Center for Disease Prevention and Control [26]. The database contains information about the daily number of confirmed COVID-19 daily new cases and confirmed daily deaths in various countries worldwide. The reported data have different durations in time as different countries were affected by the pandemic in different periods. We must emphasize that the data after 14 December are made public only on weekly basis from this source.
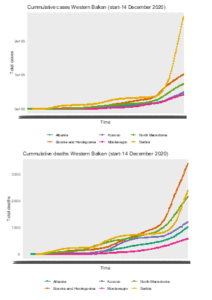
Figure 2: Cumulative new cases and deaths reported in Western Balkan countries (from start up to 14 December 2020)
As observed from Figure 2 above the epidemic growths in some of the countries naturally follow an exponential family distribution which may be a suspicious that the data may follow Benford Law [9]. The new cases time series for Serbia show a rapid increase in the figures especially after September 2020. The same is also observed for the deaths in Serbia and Bosnia and Herzegovina.
Below is the evolution of the new cases for each country from the first reported case (which differs from one country to another) up to 14 December 2020.
Epidemic outbreaks of COVID-19 in many countries of the world show a rapid increase and a more smooth decrease in the daily number of new cases. A reason for this behavior may be the fact that most lockdowns are enforced promptly, whereas lockdown measures instructed by governments have been absorbed gradually by individuals.
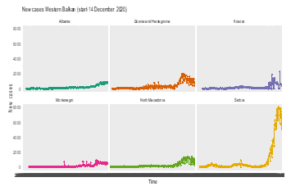
Figure 3: New cases reported in Western Balkan (start-14 December 2020)
In Albania the situation of COVID-19 was felt from the end of February, but the alarm was given in 9 March 2020 and was followed by a long quarantine till the beginning of June. The situation advanced until the middle of October where the situation moves up to 289 new reporter cases. The numbers are evolving rapidly for the country.
For Kosovo the beginning of the COVID-19 pandemic was similar to Albania. The situation changed for Kosovo in the start of the touristic season which enables a large number of Kosovo residents to visit Albania for their summer vacations. This period was a fluctuating period for the country and then it start to fall down until the middle of October.
In Bosnia and Herzegovina the number of new cases started to be public in the first part of March and the situation was under control for the government till the beginning of July when the authorities opened the border for the touristic season. The new cases reported by the authorities in Montenegro seem to have been “frozen” for some months giving reasons to doubt for with holding information on new cases.
North Macedonia was another Western Balkan country which has a delay in the first cases reported with COVID-19. The situation in the country was under control with a low declared number until the start of the touristic season. The tourists from North Macedonia focus their attention on Albania and Greece, increasing in this way the risk of spreading the virus. Greece was the country which closed the borders with the neighbor countries for the summer period trying to slow down the spread. The situation in Serbia was different than in other Western Balkan countries. It seems to have a 3 month seasonal pattern with peak in April and July.
The evolution of number of deaths per day reported by the authorities in the Western Balkan countries are shown in figure 4.
What is clearly observed is the fact that for Albania the figures are not changing, they are in the interval of 0 to 6 deaths per day. Kosovo has a peak of number of deaths from COVID-19 in August and a drop in figures to October. Bosnia and Herzegovina have had the maximum number of deaths in August (23 deaths) and have shown a weekly seasonality from then. Montenegro number of deaths range in the interval 0 to 13 and are showing stability. The number of deaths in North Macedonia has a seasonal pattern which is also observed in Serbia. Even that the figures are low we may see a presence of an increased trend during the winter.
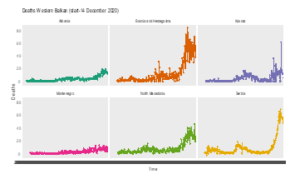
Figure 4: Deaths reported in Western Balkan (start-14 December 2020)
3.2. Time periods of study
Some studies on COVID-19 spread have tried to achieve at conclusions and presented attempts to model the reported numbers but most of these studies concentrate their attention on the initial phase of the COVID-19 which by the way do not offer enough data. In our analysis we choose to end the first period in 13 October where the new wave was still not clearly observed in Western Balkan countries. And then we enlarged the data up to 14 December which was almost 2 months after the second wave has begun to show in the region.
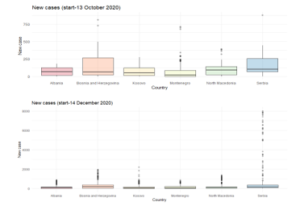
Figure 5: Boxplot of new cases for the two periods in Western Balkan countries
Period 1: 26 February up to 13 October 2020. The first wave of COVID-19 infections and the start (not included) of the second wave in Western Balkan countries.
Period 2: 26 February up to 14 December 2020. It includes the two waves of COVID-19 infections in Western Balkan countries.
To achieve a better view of the situation and start analyzing the reported data we analyze first the box plot of every country on each period for new cases and deaths.
Observing carefully the two periods we notice that in the first period the distribution situation was mostly stable in all countries except Bosnia and Herzegovina, Montenegro and Serbia which have presence of some significant outliers. The situation in the second period seems to change significantly, now the extreme values presence situation is clearer in countries such as Serbia (the country with the highest population in Western Balkan countries). Presence of extreme values is also observed in Bosnia and Herzegovina, and Kosovo. (Figure 5 and Figure 6)
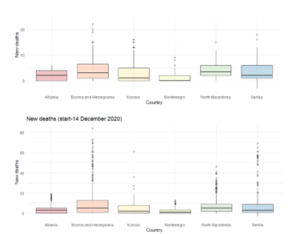
Figure 6: Boxplot of deaths for the two periods in Western Balkan countries
In the first period most of the countries experienced low numbers of deaths per day. Some days with high reported values are observed for Bosnia and Herzegovina Kosovo, Serbia, Montenegro. Albania seems to have a stable reported number of daily deaths which in this period was not higher than 7 deaths a day. When the second wave of the pandemic swept through the Western Balkans, there was an immediate increase in the number of reported daily deaths. Here, as in the reported cases, there was observed an increase in the number of reported deaths but also the presence of the extreme values displayed clearly as outliers. Among those states which show a considerable number of the outliers are Bosnia and Herzegovina, North Macedonia and Serbia.
4. Results
For the data analysis procedure we have used the BeyondBenford package in R statistical environment. This enables to compare the goodness of fit of Benford’s and Blondeau Da Silva’s digit distributions in a given dataset using as a measure of accuracy the Pearson Chi-Squared test. Through this package we first draw the histograms of digit frequencies and the prediction confidence intervals for every country and variables taken into consideration: new cases and deaths per day.
In their work with the data (up to June 2020), [9] found that in countries where the precautions and interventions were made to control the expansion of the COVID-19 pandemic the reported data satisfied Benford Law. Based on this result and considering the fact that all the Western Balkan countries took measures until quarantine (period that ended in early June) we studied the reported data if they should satisfied Benford Law.
Figure 7 (a) show the histograms of new cases for the two periods. Benford and Blondeau theoretical distribution histograms are plotted together with the empirical distribution of the variable new cases in each country.
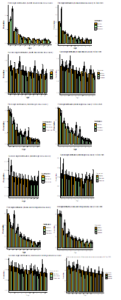
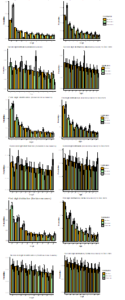
Figure 7: (a) Number of new COVID-19 cases (Histogram of the observed new cases; first digit and second digit of Benford and Blondeau law)
From Figure 7(a) we observe that Albanian and North Macedonia new cases numbers seems to not display an exponential family distribution and the situation of first digit distribution also does not display a Benford distribution, which is confirmed again for the second digit in the two periods. We may attribute this to the delay on the publications of new cases for Albania. But it has also some numbers at the level of 140-160 new cases per day which seem to not obey the Benford distribution.
Kosovo and Serbia are the two countries which seem to naturally follow the Benford Law for the first digit in the two periods. Kosovo faced the situation of COVID-19 at the beginning of March. Forced measures and further quarantine delayed the spread of the pandemic in the country. It is observed that in the two periods of investigation the distribution for the first digit is not showing a good fitting with the theoretical distribution of Benford and Blondeau. For the second digit in both periods as well we observe some deviations from BL for Albania, Kosovo, North Macedonia and Montenegro. Serbia and Bosnia and Herzegovina seems to overcome with the additional information from the second period.
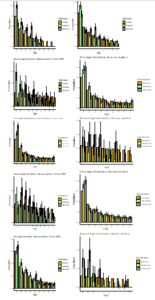
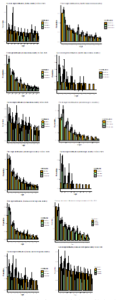
Figure 7 (b): Number of COVID-19 deaths (Histogram of the observed new cases;first digit and second digit of Benford and Blondeau law)
Regarding to the number of deaths per day during the first period, this number was not higher than 10 for all the countries, so for those countries the second digit histogram and also Chi-Square test are not obtained. (Figure 7.b)
Kosovo and Serbia are the countries which seem to naturally follow the Benford Law for first digit of daily deaths for both periods but they don’t show a significant fitting for the second digit in either the two periods. Albania seems to deviate significantly form BL especially with the addition of the information during the second period. Montenegro first digits of daily deaths obey to the Benford Law especially for the second period and a display a clear deviation for the second digit in the second period.
For Bosnia and Herzegovina the second period seems to have gained an adjustment for the first and second digit of daily deaths. North Macedonia histograms for the first digit in both periods seem to obey to BL but this is not observed in the second period. Special case was observed for the number of deaths is Montenegro for the second period where the number of deaths seem to be lower than 15 a day.
Table 3 shows the results obtained from the Chi-Square test for every country and separately for new cases and deaths reported daily. The output also shows the Chi-Square statistics and the p-value of the test. With a p-value < 0.05 we can reject the null hypothesis (H0: the data obey to Benford Law).The results are summarized in Table 3, 4, 5 and 6 for new cases and deaths for the two periods.
Table 3: Chi –square test- New cases (13 October 2020)
| Country | Albania | Kosovo | Serbia | |
| Benford 1st | Chi2 value | 78.9655 | 8.7085 | 18.5456 |
| p-value | 7.89E-14 | 0.3674 | 0.0174 | |
| Blondau 1st | Chi2 value | 78.6334 | 13.503 | 22.5378 |
| p-value | 9.20E-14 | 0.0956 | 0.004 | |
| Benford 2nd | Chi2 value | 23.1188 | 11.1811 | 2.6017 |
| p-value | 0.0059 | 0.2634 | 0.978 | |
| Blondau 2nd | Chi2 value | 22.9886 | 11.9459 | 3.0264 |
| p-value | 0.0062 | 0.2163 | 0.9632 | |
| Country | Montenegro | North Macedonia | Bosnia and Herzegovina | |
| Benford 1st | Chi2 value | 12.9277 | 50.1332 | 40.357 |
| p-value | 0.1143 | 3.85E-08 | 2.75E-06 | |
| Blondau 1st | Chi2 value | 18.7915 | 25.7993 | 27.4978 |
| p-value | 0.016 | 0.0011 | 0.0005 | |
| Benford 2nd | Chi2 value | 6.5409 | 9.1211 | 5.2124 |
| p-value | 0.6847 | 0.4261 | 0.8154 | |
| Blondau 2nd | Chi2 value | 6.7981 | 10.1442 | 4.8076 |
| p-value | 0.6581 | 0.3389 | 0.8507 | |
Table 4: Chi –square test- Deaths (13 October 2020)
| Country | Albania | Kosovo | Serbia | |
| Benford 1st | Chi2 value | 47.1347 | 12.3892 | 13.3452 |
| p-value | 1.45E-07 | 0.1346 | 0.1005 | |
| Blondau1st | Chi2 value | No appl | No appl | 4.3461 |
| p-value | 0.8246 | |||
| Country | Montenegro | North Macedonia | Bosnia and Herzegovina | |
| Benford 1st | Chi2 value | * No appl | 13.3542 | 16.0589 |
| p-value | 0.1002 | 0.0415 | ||
| Blondau1st | Chi2 value | * No appl | 15.382 | 21.0859 |
| p-value | 0.0521 | 0.0069 | ||
Table 5: Chi –square test- New cases (14 December 2020)
| Country | Albania | Kosovo | Serbia | |
| Benford 1st | Chi2 value | 41.2998 | 23.59759 | 28.309511 |
| p-value | 1.83E-06 | 0.00267 | 0.00041 | |
| Blondau 1st | Chi2 value | 80.9053 | 34.15665 | 41.0727 |
| p-value | 3.20E-14 | 3.80E-05 | 2.02E-06 | |
| Benford 2nd | Chi2 value | 11.5468 | 11.0476 | 1.95418 |
| p-value | 0.24 | 0.2724 | 0.99217 | |
| Blondau 2nd | Chi2 value | 11.6199 | 10.4599 | 1.3307 |
| p-value | 0.2355 | 0.3145 | 0.9982 | |
| Country | Montenegro | North Macedonia | Bosnia and Herzegovina | |
| Benford 1st | Chi2 value | 36.98586 | 49.95038 | 14.07918 |
| p-value | 1.15E-05 | 4.17E-08 | 0.0797 | |
| Blondau 1st | Chi2 value | 25.6556 | 83.38514 | 35.4388 |
| p-value | 0.0012 | 1.01E-14 | 2.22E-05 | |
| Benford 2nd | Chi2 value | 11.515 | 10.9355 | 4.361 |
| p-value | 0.2419 | 0.2801 | 0.886 | |
| Blondau 2nd | Chi2 value | 11.9694 | * No appl | 5.23 |
| p-value | 0.215 | 0.813 | ||
Table 6: Chi –square test- Deaths (14 December 2020)
| Country | Albania | Kosovo | Serbia | |
| Benford 1st | Chi2 value | 27.564 | 33.84 | 12.587 |
| p-value | 0.0005 | 4.34E-05 | 0.126 | |
| Blondau 1st | Chi2 value | 36.16943 | 20.70284 | 23.083 |
| p-value | 1.63E-05 | 0.0079 | 0.00325 | |
| Country | Montenegro | North Macedonia | Bosnia and Herzegovina | |
| Bedford1st | Chi2 value | 1.861 | 9.05 | 21.227 |
| p-value | 0.984 | 0.338 | 0.006 | |
| Blondau 1st | Chi2 value | 1.343 | 31.49404 | 18.8603 |
| p-value | 0.995 | 0.00011 | 0.0156 | |
Table 3 up to 6 shows the value of the Chi-Squared test and p-value for the countries. A p-value<0.05 indicate the observed values do not confirm the theoretical values of Benford Law. The p-values for new cases reported are lower than 0.05 which is an argument for rejecting the null hypothesis; the reported data do not follow the Benford Law probability distribution for the first and second digit.
The same situation is observed from the histogram of the first and second digit and the results of the Chi-squared test for the reported number of deaths. The chi-squared test gives a Chi-square value of approximately 47 and a p-value lower than 0.05 regarding the Benford Law but it does not give a result of the confidence interval proposed by Blondeau.
5. Conclusions
The study presents an overview of the Benford probability distributions in the COVID-19 reported figures for Western Balkan countries (which are not part of the European Union). During the situation of quarantine (which for many countries of WB was the beginning of March to the end of May) and post quarantine, the authorities of each country were not able to do many tests per day. This and also the rules imposed by governments and the closure of a considerable part of public activities may have lead to low reported numbers during this period. Perhaps the onset of the pandemic frightened the Western Balkan, and they hid the timely reporting of new cases and deaths. They were faced with a lack of experience dealing with pandemic situations and unprepared for recording and reporting real-time figures.
Other factors that may have affected the reporting process during the first wave may also be the lack of a culture of the population to report cases and conduct tests. The middle-low economic level in these countries is another factor that affects the number of tests which directly affects the detection of the number of people diagnosed with COVID-19. Also, lack of the condition in hospitalization made that many COVID-19 patients were going to get medication at home. Advices of government representative to stay home and take precautions from their GP (family doctor) because even that hospital staff are doing their best, but hospitals will likely be overwhelmed by COVID-19 aggravated patients which need more professional services and medical equipment’s. Events reported by COVID-19 hospitals of persons who have attempted suicide, may be another cause of persons who neglect to be diagnosed, by this way many of them have preferred to be cured at home and are not reported.
Summer touristic season was another factor that has affected the reported number of new cases and deaths in the first period. Especially for the coastal countries, the reported number may have been intervened to help the touristic season especially those businesses in the country which have been highly affected after quarantine.
For some of the states it is noticed that Benford Law is not applied. Here another reason may be the small number of daily reports in both periods under consideration (during the first period the number of deaths ranged from 0-6 and during the second period from 0 to 13).
Almost all Western Balkan countries have reported a high number of COVID-19 cases during November 2020, but they alter the speed of reported numbers.
The study may be used by the policy makers to detect incorrectness or delays in reported number of new cases and/or deaths that have occurred during the COVID-19 pandemic. Hence, in most cases the results of divergence with Benford’s Law should not be interpreted as a reliable indicator of incorrectness in the pandemic declared figures. The histogram diagnosis and the statistical test results, show that the expansion of the study period in most cases did not affect the quality of the compliance with Benford Law. On the contrary, the increase of information in the second period has increased the level of unreliability to these data.
- World Health Organization. Coronavirus Disease (COVID-19) Dashboard. 2020. https://covid19.who.int/; https://covid19.who.int/table. Accessed 14 December 2020.
- Organisation for Economic Co-operation and Development. COVID-19 response in East South Europe. 2020. https://www.oecd.org/south-east-europe/. Accessed 14 December 2020
- Statista. Number of coronavirus (COVID-19) cases in Bosnia and Herzegovina, Serbia. 2020. https://www.statista.com/statistics/1129313/bosnia-and-herzegovina-covid-19-cases/https://www.statista.com/statistics/1104318/serbia-coronavirus-cases/. Accessed 14 December 2020
- Ministry of Health, Albania. Daily communications for COVID-19. (2020) https://shendetesia.gov.al/komunikimi-i-perditshem-per-koronavirusin/. Accessed 14 December 2020
- S. J. Miller, “Benford’s law,” Princeton University Press, Princeton and Oxford, 2015, 438. 978-0-691-14761-1.
- D. Ni, Z. Ren,” Benford’s law and half-lives of unstable nuclei,” The European Physical Journal A, 38, 251–255, 2008, doi: 10.1140/epja/i2008-10680-8
- R . M. Anderson, H. Heesterbeek, D. Klinkenberg, T. D. Hollingsworth, “How will country based mitigation measures influence the course of the COVID-19 epidemic?,” The Lancet, 395, 931-934, 2020. https://www.thelancet.com/journals/lancet/article/PIIS0140-6736(20)30567-5/fulltext.
- C. Koch, K. Okamura, “Benford’s Law and COVID-19 reporting,” Economics Letters, 196, 109573, 2020 doi: 10.1016/j.econlet.2020.109573
- K. B. Lee, S. Han, Y. Jeong, “COVID-19, flattening the curve, and Benford’s law,” Physica A: Statistical Mechanics and its Applications, 559, 125090, 2020, doi: 10.1016/j.physa.2020.125090
- A. Remuzzi, G. Remuzzi, “COVID-19 and Italy: what next?,” The Lancet, 395, 1225-1228, 2020, doi:10.1016/S0140-6736(20)30627-9
- R. Isea, “How Valid are the Reported Cases of People Infected with Covid-19 in the World?,” International Journal of Coronaviruses, 1(2), 53-56, 2020, doi: 10.14302/issn.2692-1537.ijcv-20-3376.
- A. Wei, A. E. Vellwock, “Is COVID-19 data reliable? A statistical analysis with Benford’s Law,” Published Researchgate, 2020, doi: 10.13140/RG.2.2.31321.75365/1
- M. Sambridge, A. Jackson, “National COVID numbers — Benford’s law looks for errors,” Nature, 581(7809), 384, 26 May 2020, doi: 10.1038/d41586-020-01565-5
- C. Overton, H. Stage, S. Ahmad, et al., “Using statistics and mathematical modelling to understand infectious disease outbreaks: COVID-19 as an example,” Infectious Disease Modelling, 5, 409-441, 2020, doi: 10.1016/j.idm.2020.06.008
- W. P. T. M. Wickramaarachchi, S. S. N. Perera, S. Jayasinghe, “COVID-19 Epidemic in Sri Lanka: A Mathematical and Computational Modelling Approach to Control,”. Computational and Mathematical Methods in Medicine, 2020, doi: 10.1155/2020/4045064
- M. Zuo, S. Khosa, Z. Ahmad, Z. Almaspoor, “Comparison of COVID-19 Pandemic Dynamics in Asian Countries with Statistical Modeling,” Computational and Mathematical Methods in Medicine, 2020, doi: 10.1155/2020/4296806
- J.P.A. Ioannidis, S. Cripps, M. A. Tanner, “Forecasting for COVID-19 has failed,” International Journal of Forecasting, 25 August 2020, doi: 10.1016/j.ijforecast.2020.08.004.
- E. G. Box, M. G. Jenkins, C. G. Reinsel, M. G. Ljung, “Time series analysis: forecasting and control,” John Wiley & Sons, ISBN: 978-1-118-67502-1, 2015, doi: 10.1111/jtsa.12194
- Ch. Chatfield, “The analysis of time series: an introduction,”. Chapman and Hall/CRC. 2016, ISBN: 0203491688, 9780203491683.
- T. Chakraborty, I. Ghosh, T. Mahajan, T. Arora, “Nowcasting of COVID-19 confirmed cases: Foundations, trends, and challenges,”. arXiv: Populations and Evolution, 10 October 2020, https://arxiv.org/abs/2010.05079
- R. Giri A. Kumar, M. Saini, R. K. Sharma, “Living with the virus: Infection and epidemiology of COVID 19 in hotspot area of India,”. Journal of Public Affairs, 22 February 2021. doi: 10.1002/PA.2651
- A. Kumar, D. Sinwar, M. Saini, “Study of several key parameters responsible for COVID-19 outbreak using multiple regression analysis and multi-layer feed forward neural network,” Journal of Interdisciplinary Mathematics, 24(1), 53-75, 2021, doi: 10.1080/09720502.2020.1833443
- F. Benford “The Law of Anomalous Numbers,” In the Proceedings of the American Philosophical Society, 78(4), 551–572. 1938, www.jstor.org/stable/984802
- G. W. Snedecor, W. G. Cochran, “Statistical Methods”. 8th Edition, Iowa State University Press, Ames. 1989, doi: 10.3102/10769986019003304
- S. B. Da Silva, “Benford or Not Benford: A Systematic But Not Always Well-Founded Use of an Elegant Law in Experimental Fields,” Communications in Mathematics and Statistics, 8, 167–201, 2019, doi:10.1007/s40304-018-00172-1
- European Centre for Disease Prevention and Control, ECDC publications COVID-19 cases. https://www.ecdc.europa.eu/en/publications-data/download-todays-data-geographic-distribution-covid-19-cases-worldwide. Accessed 14 December 2020.