A Review of Plastic Waste Management Practices: What Can South Africa Learn?
 , Edison Muzenda 1, 2, Mohamed Belaid 1, Tirivaviri A. Mamvura 2, Trust Nhubu 1
Adv. Sci. Technol. Eng. Syst. J. 6(2), 1013–1028 (2021);
 DOI: 10.25046/aj0602116
Municipal Solid Waste (MSW) is composed of items that are discarded or disposed of daily including paper, plastics, glass, metals, used gadgets, paint and old furniture. The plastic waste stream has proven to be problematic to manage sustainably on a global scale. Various researchers are trying to come up with innovative ways of alleviating the detrimental effects of plastic on the environment. Examples include the production of liquid fuel and synthetic gas through pyrolysis and gasification of plastic waste, use of microbial strains that can break down polyethylene, manufacture of plastic-infused tar, use of plastic waste in cement and concrete as well as its use in the manufacture of bricks. Conducting public awareness and outreach programmes has also been found to be beneficial in reducing plastic littering. This paper reviews South Africa’s strengths, weaknesses, and opportunities in plastic waste management as well as lessons from other jurisdictions that can be adopted in South Africa making it a role model for Africa with regards to plastic waste management. There exists an untapped opportunity for improvement of post-consumer plastic recycling rates to levels comparable to other recyclables in the country through compulsory separation of waste at source. Hence an enabling environment should be created to encourage this practice. Since this will require a fully functional waste management infrastructure, collection services should expand to cover rural areas and informal settlements while industries can assist municipalities to upgrade infrastructure through the extended producer responsibility (EPR) scheme. In addition, there is potential for more jobs to be created in the waste sector through recycling as compared to landfilling, thus urgent attention is needed to divert 100% waste from the landfill. Finally, the integration of informal waste pickers into the waste management chain should be prioritised.
1. Introduction
This paper is an extension of work originally reported in Proceedings of the 7th International Renewable and Sustainable Energy Conference and assesses plastic waste management implemented in Belgium, Australia, South Korea and Canada against that implemented in South Africa. Belgium and South Korea could potentially become the gold standards for South Africa to follow while Australia and Canada have a wealth of information and a clearly laid out vision of the direction the countries intend to take in fighting plastic pollution. Mini descriptive reviews of studies highlighting current plastic waste management practices as well as EPR studies from various countries have also been conducted. The aim of the paper is to determine the lessons that South Africa can learn as we navigate the path to zero waste in line with circular economy principles. MSW, loosely termed garbage is composed of items that are discarded or disposed of daily including paper, plastics, glass, metals, used gadgets, paint and old furniture [1-3]. Waste is defined as any item that has reached the end of its usefulness and needs to be discarded [4]. MSW is generated from households, institutions (e.g. schools), businesses and non-hazardous waste from industries [2, 3] evidencing a “resource-intensive” lifestyle by consumers [5]. The management of MSW is critical because unmanaged waste is an eyesore, can be a breeding ground for disease-causing organisms, can block water drains and sewer networks leading to flooding episodes as well as cause damage to the marine environment and animals [3, 4, 6, 7]. The characteristics or composition and quantity of MSW vary between communities and countries [3,8]. Consequently, waste management practices employed within the different communities and countries will also differ. Figure 1 shows the various fundamental stages involved in waste management.
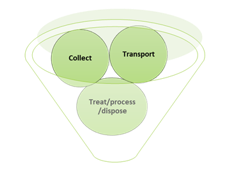
Figure 1: Stages in Waste Management [3, 9]
The plastic waste stream has proven to be problematic to manage sustainably on a global scale. In Sub Saharan Africa, plastic waste constitutes 13% of the total MSW [5, 7].
In an earlier study, [7] highlighted leakages of small plastic items unnoticeably into the environment post-consumer use in South Africa. This is rampant in areas where there are no systems in place to collect them [7]. Albeit small, their continuous accumulation in the environment poses danger to animals as well as humans [7] in the short to long term.
To put this into perspective using bread tags as an example, the annual bread consumption in South Africa with a population of 59.7 million [10] is reportedly 25.8 kgs per capita [11] implying that over a billion tags weighing 300 tonnes are used yearly. Dedicated collection points for bread tags will go a long way in preventing such leakages. The Bread Tags for Wheelchairs an initiative started in 2006 by Mary Honeybun in South Africa, collects bread tags and sells to recyclers in order to buy wheelchairs from the proceeds. Approximately 600,000 tags weighing 200 kgs are used to purchase one wheelchair [12]. Therefore, 300 tonnes worth of tags would result in approximately 1 500 wheelchairs annually, Figure 2.
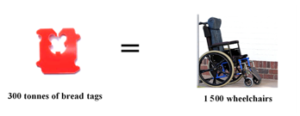
Figure 2: Number of Wheelchairs Expected Annually from Sale of Bread Tags
Various researchers are trying to come up with innovative ways of alleviating the detrimental effects of plastic waste on the environment. Examples include the production of liquid fuel and synthetic gas through pyrolysis and gasification, respectively of plastic waste [13-16], use of microbial strains that can break down polyethylene [17], manufacture of plastic-infused tar [18], use of plastic waste in cement [19] and concrete [20] as well as its use in the manufacture of bricks [21].
Conducting public awareness and outreach programmes has also been found to be beneficial in reducing plastic waste littering [22]. In 2013, the authors in [23] advocated for plastic waste to be considered hazardous unlike the current status quo where plastic waste falls under solid waste. The authors argue that if this is undertaken, countries would be compelled to put more effort in finding ways to mitigate plastic waste leakage as well as finding replacements for single use plastics (SUPs).
2. Data Sources
Data for this study was gathered from peer reviewed journals and grey literature. Authors’ observations are also included. Some of the academic databases accessed include Google Scholar, Web of Science, Scopus, Science Direct and Springer Link with studies undertaken between 2010 and 2021 considered. Phrases and key words used to acquire relevant literature include plastic waste management practices, separation at source, waste collection, and extended producer responsibility which were either used singly or in combination. Quotation marks “” were also used to restrict the literature pool.
3. Review of Waste Management Practices
In 2015, the authors in [24] conducted a study to assess innovations in plastic waste management in Kenya. The author found out that; there were no incentives for innovators, recycling guidelines were lacking and working conditions were poor. With regards to plastic waste management practices, landfilling, illegal dumping and littering were prevalent in the country. The authors recommended the drafting of a plastic recycling framework by all stakeholders including those in the informal sector. This framework would include compulsory recycling targets, guidelines on quality of plastic products and training of informal sector workers.
In 2017, the authors in [25] assessed the management of plastic waste in Bangladesh with the aim of recommending the best way forward. The authors noted that hindrances to effective plastic waste management in the country included poor infrastructure, lack of recycling technologies and inadequate funds to advance waste management services. In addition, recycling and reuse were found to be minimal; with only 20% plastic waste collected while landfilling, open and indiscriminate dumping were the predominant disposal methods. They recommended the use of alternative plastic waste management technologies such as pyrolysis, bitumen production and use of plastic waste as solid refuse fuel in cement kilns in addition to recycling.
In the same year of 2017, the authors in [26] assessed current solid waste management practices and policies in Malaysia. Their findings were that there was limited separation of waste at source in the country hence poor recycling. In addition, the authors noted the lack of commitment by the public to participate in the initiative as well as the unavailability of accurate documented data. Open dumping and landfills were observed to be prevalent with 95% of waste being disposed of through these methods and the balance being recycled/treated or illegally dumped. In [26], the authors recommended; regularisation of informal waste pickers, updating of waste management policies and mandatory separation of waste at source to increase recycling rates and reduce illegal dumping incidences.
In 2018, the authors in [27] conducted a sustainability impact assessment of three scenarios for plastic waste management in Sweden. According to the authors, the country’s dependence on incineration hampers recycling efforts. Plastic waste is also not prioritised in the different waste management policies of the country. The authors concluded that increasing recycling rates and phasing out incineration will be the most sustainable pathway to manage plastic waste in the country.
A study in Austria on plastic packaging waste management conducted in 2018, found that in the year 2013:
- 300,000 ± 3% tonnes of packaging waste was produced at 35 kg per capita,
- recycling rate was 26% ± 7%,
- use of plastic packaging waste in the cement industry was 32% ± 6% and,
- waste to energy plants (WtE) used 40% ± 3% packaging waste [28].
The authors recommended that recycling rates should be calculated using the output rate and not the recycling input rate to improve accuracy of results.
In 2019, the authors in [29] reviewed plastic waste management strategies in Nigeria and concluded that lack of funds and mismanagement of this limited resource and poor infrastructure hampered waste management in the country. Furthermore, over 50% of generated plastic wastes are either indiscriminately dumped or in drains and waterways. The authors recommended; educating the public on separation of waste at source; institution of fines for unsorted waste, setting up of collection centres, WtE plants, and establishing frameworks that enhance sufficient record keeping.
In the same year of 2019, a study in Singapore was conducted to determine the best environmentally performing plastic waste management scenario [30]. The author highlighted the dominance of WtE plants in the country due to shortage of space for landfilling. WtE plants result in a reduction in volume of waste by 90%. Approximately 634 kWh of energy is released from a tonne of mixed plastic waste. Residues (fly and bottom ash) from WtE plants are landfilled offshore. In addition, recycling is minimal in the country. In [30], the author recommended the use of pyrolysis in addition to WtE plants and mechanical recycling.
In [31], the author assessed plastic waste management practices in the United Kingdom (UK). According to the study’s findings, of the 3.3 million tonnes of plastic waste produced in 2013, 2.26 million tonnes was packaging. The author also highlighted the need for attention to be directed to other plastics such as nurdles, synthetic fibres and microbeads and not only on plastic waste packaging. The commonly practiced waste management methods in UK are WtE plants followed by recycling and landfilling while some waste is also exported. Some of the recommendations given based on findings included enforcement of bans on fishing residues, enforcement of Operation Clean Sweep to prevent leakages of nurdles, extending ban of microbeads to all products and installation of sand filters in wastewater treatment facilities for the removal of plastic fibres.
In [32], the authors also conducted a 2020 study to assess plastic waste management practices in the Kingdom of Eswatini rural households. The amount of plastic waste generated per household was found to be 15.9 g/day. Common practices employed to manage waste were open burning, burying, indiscriminate dumping, use of pits at the backyard, reuse, upcycling, and recycling. The authors suggested the roll out of waste collection services in rural areas as well as educating consumers on plastic pollution effects and various ways of managing plastic waste sustainably.
In 2020, the authors in [33] assessed plastic packaging waste management in South Korea. Three million tonnes of plastic packaging waste were generated. The packaging waste was managed as follows; use as solid refuse fuel (39.3%), incineration without energy recovery (33.4%), recycling (13%) and the balance landfilled. The authors noted that only 22.3% of plastic packaging waste was under the EPR scheme and therefore they advocated for the list of plastic items covered by EPR to be expanded to reduce plastic pollution.
In 2021, the authors in [34] investigated SUP waste management in Hanoi, Vietnam and described the secondary use of plastic shopping bags as bin liners after single use. In addition, although plastic bags should be taxed, implementation is lacking. Landfilling was found to be prevalent while recycling is limited. According to the authors, there are gaps in drafted waste management policies which need to be addressed.
Waste management practices from five countries namely, Belgium (Europe), Australia, South Korea (Asia), Canada (North America) and South Africa (Africa) were also studied in this paper and these are highlighted in the ensuing sections.
3.1. Europe
Many countries in the European Union (EU) are trying to avoid landfilling, simultaneously improving their recycling rates of plastic waste. The EU must be admired for its unified approach as a region in trying to address waste challenges although countries like Malta, Greece, Romania and Cyprus still have a long way to go in reducing their rates of landfilled plastic waste from the current 70-80%. In Europe, a recycling fund is included on purchases which is subsequently reimbursed on returning bottles. This compels the public to recycle. Denmark, Germany, Austria, Sweden and Belgium have the lowest disposal rates; with less than 3% of MSW generated heading to landfills, Figure 3 [35-37].
Compared to the 50% target of recycled household waste by 2020, as outlined in the Waste Framework Directive of 2008, these 5 countries have indeed set the bar extremely high for other countries in the region. From the beginning of 2006 to 2016, the amount of plastic waste recycled in the region increased by 79%, an increase of 61% was observed for energy production while plastic waste landfilling decreased by 43%. During the same period, the recycling of plastic packaging increased by nearly 75% [36].
Extended Producer Responsibility, where manufacturers of products are responsible for their products throughout their entire life cycles [7, 38] is another scheme that is being advocated for within the European Union [35].
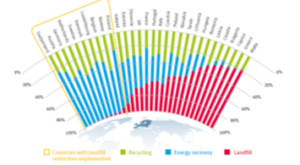
Figure 3: Recycling, Landfilling and Energy Recovery rates in Europe, 2016 [36, 37]
3.1.1 Belgium’s Case
Belgium has a population of 11.6 million [39] and is comprised of three regions; namely Brussels Capital Region, Flanders and Wallonia. The enactment of Article 11(2), of the Waste Directive of 2008 has been instrumental in the way Belgium manages its waste. In the directive the various waste types such as glass, paper, plastic and garden waste are separated at source. The Pay as You Throw (PAYT) schemes have also been fundamental in compelling the public to adhere to the sorting of waste regulations. Residents are given about 4 bags to sort their waste in their homes. The bag of waste meant for disposal, costs more than the bags for recyclable waste. In 2013, Belgium was the leader in waste management across Europe [40] and profound lessons can be learnt by other governments by emulating Belgium. The amount of waste either disposed off or incinerated was a low 197 kgs per capita compared to its other counterparts in Europe as a result of reduced waste generation and increased rates of recycling [40].
According to the authors in [35], in 2015, US$2.45 was charged per bag of waste to be disposed in Northern Belgium. This was approximately 5 times more than the rest of the bags and discourages waste dumping. In South Africa this would have been equivalent to R35.80 per bag versus R7.16 for recyclables. However, credit should also be given to the Belgians for playing their part in sorting waste and not resisting change in attitudes [35].
The company, Fost Plus, responsible for financing and handling the collection, sorting and recycling of waste has also been impeccable in its operations [41]. This has had an enormous positive impact on Belgium’s waste statistics. Residents are also given a waste collection calendar yearly or they can download the Recycle mobile application since collections for different coloured bags maybe carried out on different days. Residents are also fined if they do not sort or leave an improperly sorted bag in the street. In a report written in 2013 by authors in [42], the region, Brussels-Capital was apparently penalising residents as much as €625. Training is also offered to the public including children in schools, emphasizing the importance of waste sorting and its benefits [41]. Belgium is also a signatory to the conventions outlined in Figure 4.
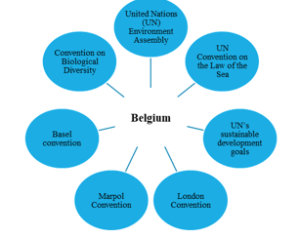
Figure 4: Conventions and Bodies Supported by Belgium
3.2. Australia’s case
Australia has a population of 25.6 million [43] and is made up of six states namely New South Wales, Queensland, South Australia, Tasmania, Victoria, and Western Australia as well as three internal territories and seven external territories each with its own government except the Jervis Bay Territory [44]. Australia set itself some ambitious targets in its 2018 National Waste Policy, among which was the ban after June 2020 on plastic, tyres, glass and paper exports. The country has realised that these materials often regarded as waste are a resource that can be used to; generate valuable products, create employment, boost the economy, protect the environment and health of its people. Approximately 9.2 jobs are created from 10 000 tonnes of recycled material in comparison to 2.8 jobs from landfilling [45]. The policy also reflects the banning of SUPs and the need for recording (and sharing) of accurate waste data including imports almost on a real time basis to assist with decision making coupled with unsophisticated online systems that are easy for everyone to understand. Other highlighted targets included a recovery rate of 80% for recyclables in MSW, purchasing of recycled materials by government and industries in order to increase the demand for these, and drive innovation by funding upcoming plastic recycling and waste prevention solutions. The underlying principle in Australia’s Waste policy is the circular economy approach; a concept discussed in greater detail in an earlier study in [37].
The 2019 National Action Plan was then drafted to aid in the implementation of the National Waste Policy. Some of the documented strategies and targets given are shown in Table 1 [46]:
Table 1: 2019 National Action Plan Strategies
| Strategy | Target |
| Drafting of legislation to avoid landfilling of recyclable material | 2022 |
| Sourcing new markets for recycled products | ongoing |
| Funding industries that make recycled products | 2020 |
| Increasing kerbside recycling rates through education and use of the Australasian Recycling Label (ARL) | ongoing |
| Launching a recycled products online market where buyers and sellers can connect | 2021 |
| Development of an application that helps the public to minimise contamination of recyclables in MSW | 2020 |
| Determining factors contributing to contamination of recyclables in kerbside collections and implement remedial actions | 2020 |
| Instituting an investment fund for Product Stewardship of oil containers made of plastic | (2020) |
| Development or adoption of standards that extend the life of a product including standards for use of recycled products in roads (Reconophalt) [42] and rail projects | 2020 |
| Develop national standards for collections | 2022 |
Figure 5 shows the targets in relation to packaging and plastic as detailed in the 2019 action plan in [46].
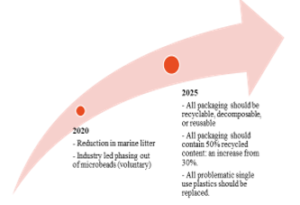
Figure 5: Targets in relation to packaging and plastic
In [47], the authors also mentioned programmes such as Do the Right Thing, Neat Streets, Don’t be a Tosser and Bin your Butts which all help to make the public aware of the need to prevent littering. Another programme; Keep Australia Beautiful (KAB) outlined in [48] is also linked to initiatives such as Tidy Towns, Clean Beaches, Sustainable Cities, National Litter Index (NLI), Beverage Container Recycling Grants, Eco-Schools, Adopt a Patch, and KAB Week which occurs annually in August [48]. The NLI measures the degree of littering across the country annually.
Australia also formulated a framework known as the Threat Abatement Plan for the impact of marine debris on the vertebrate wildlife of Australia’s coasts and oceans (2018), to protect marine animals from injury or death caused by marine debris. Australia also has two national plans namely, the Marine Turtle Recovery Plan (implemented in 2003 and reviewed in 2013) and the Grey Nurse Recovery Plan (initially adopted in 2002 and a new plan initiated in 2014) which are meant to boost the numbers of these species [49].
Australia is also actively involved in the United Nations General Assembly and the United Nations Environment Programme (UNEP) which seeks to protect the marine environment from land-based pollution. Australia, therefore, is in full support of the UN’s Sustainable Development Goal 12 which encourages sustainable consumption and production. The country participates in regional initiatives such as the Coral Triangle Initiative, the Coordinating Body on the Seas of East Asia (COBSEA) and the Marine Resources Conservation Working Group of Asia Pacific Economic Cooperation (APEC) [49] and is launching in 2021, the Australia, New Zealand and Pacific Island nations (ANZPAC) Plastics Pact; a collaboration between Australia, New Zealand and other Pacific island countries which will be part of Ellen MacArthur’s Plastics Pact. The pact is led by APCO and The Waste and Resources Action Programme (WRAP), based in the United Kingdom (UK) is offering support. WRAP also manages the UK Plastics Pact [50].
In addition to this, the country is a member of other various international conventions and agreements on waste control, as shown in Figure 6. This ensures that the country is accountable, a trait that can only be of benefit to the country. Australia has managed to meet its international commitments by instituting regulations.
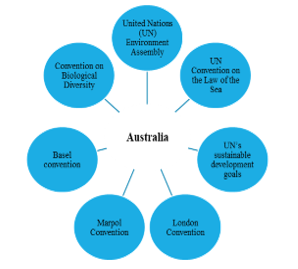
Figure 6: Conventions and Bodies Supported by Australia
3.3. South Korea’s case
South Korea has a population of about 51.3 million [51] and the country is divided into 9 provinces namely North Chungcheong, South Chungcheong, Gangwon, Gyeonggi, North Gyeongsang, South Gyeongsang, North Jeolla, South Jeolla, and Jeju Special Self-Governing Province [52]. The Ministry of Environment in South Korea oversees the waste disposal policy referred to as “jongnyangje”. The policy emphasises mandatory separation of waste into various fractions namely, recyclables, organics, large waste and landfill wastes. Fines are instituted for failure to abide by the policy guidelines [53,54]. Rewards are also given as an incentive to people who report non-compliance [54]. This explains why South Korea placed second out of 37 countries in the Organisation for Economic Co-operation and Development (OECD) for achieving a recycling rate of 59% in 2013 [53,55] and placed fifth globally in 2018 with a recycling rate of 53.7% [56]. On produced plastic products, over 60% of these are recycled [57].
The collection of waste is done at municipal level where revenue for this service is generated from the sale of differently coloured garbage bags. The purchase of the bin bags is compulsory and colour codes also differ per district. While organic wastes should be dried before disposal, recyclables should be flattened, and large wastes such as televisions should bear large object disposal stickers that are purchased from district offices [58]. The government of South Korea has been lauded for financially supporting the 48 plastic recycling businesses in the country which were struggling as a result of the ban imposed by China on importation of recyclable wastes which had resulted in piles of plastic waste in the country [58].
Figure 7 shows the progression of waste management acts and schemes implemented in the country and these are described in more detail in Table 2.
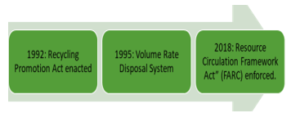
Figure 7: Progression of Waste Management Acts/Schemes [58]
Table 2: Description of Waste Management Acts/Schemes in South Korea [58]
| Act/Policy | About the Act/Scheme |
| Recycling Promotion Act enacted | The aim was to promote recycling through introducing once-off use product laws, waste deposit and fee schemes and establishment of recycling industries. |
| Volume Rate Disposal System | Established on the premise of the “Pay as you throw scheme” similar to Belgium’s case. The aim was to discourage waste generation and increase recycling. This was a deviation from the fixed charges which were previously imposed regardless of the amount of waste a household would generate. |
| Resource Circulation Framework Act” (FARC) | The aim of this framework was to shift from the linear “take-make-waste” model to a circular economy approach. Hence the country is now working towards a “Zero Waste” policy. The country expects to yield socio-economic and environmental benefits from the framework as a result of reduced pollution and better managed resources. |
Between 1994 and 2013, household waste per capita reduced from 1.3 kg to 0.94 kg (47,940 tonnes per day in total), buried waste decreased from 81.2% to 9.6%, burned waste decreased from 15.3% to 6.4% while recycled waste increased from 15.3% to 83.2%, Figure 8 [59]. These outstanding figures brought rapid economic growth into the country [55,60].
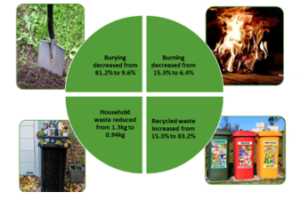
Figure 8: South Korea Waste Management Successes
The government of South Korea aims to reduce plastic waste by 50% as well as increase recycling rate from 34% to 70% by 2030. In 2020, coloured plastic bottles were also banned as they are difficult to recycle and polyvinyl chloride products may also follow suit. A target has also been set to eliminate disposal cups and straws by 2027 while cafés can be fined as much as US$1800 for using plastic cups for indoor sitting [60].
South Korea is also a signatory to the international conventions and agreements shown in Figure 9.
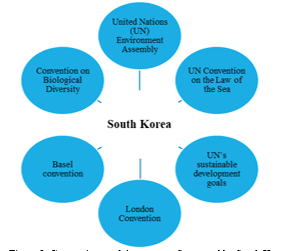
Figure 9: Conventions and Agreements Supported by South Korea
- Canada’s case
Canada’s population is around 38 million [61] and the country has ten provinces namely Alberta, British Columbia, Manitoba, New Brunswick, Newfoundland and Labrador, Nova Scotia, Ontario, Prince Edward Island, Quebec, and Saskatchewan and three territories namely, Northwest Territories, Nunavut, and Yukon [62]. The Environment and Climate Change Canada (ECCC) is the government entity mandated to coordinate environmental policies to protect the environment and the public [63]. In 2018, the Aspirational Canada-wide Waste Reduction Goal was approved with the aim of promoting waste reduction and assessing progress in the country. The goal is to reduce the annual waste generation rate per person from 706 kg (2014) to 490 kg per person in 9 years (2030) and eventually 350 kg per person in 19 years (2040) [64].
On the international stage, during the tenure of the country’s G7 Presidency in 2018, Canada launched the Ocean Plastics Charter aimed at protecting the marine environment and was adopted by over 20 countries and more than 50 organisations around the globe [65-67]. The charter outlines:
- the prevention of plastic waste mismanagement
- redesign of plastic products to ensure ease of recovery and recyclability.
- recycling and recycled content targets
- commitment to reduce plastic usage and waste generation.
- importance of seeing plastic as a valuable and not trash [66].
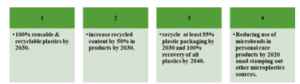
Figure 10: Targets set by Canada
Figure 10 shows the targets set which require collaborations between governments and industry [67].
Canada also pledged $100 million towards the improvement of waste management services in developing countries [65] and is a signatory to the conventions and agreements in Figure 11.
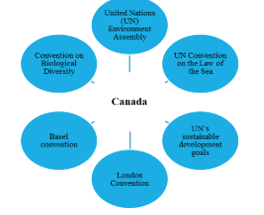
Figure 11: Conventions and Agreements Supported by Canada
Building on the Charter, Canada drafted its zero plastic waste strategy and its success hinges on enforcement of regulations, voluntary industry led initiatives, partnerships with various environment organisations and the community as well as EPR initiatives. In 2019, the Canadian Council of Ministers of the Environment (CCME) drafted an action plan to meet the goals of the zero-waste strategy [67]. The six broad action items outlined in the plan are outlined in Figure 12 below.
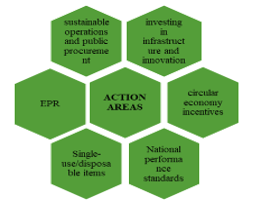
Figure 12: Action Areas of the Canada-Wide Action Plan on Zero Plastic Waste Phase 1
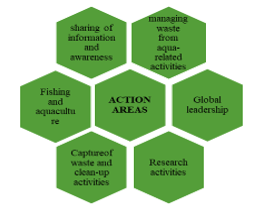
Figure 13: Action Areas of the Canada-Wide Action Plan on Zero Plastic Waste Phase 2
In 2020, the CCME launched Phase 2 of the Action Plan whose main focus areas are highlighted in Figure 13 [68].
Figure 14 shows plastic waste management practices in Canada in 2016 which reveal the linearity of the country’s waste management techniques. According to the report by authors in [69] Canada lost around US$6 billion through failure to recycle plastic waste and this will increase to US$8.7 billion with a “business as usual” approach [69]. However, with the zero-waste strategy that has been commissioned in the country, this will avert the problems associated with a linear waste management model.
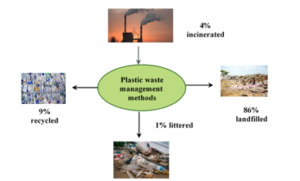
Figure 14: Plastic Waste Management Practices in Canada in 2016 [69]
Although Canada’s track record in managing plastic waste still has a long way to go, it has begun to move on a positive trajectory with all the strategies that are being implemented. There are lessons that can be learnt from these and the wealth of research that has been conducted in the country. The success of the zero-waste strategy will result in the following benefits for the country:
- annual cost saving of about US$400 million
- creation of 42,000 jobs
- Greenhouse gas savings of 1.8Mt of CO2e [69].
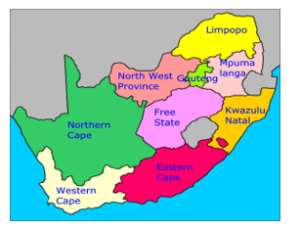
Figure 15: Map of South Africa [70]
- South Africa’s case
South Africa has nine provinces, Figure 15 [70] and eight metropolitan municipalities [71], namely; Buffalo City (East London), City of Cape Town (Western Cape), Ekurhuleni Metropolitan Municipality (East Rand, Gauteng), City of eThekwini (Durban, KwaZulu Natal), City of Johannesburg (Gauteng)), Mangaung Municipality (Free State), Nelson Mandela Metropolitan Municipality (Eastern Cape) and City of Tshwane (Gauteng).
The annual plastic consumption per capita in South Africa is 30-50kg [72] which gives a total consumption of approximately 1.8 to 3 million tonnes. Figure 16 shows a comparison of the daily generation of plastic waste per person for Australia, Belgium, South Korea, Canada and South Africa [73].

Figure 16: Comparison of the daily generation of plastic waste per person for South Africa and previously mentioned countries Data sourced from [73,74].
However, in [75] the authors argue that the data used in [74] was inaccurate and as a result they determined a significantly lower daily plastic waste generation rate of 0.053kgs/per capita. The authors in [75] used data from the Department of Environmental Affairs (DEA) in [76] in their calculations although the authors in [76] highlighted in their report that there was under-reporting for waste streams such as plastic, organic waste, glass and tyres due to lack of weigh bridges for example at landfill sites as well as the classification of these streams under MSW. The inconsistencies in literature on the waste management statistics reported for South Africa are also highlighted by various authors in [77-79]. Inaccurate data results in the understating of the environmental impact of plastic waste [78].
Furthermore, approximately 19.7 million people (34.1%) in South Africa do not have access to waste collection services and consequently resort to either burning or illegally dumping their waste, in which case valuable recyclable materials leak into the environment and are also not accounted for [7,80]. Availability of correct data ensures that costly problems of over-designing and under-designing equipment for example in an incineration plant, are avoided, as well as allow for effective and appropriate mitigation strategies to be employed. Lack of “buy in” from stakeholders on proposed projects citing exorbitant costs can be a negative consequence that arises from over-designing.
Figure 17 shows the disparity in waste collection services in South Africa’s provinces [76]. Provinces with a higher urban population have higher collection rates compared to those with a higher rural population. As the population of informal settlements residents who do not pay rates in cities continues to increase due to rural-urban migration, problems associated with waste management in these cities will intensify [79].
In [81], the authors reported that Europe and other developed countries are 20 to 30 years ahead of South Africa when it comes to waste management. Unlike South Africa, these countries have diverted from the use of landfills and adopted a culture of prevention, reuse, recycling, and recovery [81]. In 2018, Plastics South Africa, classified the country as a “mechanical recycling champion” for having recycled 46.3% of all the plastic waste generated taking into consideration locally manufactured products only [82] against 31.1% for Europe [80]. In the same year, 2018, the highest figure of US$354.4 million was recorded for imports of Plastic & Rubber Articles in South Africa [83], while in 2019, the country imported plastics and plastic articles worth US$2.5 billion, representing a proportion of 2.8% of the overall value of products imported [84]. It is very crucial for recycling statistics reported to consider all imported plastic products for a clearer picture on plastic waste management to be ascertained.
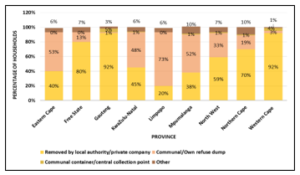
Figure 17: Waste Collection Services in South Africa Per Province (data sourced from [76])
In [85], the authors also argue that since countries employ various approaches when determining recycling rates, comparisons per country are difficult to undertake. In addition, it is also worthwhile to note that, in Europe, the balance of plastic waste remaining after recycling, was either used for energy generation in WtE plants (41.6%) or landfilled (27.3%) while in South Africa’s case, the balance of 53.7% was landfilled.
In South Africa, plastic is the material which has the lowest recycling rate among other recyclables such as paper, glass, tyres and metals. In a State of Waste Report released in 2018, plastic had a recycling rate of 43.7% in 2017, while glass, metals (ferrous and non-ferrous) and tyres were at 78.4%, 75% and 100%, respectively, Figure 18.
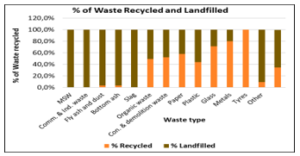
Figure 18: Percentage of Waste Recycled and Landfilled Per Waste Type (data sourced from [76])
The balance of 56.3% plastic was disposed off at landfills [76] an indication of significant plastic leakage.
Further accumulation of plastics in landfills, which are running low on landfill space as well and reaching maximum acceptable height should be prevented [86]. The lack of innovative ideas and research and development inadequacies have been cited as a limitation in South Africa’s progression in the Plastics sector [87]. The recycling rate of 100% for tyres is disputable though, since it is common to see tyres indiscriminately dumped.
The World Wide Fund for Nature (WWF), however put the plastics recycling rate for South Africa at 16% with 84% being dumped in waste bins and ending up in landfills while some plastic wastes are transported by wind and end up in the marine environment through storm water drains [72]. It is not clearly defined in [72], whether the mentioned figures are from the input or output recycling rate.
Nonetheless, South Africa still needs to be complimented for the strides that it has made in managing plastic waste. Voluntary producer responsibility organisations (PROs) such as the PET Recycling Company (PETCO) for polyethylene terephthalate (PET) [7], Polystyrene Association of South Africa for all variants of polystyrene, Southern African Vinyls Association (SAVA) for plastics such as polyvinyl chloride and Polyco responsible for polypropylene, high and low density polyethylene and other types [88] have been formed to assist with the recycling of the various plastic waste streams thereby preventing the leakage of plastic into the environment as well as attaining value from post-consumer and landfilled plastics. These companies all fall under the umbrella body Plastics South Africa.
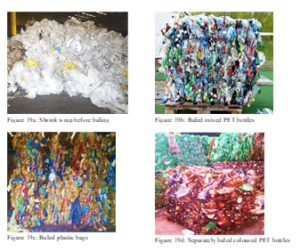
Figure 19: The recyclable waste
At the heart of South Africa’s recycling industry are about 60 000 waste pickers [89]. However, according to the authors in [81], this figure may be conservative, and they estimated the number to be around 215 000 in 2017 [81]. Waste pickers rummage through bins or are based at landfills where they remove recyclables from MSW destined for the landfill such as plastics which they take to buy-back centres and get paid to earn a living. Approximately 80 to 90% of packaging is recovered by waste pickers [79]. The presence of waste pickers resulted in a landfill cost saving of around $US21.3-US$51.5 million (R309.2-R748.8 million) for municipalities in 2014 [89]. Buy back centres such as Remade Recycling have also been key in South Africa’s plastic waste management, receiving all types of plastic waste from waste pickers and collectors, sorting, and baling the recyclable waste before transporting it to convertors as feedstock (Figure 19a-d).
- The Role of Government
The National Waste Management Strategy (NWMS) is a statutory requirement of the National Environmental Management Act: Waste Act, 2008 (Act No. 59 of 2008) referred to as the “Waste Act”. This strategy aims to ensure that the objectives of the Waste Act are fulfilled [90]. The NWMS of 2011 stressed the importance of re-using, recycling, and recovering waste (3Rs), Figure 20. In [91], targets to have waste collection in 95% of households in urban areas and 75% in the rural areas by 2016 are given. To date, in urban areas and rural areas, 64.7% of households and 75.1% households respectively now have access to waste collection services.
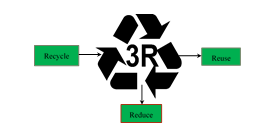
Figure 20: The 3 Rs
On separation of waste at source, the 2011 strategy failed to meet its target of ensuring that households in different municipalities would be separating their waste at source by 2016 [91]. Prior to the drafting of the NWMS, the Polokwane Declaration which envisioned zero waste to landfill for South Africa was signed in September 2001. In the declaration, South Africa set ambitious targets which are summarised in Figure 21.
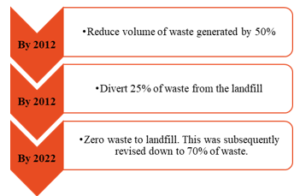
Figure 21: Polokwane Declaration Targets [92,93].
In 2020, the government released a new NWMS which now advocates not only for the 3Rs but also a circular economy approach coupled with EPR, which encourages waste prevention and product regeneration at the end of its lifecycle [37,86] whose waste reduction to landfill pathway is shown in Figure 22. The failure of the Polokwane Declaration to achieve zero waste to landfill has resulted in a new target being set in the 2020 NWMS which goes beyond 2035.
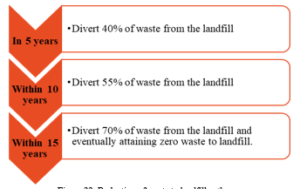
Figure 22: Reduction of waste to landfill pathway
The current NWMS of 2020 also reinforces the need for the continuation of awareness campaigns [86]; which was first outlined in the 2011 NWMS. The objective was to have 80% of municipalities and 80% of schools conducting such campaigns by 2016 [91] and to date 60% of municipalities are conducting these awareness programmes while all schools now teach about waste as part of the curriculum [86].
Minimisation of illegal dumping of waste, littering and the use of single use plastics such as disposable cups and straws is also outlined in the 2020 NWMS. One of the main drivers for this strategy is the need to prevent landfilling, as previously reflected in the 2011 strategy [91]. It remains to be seen whether the latest NWMS strategy will succeed in the areas where the 2011 NWMS strategy has not with the new target year for waste collection in 95% of households set for 2024.
The prevalence landfilling in South Africa has been attributed to the absence of alternatives as well as the belief that this method of waste management, despite being the least recommended in the waste hierarchy, is less costly to implement and yet its environmental impacts are not accounted for [86]. According to the authors in [94], recycling reduces the environmental impact of a product, therefore, increasing recycling rates in South Africa, can only benefit the country.
- Introduction of other Policy Initiatives
In May 2003, South Africa instituted plastic bag regulations meant to stop the production and importation of sub-standard plastics that could neither be reused nor recycled. This meant that only bags with a minimum thickness of 30 µm were permissible [7,95]. This regulation was accompanied by a plastic levy of 3 cents (R0.03) in 2004, which latter increased to 6 cents (R0.06) and 25 cents (R0.25) in 2017 and 2020, respectively. However, this policy intervention has not yielded the expected results of curtailing plastic bag consumption [96,97].
The Department of Environmental Affairs (DEA) has also begun discussions with businesses to ban microbeads in the cosmetic industry. It is not clear at what stage these consultations are now at [98]. Other initiatives launched by the government to change the public’s attitudes and perceptions and lessen the impact of plastic waste while creating employment at the same time include Operation Phakisa (2014) [99], the Recycling Enterprise Support Programme (RESP) (2016) [100] , and the Good Green Deeds programme (2019) [101].
On the international stage, South Africa has pledged to support several Conventions on the protection of the environment, Figure 23.
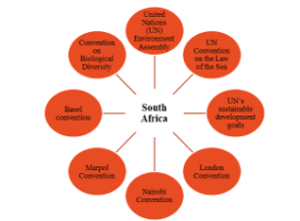
Figure 23: Conventions and Bodies supported by South Africa.
- Waste Management Services: A Case Study of Pikitup
Pikitup, which provides waste management services to the City of Johannesburg in the Gauteng Province rolled out a voluntary separation of waste at source programme in some of its suburbs in 2009 [102]. This programme has been moving at a snail’s pace because more than a decade later, it has not moved into the rest of Johannesburg. The amount of dry waste collected in the financial year 2016/17 was reportedly 4.5 kgs of dry recyclables per household per month out of an expected 13 kgs per household because not all households separated their waste. On 1 July 2018, Pikitup implemented mandatory waste separation in the communities where the programme had been rolled out, to increase the recycling rates [102]. Therefore, this mandatory call covered approximately 26% of all the households in Johannesburg [102]. Despite the mandatory call, there are no fines instituted for households that do not separate the waste, opting instead to incentivise residents whilst still collecting mixed waste. This creates a point of plastic waste leakage.
The company has mentioned that the roll out to all of Gauteng will happen around 2021 and they expect that this campaign will eventually be implemented not only in Johannesburg but the rest of South Africa. Households where this initiative has not been commenced are encouraged to separate their waste and drop off at nearby drop off centres. Pikitup also mention that dirty clamshell containers, sweet wrappers, detergent bags, potato crisps and sauce packaging are not recyclable [102].
This information and the motivation behind it, needs to be communicated to all households for the programme to be a success. We are now in 2021, so the complete rollout of the separation of waste at source programme appears not achievable. The positive however, is that it shows that the country is aware of what needs to be done but a shift in gears is required so that targets can be met within reasonable and set timeframes. It is undeniable that if this programme is to move like a well-oiled machine, its success hinges on the availability of financial resources as well as willingness by the public to separate their waste. The public also needs to be aware of the various plastic types and the recycling codes associated with them, as shown in Table 3.
Table 3: Plastic Recycling Codes [103]
| Recycling Code | Plastic Type | Application |
| 1 | Polyethylene terephthalate (PETE) | Soft drink bottles, mineral water, fruit juice container, cooking oil |
| 2 | High density polyethylene (HDPE) | Milk jugs, detergents, shampoo bottles |
| 3 | Poly vinyl chloride (PVC) | Trays for sweets, fruit, plastic packaging (bubble foil), food wrapping foils |
| 4 | Low density polyethylene (LDPE) | Crushed bottles, shopping bags, wrappings |
| 5 | Polypropylene (PP) | Furniture, toys, car bumpers |
| 6 | Polystyrene | Hard packaging, cosmetic bags, CD cases |
| 7 | Other | Acrylic, polycarbonate, fibres, nylon |
Figure 24 shows the household separation levels in South Africa’s nine provinces, with the Western Cape Province having the highest level of 20% followed by Gauteng Province with 13%.
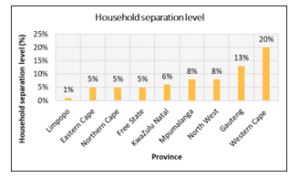
Figure 24: Household separation level per province in South Africa [104]
- Other Waste Campaigns
There are also other campaigns that are happening in South Africa. However, it is not clear to what extent the public is aware about them and a national survey would need to be conducted to assess public awareness and knowledge levels. These include the annual Clean-up and Recycle SA Week, the International Coastal Clean-up Day (ICC) [105] and the weekly #KleenaJoburg campaign launched in December 2019 [106]. The Two Oceans Aquarium in Cape Town also runs a campaign called “Rethink the Bag”, which educates people on the harm that SUP bags can cause in the marine environment. They have also launched a petition to urge the government to ban single use plastic bags [107]. In some municipalities, beach clean-up campaigns are also done.
4. EPR Reviewed Studies
Various studies on EPR have been conducted across the globe; some of which have been reviewed in this study under this section. In [108] (2010), the author compared mandatory and voluntary EPR schemes in South Africa and found that the latter appeared more effective after comparing the Plastic bag regulations instituted by the government against the PETCO initiative for PET recycling. However, the study also highlights that the differences could also be attributed to the fact that unlike PET, plastic bags are not easily recyclable, are of lower value, recycled bags have limited areas of application and their use as plastic bag liners leads to leakages into the environment. The need to avoid government regulations thought to be harsh may also have possibly fuelled voluntary EPR’s success.
In [109], the authors conducted a study in Serbia which revealed several problems. First, the quantity of recyclables recovered from MSW is low due to lack of recycling infrastructure, programmes, and funding. Further to this, landfill taxes are not applied to all municipalities, consequently there is no motivation to remove recyclables from MSW. However, if landfill taxes are exorbitant, this can result in an increase in illegal dumping. In addition, the exclusion of waste pickers from projects involving municipalities and PROs was also observed to be an impediment in the collection of recyclables with waste pickers vandalising infrastructure put in place to take out the recyclables. Lack of expertise during policy formulation was also highlighted. For example, after providing colour coded bins to residents, a single truck would be used to collect the separated waste, which then demotivated the residents. Setting low recycling targets has also affected recovery of materials from MSW. For example, PROs can meet these targets by collecting waste from industrial and commercial wastes such that there is no motivation to collect from residential areas. PROs may also prioritise funding towards one type of recyclable and not others while some may not contribute to infrastructure development. In addition the authors in [109] also mention that there needs to be monitoring of operations of PROs, a minimum target that PROs should contribute towards recovery of recyclables from MSW and these organisations should submit reports to the government annually detailing expenditure for the sake of transparency.
In [110], the authors conducted a study in Colombia (2018), and recommended having multiple PROs for a product as well as delegating enforcement of laws to more than one organisation.
In [111], the authors conducted a study in Europe and found that strict enforcement of EPR related regulations was deficient. Further to this, the lack of incentives for companies that comply resulted in companies not participating in the programme. Despite these limitations, the study concluded that EPR programmes can boost recycling levels and this increase in plastic recyclate, will in turn require effective collection, sorting and treatment of the plastic waste. Therefore, regional and local authorities together with PROs should ensure that collection services are efficient as well as educate the public on how to properly sort waste. Revenue from EPR schemes can be used for these initiatives. The study also highlights the importance of EPR in achieving a circular economy and recommended implantation of Deposit Refund Schemes (DPR) across the European Union. In addition, the need for the opinions of manufacturers, packers, fillers and retailers to be considered when implementing DPR as well as the importance of the public advocating for the use of biodegradable plastics were highlighted. Success of EPR will depend on its confluence with other initiatives such as, labelling, procurement policies, pay-as-you-throw schemes, recycling goals, prohibitions, goods and waste taxes, non-mandatory agreements and public consciousness with no seclusion of any type of plastic.
In [112], the authors refer to the EU Waste Framework Directive, which has assisted waste management in Europe to remain financially viable and independent. The study recommend the roll out of a global EPR as well as ensuring that plastic product designs are standardised at a global level such that products that do not meet the specifications are banned or taxed. However, the authors also highlight the possibility of resistance from industry regarding the Polluter Pays principle. Deposit return schemes as well as consumer pay-as-you-throw programmes which discourage unsustainable consumption patterns are recommended.
In [113], the authors revealed that EPR in China is hindered by low levels of recycling including lack of recycling technology and therefore, producers should be encouraged to develop sorting and recycling technologies. The study mentions the importance of citizenry involvement, in assisting the government to identify industries not complying with the EPR regulations.
In [33], the authors explained that the reliance of the EPR scheme in South Korea on money paid by producers is a drawback. The study found that some recycled products were of poor quality and therefore, investing in modern recycling equipment is crucial. In South Korea, producers are given an annual target of plastic waste to recycle and this can be done directly or through a PRO, which they pay a fee to. The PRO then pays a subsidy to the Korea Resource Circulation Service Agency (KORA) which is responsible for collection and recycling. Recycling subsidies and private investments have sustained the EPR scheme. Producers that fail to meet their recycling targets are fined a fee that is higher than the recycling fee. PRO and KORA submit reports on the performance of the producers under the EPR scheme to the Korea Environment Corporation. The authors recommended the inclusion of more plastic products under the EPR scheme to improve recycling rates. The study also highlights that since recycling plants operate on a small-scale basis, they are affected by domestic and global trends in the recycling market.
In [114], the authors revealed a number of hindrances to the successful implementation of EPR schemes in Brazil (São Paulo). First, lack of enforcement of the law for those not practicing in EPR schemes as well as absence of incentives could demotivate companies that are practicing. Incentives include offering tax rebates to companies in the scheme. In addition, consumers do not always return the waste, for example if drop off centres are far, while some would rather keep the waste, for example in the case of cell phones and resell. Discounts given on raw materials also do not promote the use of recycled products. Collection of waste may also be a problem if the distances to be covered are long and the waste is little. The authors recommended industry led EPR schemes and that retailers should also form part of the schemes as they are involved in waste collection from consumers. Integration of municipalities into the scheme although necessary, could pose a challenge when determining how much compensation they should get if they are part of the scheme. It was noted that many cases have gone to court because of these disputes and as a result binding agreement must be drafted to avoid such disputes. The importance of awareness campaigns which should be funded by retailers and producers was also noted. Other recommendations include;
- banning the sale of goods subject to EPR but without the scheme in place
- the need for collaborations between municipalities and businesses to also build infrastructure and to stamp out non-compliance
- that all new companies should have a proposed EPR scheme before they can be given permits to operate.
5. Discussion and Conclusions
- Setting of Targets
Reviewing findings from the authors in [74]; of the five countries studied in this paper, South Africa has the highest plastic waste generation rates per capita. There are vital lessons to learn from Belgium, Australia, South Korea and Canada. South Africa has many right elements in its policies to become a pace setter in the continent when it comes to plastic waste management. However, implementation seems to be lacking as set target dates continue to be shifted forward without tangible results being realised in some cases; an example being the “zero waste to landfill target” which was reduced from 100% to 70% waste diversion from landfill by 2022 [93]. Further to this, the target year of 2022 has now been moved to 2035 as highlighted in the 2020 NWMS [86]. Continuous resetting of goals will be detrimental to the country’s success in managing its plastic waste as it does not yield benefits except shifting responsibility from one actor to another and this can persist for decades to come. Moreover, if 9.2 jobs are being created for every 10 000 tonnes of waste recycled compared to 2.8 jobs with landfilling [45], then South Africa is losing a significant number of jobs in the waste sector by not stamping out the practice of landfilling which is the main waste management method. Despite these challenges, South Africa has made some headways in trying to manage plastic pollution.
- Waste Collection Services
Ensuring that the entire population of the country has access to waste collection services followed by compulsory separation of waste at source and dedicated collection points for small plastic items are key elements to successful waste management. Currently, with a single bin of mixed waste in most households, 34.1% of the population lacks waste management services [80] and at times refuse collections are not always on schedule as a result of backlogs caused by breakdowns. Therefore, unless there are other role players to assist with the collection of sorted recyclable bins or bags the separation of waste at source programme will be unsuccessful.
- Data Accuracy
This study noted the problem of data inconsistencies in the country making it difficult to ascertain with confidence, the country’s waste management record as has been highlighted by other authors in [76-79]. Perhaps, the accuracy of data can be improved by employing real time data logging at recycling centres that receive post-consumer plastic as highlighted in Australia’s National Action Plan, installing and properly maintaining weigh bridges at landfills as well as stamping out illegal dumping and burning of plastic waste which both contribute to the load of unaccounted waste.
- Public’s Attitudes
As the government and various stakeholders drive the agenda of zero waste to landfill, the consumers should not be left behind because they are also vital in achieving a future where plastic waste is not dumped but repurposed (circular economy). Behaviour changes go hand in glove with knowledge and if the public is not made aware of the importance or need to separate waste, then the amount of waste sent to the landfills will not decrease to levels observed in Belgium. A change in the public’s attitudes has been highlighted as one of the reasons why waste management in Belgium has been a success [35]. Investment in awareness campaigns is necessary and these must reach as far as informal settlements and rural areas. It was noted that rural households are less likely to recycle as compared to urban households [115] and this could be attributed to South Africa’s National Domestic Waste Collection Standards which put more emphasis on waste separation in urban areas. Furthermore, young adults and families were also found less likely to recycle [115], and therefore, campaigns like Europe’s Generation Awake, which encouraged sustainable living for young adults (25-40 years old) and children, can play a very important role in educating this group. This campaign involved the release of short films such as The Awakeners and Water Maniac Walter [116], which were comical, but got the message through [117]. The Generation Awake campaign was a success as more than 1 million people reportedly accessed their website, their videos were watched over 10 million times, they reached 140 000 followers on Facebook and over 2000 articles were written regarding the campaign [117]. Incentives such as the PAYT scheme practised in Belgium will also encourage reciprocation [118] as seen in Belgium; while enforcing this, will strengthen the regulation.
Moreover, the public should be educated on the different plastic recycling codes. However, a major challenge that is likely to be encountered is that some plastic products in the country do not have recycling codes. Therefore, regulations should be put in place to ensure that all plastic products including imports have these codes. In addition, some of the printed codes are quite small to detect and therefore, increasing their size on the product will also make it easier for the consumer to separate or recycle. A National Littering Index (NLI) similar to the one employed in Australia can be used as one of the tools to assess change in the attitudes and behaviours of people post anti-littering campaigns.
- Lessons from the Covid-19 Pandemic
The Covid 19 phase exposed a major weakness in our waste management system. When the government declared a Level 5 lockdown of the country from the 27th of March 2020 to 30 April 2020 (35 days), where only people regarded as essential services were allowed to work, waste pickers were not on that list, but the municipalities still carried out their mandate of collecting MSW. With no one to remove recyclables such as plastic, this meant that plastic in the MSW was landfilled. It could be argued by some, that since over 70% of South Africa’s plastic waste that is recycled is from landfills; the plastic that leaked into these landfills during the lockdown will eventually be reclaimed. However, plastic from landfills is contaminated and therefore not only does this restrict its uses but it also requires washing and is sometimes rejected by recyclers. South Africa, being a water scarce country, with several municipalities under water restrictions means diverting water towards washing of plastic from landfills will only strain this resource further [119]. Therefore, it is necessary to develop a framework to regularise and integrate informal waste pickers in the waste management value chain of all municipalities across the country as they have an important role to play in the prevention of leakages of recyclables.
- Alternatives to mechanical recycling
Other innovative projects such as the construction of a section of a road in Jeffreys Bay with plastic infused tar need to be expanded. About 1.8 million plastic bags can be used for a 1 km stretch of road [120]. Similarly, to Australia as highlighted in [46] South Africa should consider also developing its own standards for use of plastic waste and other recyclables in roads and rail projects.
In Ivory Coast, the country in partnership with the United Nations Children’s Emergency Fund (UNICEF) has begun building schools using plastic bricks that are also resistant to fire and are waterproof. The bricks also do not require cement and sand and only require a hammer to lay them [121]. UNICEF has projected that a total of 500 schools; enough to accommodate 25 000 students, will be built by 2021. This project has also empowered women in the process as they are the ones collecting the plastic for recycling into bricks. UNICEF also built a plastic brick making factory in the country to enable all the manufacturing to be done in Ivory Coast. The bricks were initially made by Conceptos Plasticos, a Colombian company. Prior to this initiative, only 5% of Ivory Coast’s waste was recycled, so this figure is set to rise as more people begin to realise the value of plastic that is in their own “backyard” [121]. There is a significant amount of plastic that can be reclaimed from South Africa’s landfills and used in such projects where contamination may not be a problem.
- Lessons for South Africa from the Reviewed EPR Studies
To ensure EPR’s success in South Africa, Multi-National Companies should disclose how much plastic they are putting on the market as well as how they are managing it post-consumer use [6]. Furthermore, producers must meet the recycling targets set by the government otherwise they should be fined fees that are higher than the recycling fees [33]. As industries in South Africa work on producing integrated waste management plans as requested by the government, informal waste pickers, retailers, municipalities and consumers should not be left out. As evidenced in the Serbia study, the exclusion of waste pickers led them to damage infrastructure in order to access the collected recyclables [109].
The government should also be wary no to set low recycling targets, as this can result in depressed recoveries of recyclables [109]. Plastic producers must continue to pay their recycling fees to PROs, which is currently being done in SA for voluntary PROs and plastic importers should not be absolved from paying [110]. The government should also periodically review and ascertain if the fees that are being contributed by producers to PROs are enough to sustain the sector.
Where a producer decides to take the responsibility, and by-pass the PRO, although the producer may submit performance reports, honesty and auditing are also required in this case. Furthermore, the quality of recyclables should also be of high standard so that the recycling industry remains viable up to a point where it can sustain itself without requiring external investments. A high quality will enable high value products to be made as well as increasing the product range that can be made. In that regard, the public should be aware [111,114] of how to sort waste, avoiding contamination of recyclables and to clean any contaminated plastic waste preferably with used water (grey water).
On the other hand, retailers also play a crucial role in the collection of post-consumer plastic [111,114], for example through deposit refund schemes (DRS). Further to this, municipalities currently own the existing infrastructure for waste collection and therefore may only need assistance from industry to increase capacity [114]. The inclusion of consumers will also be critical as they need to ensure that waste is sorted correctly as well as be prepared to return the waste to the retailers for the DRS to work. In addition, consumers may also play a role by reporting industries flouting the EPR laws [111,113,114].
Enforcement of the law where compliance is lacking which has also been a concern in South Africa [77,79] should also be prioritised in order to avoid frustrating companies that are observing the law [111,114]. Other aspects to be considered are; whether it will be advantageous to have multiple PROs to make them competitive [110], whether it would be beneficial to ban products whose companies are not implementing their EPR schemes [114], and whether permits to operate should only be given to industries who have a proposed EPR scheme in place on registration [114]. There are many lessons on EPR implementation that South Africa can learn as it prepares its own blueprint on EPR and these should be enumerated and deliberated by the government and all concerned stakeholders.
6. Road Map for Future Actions in Plastic Waste Management in South Africa
Figure 25 shows a proposed road map that South Africa can implement moving forward.
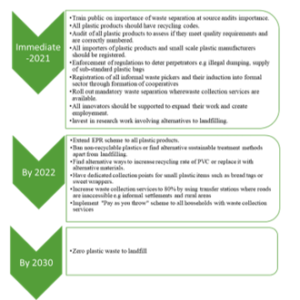
Figure 25: Road Map for South Africa
This paper has highlighted South Africa’s strengths, weaknesses, and opportunities in waste management as well as lessons from Belgium, Australia, South Korea and Canada that can be adopted by the country in order to make it a role model for Africa in plastic waste management. There exists an untapped opportunity for improvement of plastic recycling rates to levels comparable to other recyclables in the country through compulsory separation of waste at source. Hence an enabling environment should be created to encourage this practice. Since this will require a fully functional waste management infrastructure, collection services should expand to cover rural areas and informal settlements while industries can assist municipalities to upgrade infrastructure through the EPR scheme. In addition, there is potential for more jobs to be created in the waste sector through recycling than landfilling, thus urgent attention is needed to divert 100% waste from the landfill. Finally, the integration of informal waste pickers into the waste management should be prioritised. If the above-mentioned action points in the road map are succinctly applied, then zero plastic waste to landfill can be achieved earlier (2030) rather than aiming for a 70% reduction in plastic waste to landfill in the same year.
Conflict of Interest
The authors declare no conflict of interest.
Acknowledgment
The authors are grateful to the University of Johannesburg and the Botswana International University of Science and Technology for the financial and technical support.
- EPA, Municipal Solid Waste, Environmental Protection Agency, 2016.
- P. Magutu, C.O. Onsongo, “Operationalising municipal solid waste management,” IntechOpen, 2, 2011, doi:10.5772/16457.
- J. A. Nathanson, Solid-waste management. Definition, Methods, Importance, & Facts, Encyclopaedia Britannica, 2020.
- DEAT, Guideline on Recycling of Solid Waste, Department of Environmental Affairs and Tourism of South Africa, 2019.
- D. Hoornweg, P. Bhada-Tata, What a Waste: A Global Review of Solid Waste Management. Urban development series; knowledge papers no. 15. World Bank, 2012.
- M. Williams, R. Gower, J. Green, E. Whitebread, Z. Lenkiewicz, P. Schröder, No Time to Waste. Tackling the Plastic Pollution Crisis before It’s Too Late, Tearfund, 2019.
- Z.S. Mazhandu, E. Muzenda, T.A. Mamvura, M. Belaid, T. Nhubu, “Integrated and consolidated review of plastic waste management and bio-based biodegradable plastics: challenges and opportunities,” Sustainability, 12(20), 8360, 2020, doi:10.3390/su12208360.
- K. Naidoo, An Analysis of Municipal Solid Waste Management in South Africa using the Msunduzi Municipality as a Case Study, M.Sc Thesis, University of KwaZulu-Natal, 2009.
- Z.Z. Rasmeni, D.M. Madyira, “A review of the current municipal solid waste management practices in Johannesburg city townships,” Procedia Manufacturing, 35, 1025–1031, 2019, doi:10.1016/j.promfg.2019.06.052.
- Worldometer, South Africa Population 2020, 2020.
- FACS, Bread – Food Facts, Food Advisory Consumer Service, 2019.
- Bread Tags for Wheelchairs, Bread Tags for Wheelchairs – Helping Others Through Top and Tag Recycling, 2020.
- S.D. Anuar Sharuddin, F. Abnisa, W.M.A. Wan Daud, M.K. Aroua, “A review on pyrolysis of plastic wastes,” Energy Conversion and Management, 115, 308–326, 2016, doi:10.1016/j.enconman.2016.02.037.
- B. Kunwar, H.N. Cheng, S.R. Chandrashekaran, B.K. Sharma, “Plastics to fuel: a review,” Renewable and Sustainable Energy Reviews, 54, 421–428, 2016, doi:10.1016/j.rser.2015.10.015.
- S.M. Fakhrhoseini, M. Dastanian, “Predicting pyrolysis products of PE, PP, and PET using NRTL activity coefficient model,” Journal of Chemistry, 2013, 7–9, 2013, doi:10.1155/2013/487676.
- M.P. Aznar, M.A. Caballero, J.A. Sancho, E. Francés, “Plastic waste elimination by co-gasification with coal and biomass in fluidized bed with air in pilot plant,” Fuel Processing Technology, 87(5), 409–420, 2006, doi:10.1016/j.fuproc.2005.09.006.
- A. Sivan, New perspectives in plastic biodegradation, Current Opinion in Biotechnology, 22(3), 422–426, 2011, doi:10.1016/j.copbio.2011.01.013.
- O. Gulseven, S. Ashkanani, S. Abdullah, H. Ismaeil, H. Alkandari, M. Baroun, “A sustainable model for enhancing road quality with recycled plastic bags,” Kuwait Journal of Science, 46(4), 112–119, 2019.
- A.K. Jassim, “Recycling of Polyethylene Waste to Produce Plastic Cement,” Procedia Manufacturing, 8, 635–642, 2017, doi:10.1016/j.promfg.2017.02.081.
- N. Saikia, J. De Brito, “Use of plastic waste as aggregate in cement mortar and concrete preparation: A review,” Construction and Building Materials, 34, 385–401, 2012, doi:10.1016/j.conbuildmat.2012.02.066.
- Averda, South Africa Can Turn Plastic Waste into Building Blocks, 2019.
- B.L. Hartley, R.C. Thompson, S. Pahl, “Marine litter education boosts children’s understanding and self-reported actions,” Marine Pollution Bulletin, 90(1–2), 209–217, 2015, doi:10.1016/j.marpolbul.2014.10.049.
- C.M. Rochman, M.A. Browne, B.S. Halpern, B.T. Hentschel, E. Hoh, H.K. Karapanagioti, L.M. Rios-Mendoza, H. Takada, S. Teh, R.C. Thompson, “Policy: Classify plastic waste as hazardous,” Nature, 494(7436), 169–171, 2013, doi:10.1038/494169a.
- L. Oyake-Ombis, B.J.M. van Vliet, A.P.J. Mol, “Managing plastic waste in East Africa: Niche innovations in plastic production and solid waste,” Habitat International, 48, 188–197, 2015, doi:10.1016/j.habitatint.2015.03.019.
- M. Mourshed, M.H. Masud, F. Rashid, M.U.H. Joardder, Towards the effective plastic waste management in Bangladesh: a review, Environmental Science and Pollution Research, 24(35), 27021–27046, 2017, doi:10.1007/s11356-017-0429-9.
- Y.C. Moh, L. Abd Manaf, “Solid waste management transformation and future challenges of source separation and recycling practice in Malaysia,” Resources, Conservation and Recycling, 116(2017), 1–14, 2017, doi:10.1016/j.resconrec.2016.09.012.
- L. Milios, A.E. Davani, Y. Yu, “Sustainability impact assessment of increased plastic recycling and future pathways of plastic waste management in Sweden,” Recycling, 3(3), 2018, doi:10.3390/recycling3030033.
- E. Van Eygen, D. Laner, J. Fellner, “Circular economy of plastic packaging: Current practice and perspectives in Austria,” Waste Management, 72, 55–64, 2018, doi:10.1016/j.wasman.2017.11.040.
- R.U. Duru, E.E. Ikpeama, J.A. Ibekwe, “Challenges and prospects of plastic waste management in Nigeria,” Waste Disposal & Sustainable Energy, 1(2), 117–126, 2019, doi:10.1007/s42768-019-00010-2.
- H.H. Khoo, “LCA of plastic waste recovery into recycled materials, energy and fuels in Singapore,” Resources, Conservation and Recycling, 145, 67–77, 2019, doi:10.1016/j.resconrec.2019.02.010.
- L. Peake, Plastic waste in the United Kingdom, Academic Press.
- S.M. Nxumalo, S.D. Mabaso, S.F. Mamba, S.S. Singwane, “Plastic waste management practices in the rural areas of Eswatini,” Social Sciences & Humanities Open, 2(1), 100066, 2020, doi:10.1016/j.ssaho.2020.100066.
- Y.C. Jang, G. Lee, Y. Kwon, J. hong Lim, J. hyun Jeong, “Recycling and management practices of plastic packaging waste towards a circular economy in South Korea,” Resources, Conservation and Recycling, 158, 104798, 2020, doi:10.1016/j.resconrec.2020.104798.
- C. Liu, T. Thang Nguyen, Y. Ishimura, “Current situation and key challenges on the use of single-use plastic in Hanoi,” Waste Management, 121, 422–431, 2021, doi:10.1016/j.wasman.2020.12.033.
- M. E. Hall, Belgium takes out the trash, EURACTIV, 2015.
- Plastics Europe, Plastics – the Facts, 2018.
- Z.S. Mazhandu, E. Muzenda, M. Belaid, T.A. Mamvura, T. Nhubu, “Incineration as a potential solution to Africa’s plastic waste challenges: A narrative review,” in 2020 International Conference on Energy, Environment and Storage of Energy (ICEESEN), Kayseri, Turkey, 2020.
- European Commission, New Waste Rules Will Make EU Global Front-Runner in Waste Management and Recycling, 2018.
- Worldometer, Belgium Population 2020, 2020.
- J. M. Simon, And the European Waste Champion is… Belgium!, Zero Waste Europe, 2015.
- Fostplus, Organisation, 2020.
- E. C. Gentil, Municipal Waste Management in Belgium, EEA, 2013.
- Worldometer, Australia Population 2020, 2020.
- Wikipedia, States and Territories of Australia, 2020.
- Department of the Environment, Water, Heritage and the Arts, Waste and Recycling Publications: Employment in Waste Management and Recycling, Australian Government, 2009.
- Department of the Environment and Energy, National Waste Policy Action Plan 2019, Australian Government, 2019.
- K. Willis, C. Maureaud, C. Wilcox, B.D. Hardesty, “How successful are waste abatement campaigns and government policies at reducing plastic waste into the marine environment?,” Marine Policy, 96, 243–249, 2018, doi:10.1016/j.marpol.2017.11.037.
- KAB, Keep Australia Beautiful, 2020.
- Department of Agriculture, Marine Debris Including Plastic Pollution, Australian Government, 2020.
- APCO, ANZPAC Plastic Pact, Australian Packaging Covenant Organisation, 2020.
- Worldometer, South Korea Population 2021, 2021.
- Wikipedia, Provinces of South Korea, 2021.
- Wikipedia, Recycling in South Korea, 2021.
- Anglo Info, Waste Disposal and Recycling in South Korea, 2021.
- N. McCarthy, Chart: The Countries Winning the Recycling Race, Statista, 2016.
- T. Parker, From Australia to Wales: The Five Best Recycling Countries in The World, NS Packaging, 2020.
- Earthsquad, Plastic recycling in South Korea, 2021.
- Wastemetasia, Waste Management Policies in South Korea, 2020.
- Y. Jun-suk, Breakdown of Korea’s Recycling Process, Korea Herald, 2015.
- D. Ng, In South Korea, a Lesson to Be Learned from A Plastic Waste Crisis, CNA Insider, 2018.
- Worldometer, Canada Population 2021, 2021.
- Trip Savvy, Guide to Canadian Provinces and Territories, 2020.
- Wikipedia, Environment and Climate Change Canada, 2021
- CCME, Aspirational Canada-wide Waste Reduction Goal, Canadian Council of Ministers and of the Environment, 2018.
- CCME, Strategy on Zero Plastic Waste, Canadian Council of Ministers and of the Environment, 2018.
- IUCN, IUCN Endorses Global ‘Oceans Plastics Charter, International Union for Conservation of Nature, 2019.
- CCME, Canada-wide Action Plan on Zero Plastic Waste Phase 1, Canadian Council of Ministers of the Environment, 2019.
- CCME, Canada-wide Action Plan on Zero Plastic Waste Phase 2, Canadian Council of Ministers of the Environment, 2020.
- Deloitte and Cheminfo Services Inc., Economic Study of The Canadian Plastic Industry, Markets and Waste, 2019.
- South Africa Travel Online, South Africa’s Provinces, 2017.
- South African Government, Local Government, 2019.
- WWF, Plastic, World Wide Fund for Nature, 2020.
- H. Ritchie, M. Roser, Plastic Pollution, Our World in Data, 2018.
- J.R. Jambeck, R. Geyer, C. Wilcox, T.R. Siegler, M. Perryman, A. Andrady, R. Narayan, K. Law, “Plastic Waste Inputs from Land into The Ocean,” Science, 347(6223), 768–771, 2015, doi:10.1126/science.1260352.
- C. Verster, H. Bouwman, “Land-based sources and pathways of marine plastics in a South African context,” South African Journal of Science, 116(5–6), 1–9, 2020, doi:10.17159/sajs.2020/7700.
- DEA, South Africa-State of Waste Report, Department of Environmental Affairs, 2018.
- WWF, Legal Framework Study of Extended Producer Responsibility, World Wide Fund for Nature, 2019.
- C. Rodseth, P. Notten, H. von Blottnitz, “A revised approach for estimating informally disposed domestic waste in rural versus urban South Africa and implications for waste management,” South African Journal of Science, 116(1–2), 2020, doi:10.17159/sajs.2020/5635.
- APWC, South Africa – Waste Classification Report, The Commonwealth Litter Programme, Asia Pacific Waste Consultants, 2020.
- Plastics SA, Key Statistics from Latest Recycling Report, 2019.
- L. Godfrey, S. Oelofse, “Historical review of waste management and recycling in South Africa,” Resources, 6(4), 57, 2017, doi:10.3390/resources6040057.
- SAPRO, About Us, South African Plastics Recycling Organisation, 2020.
- Trading Economics, South Africa Imports of Plastic & Rubber Articles, 2020.
- D. Workman, South Africa’s Top 10 Imports 2019, World’s Top Exports, 2019.
- BPF, Plastic Recycling, British Plastics Federation, 2020.
- DEA, National Waste Management Strategy, Department of Environmental Affairs, 2020.
- C. Steyn, Briefing on the Progress of the South African Plastics Sector, DTI, 2015.
- Plastics SA, Plastics Industry Shows Its Support for Waste Pickers During Lockdown, 2020.
- SAPRO, Why Recycle, South African Plastics Recycling Organisation, 2020.
- DEA, National Waste Management Strategy, Department of Environmental Affairs, 2019.
- DEA, National Waste Management Strategy 2011, Department of Environmental Affairs, 2011.
- DEA, Working on Waste, Department of Environmental Affairs, 2019.
- O. Taiwo, F. Otieno, C. Venter, “Towards attaining the Polokwane waste reduction goals – where are we?,” Town and Regional Planning, 2008 (53), 25-31, 2008, doi:10.10520/EJC108684.
- D.A.R. George, B.C. Lin, Y. Chen, “A circular economy model of economic growth,” Environmental Modelling and Software, 73, 60-63, 2015, doi:10.1016/j.envsoft.2015.06.014.
- UNEP, Single-Use Plastics: A Roadmap for Sustainability, United Nations Environment Programme, 2018.
- DEA, Department of Environmental Affairs Strives to Improve Plastic Bag Recycling in South Africa, Department of Environmental Affairs, 2017.
- DEA, Minister of Environment, Forestry and Fisheries, Ms Barbara Creecy Hosts Plastic Colloquium, Department of Environmental Affairs, 2019.
- DEA, Minister Edna Molewa Calls on South Africans to Join Hands to Eradicate Plastic Pollution, Department of Environmental Affairs, 2018.
- Operation Phakisa, Chemical and Waste Economy, Department of Planning, Monitoring and Evaluation, 2017.
- DEFF, Minister Drives Thuma Mina Call for a Cleaner SA, Department of Environment, Forestry and Fisheries, 2018.
- South African Government, Good Green Deeds, 2019.
- Pikitup, Mandatory Separation at Source Frequently Asked Questions, 2020.
- K. Wilson-Harris, Recycling Codes – Understanding the Plastic Recycling Codes, Proficient Packaging, 2021.
- GreenCape, Waste: 2020 Market Intelligence Report, 2020.
- DEA, South Africa commemorates International Coastal Clean-Up Day, Department of Environmental Affairs, 2018.
- City of Johannesburg, Mayor Makhubo takes Kleena Joburg Campaign to Alexandra, 2020.
- Two Oceans Aquarium, Rethink the Bag for a Single-Use Plastic Shopping Bag Free South Africa, 2020.
- A. Nahman, “Extended producer responsibility for packaging waste in South Africa: Current approaches and lessons learned,” Resources, Conservation and Recycling, 54(3), 155–162, 2010, doi:10.1016/j.resconrec.2009.07.006.
- V. Mrkajić, N. Stanisavljevic, X. Wang, L. Tomas, P. Haro, “Efficiency of packaging waste management in a European Union candidate country,” Resources, Conservation and Recycling, 136, 130–141, 2018, doi:10.1016/j.resconrec.2018.04.008.
- J. Park, N. Díaz-Posada, S. Mejía-Dugand, “Challenges in implementing the extended producer responsibility in an emerging economy: The end-of-life tire management in Colombia,” Journal of Cleaner Production, 189, 754–762, 2018, doi:10.1016/j.jclepro.2018.04.058.
- W. Leal Filho, U. Saari, M. Fedoruk, A. Iital, H. Moora, M. Klöga, V. Voronova, “An overview of the problems posed by plastic products and the role of extended producer responsibility in Europe,” Journal of Cleaner Production, 214, 550–558, 2019, doi:10.1016/j.jclepro.2018.12.256.
- K. Raubenheimer, N. Urho, “Rethinking global governance of plastics – The role of industry,” Marine Policy, 113, 2020, doi:10.1016/j.marpol.2019.103802.
- H. Shan, J. Yang, “Promoting the implementation of extended producer responsibility systems in China: A behavioral game perspective,” Journal of Cleaner Production, 250, 119446, 2020, doi:10.1016/j.jclepro.2019.119446.
- F. de M. Ribeiro, I. Kruglianskas, “Critical factors for environmental regulation change management: Evidences from an extended producer responsibility case study,” Journal of Cleaner Production, 246, 119013, 2020, doi:10.1016/j.jclepro.2019.119013.
- StatsSA, Only 10% of waste recycled in South Africa, Statistics South Africa, 2020.
- European Commission, Generation Awake Resource Efficiency Campaign Video, 2011.
- European Commission, Generation Awake, 2011.
- W. Allen, Sustainability: Six Ways to Influence Behavior Change, Learning for Sustainability, 2016.
- DEA, South Africa: A Water Scarce Country, Department of Environmental Affairs, 2011.
- N. Manyana, Pilot Plastic Road Completed in Jeffreys Bay, Infrastructure News, 2019.
- UNICEF, UNICEF breaks ground on Africa’s First-of-its-Kind Recycled Plastic Brick Factory in Côte d’Ivoire, United Nations International Children’s Emergency Fund, 2019.
No related articles were found.