Numerical Analysis for Feature Extraction and Evaluation of 3D Sickness

Adv. Sci. Technol. Eng. Syst. J. 6(2), 949–955 (2021);
 DOI: 10.25046/aj0602108
Artificial intelligence (AI) systems have been applied not only to numerical simulations of the economical sequences but also to the bio-signal, for instance, the statokinesigrams (SKGs). According to the nonlinear analysis of the bio-signal, we have considered that the motion process of the body sway is more random than that of the other bio-signal. In this study, we proposed a method for the numerical analysis of biological data using AI. The AI numerical solutions can indicate graphs that are very similar to the SKGs in degree of the determinism. In addition, we succeeded in extracting partial figure patterns that the AI regarded as a feature of 3D sickness. Compering with the properties resulting from the mathematical analysis, interpretations can be given for the black box processing in the AI.
1. Introduction
In recent years, artificial intelligence (AI) has been incorporated into the automatic algorithms for buying and selling stocks and bonds. NASDAQ-100, actual stock prices, Standard & Poor’s 500 Stock Index, and historical exchange rates have been analyzed to develop an automated trading algorithm. However, when using past stock price fluctuations, there is a drawback in that the test pattern is limited. In addition, when the time series generated by the stochastic process is used, there is a drawback wherein the actual fluctuation of the stock price is not reflected. Therefore, neither case is sufficient to trust the test results. In this study, we attempted to create a mathematical model that can generate innumerable fluctuation patterns after reflecting the fluctuation characteristics of the time series. In previous studies, the generative adversarial network (GAN) was applied to the time-series generation of exchange rates. GAN is attracting attention because it has succeeded in generating high-precision images. Stationarity [1], fractalness [2], and determinism [3] were measured to compare the actual exchange rates with the pseudo exchange rates generated by GAN. Using these indices, we also measured the similarity between the actual exchange rates and the time series generated by the Winner process [4]. From the stationary perspective, the pseudo-exchange rates generated by GAN showed higher similarity than those of the Winner process, and from the deterministic point of view, both showed higher similarity.
On February 2, 2018, the Dow Jones Industrial Average had the largest decline to date [5]. The actual reason for this decline has not been clarified, but one of the possible causes cited by market participants is continuous selling, such as a chain of automatic loss cuts by the AI or automatic trading algorithms [6]. As a similar example, from March 9th to 18th, 2020, the decline in Standard & Poor’s 500 Stock Index triggered four circuit breakers, temporarily suspending trading on the NYSE and NASDAQ [7–10]. This may indicate that the introduction of AI or automated trading algorithms is accelerating in financial markets. Some financial institutions, for instance, offer mechanical investment services to consumers. These services have solved the wealth-management problem of the general public.
However, mechanical investment services using AI cannot always protect assets. This is because reliability and robustness of the system is insufficient, owing to the limited number of tests. As mentioned above, the automatic trading algorithm uses past fluctuations in stock prices and exchange rates. In addition, even if the results look good at first glance, they may be overfitting to past fluctuations. To solve this problem, we propose an evaluation using a new simulated time series that does not depend only on historical data of past stock prices and exchange rates. It is conceivable to use the stochastic process as an idea to generate a simulated time series, but so far, many researchers have considered the stock price as the stochastic process [11, 12]. Another approach is the generation of a simulated time series by GAN. In previous studies, the pseudo-exchange rate generated by GAN showed higher similarity to the actual exchange rate in terms of stationarity than the time series generated by the Winner process. In terms of determinism, both showed high similarity.
The body sway is of particular interest regarding the assessment of changes in the postural control, as it is highly related to the risk of falling [13]. In the stabilometry, displacement in the center of pressure (CoP) is recorded in the medial-lateral (x) and the anterio-posterior (y) directions as a statokinesigram (SKG). In the SKGs, variables x and y are regarded to be independent [14]. The linear stochastic differential equation (Brownian motion process) has been proposed as a mathematical model to describe the body sway [15–17].
Therefore, the purpose of this study was to establish a new numerical simulation method for biological signals using the same method as the numerical simulation in the exchange rate. We examined whether it is possible to generate a highly accurate simulation for the SKGs by applying the GAN to the SKGs with an unknown mechanism by which 3D images affect the CoP. In addition, if we were able to generate SKGs, we would also verify whether the characteristics of SKGs could be visualized.
2. Mathematical Model
Stochastic differential equations (SDEs)

have been proposed as mathematical models describing the body sway [18-20], where μ and ω represent the noise amplitude and the Gaussian white noise, respectively. In Eqs.(1.1)-(1.2), the time-average potential functions in the x– and y-directions are expressed as and , respectively. These functions were estimated from
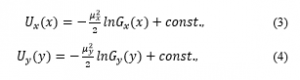
where distributions in the x– and y-directions are expressed as and , respectively. Each distribution is determined as a histogram for each component in the experiment. In some studies, the SDEs have been applied to conduct the numerical analysis of the body sway, however, there is no research using the AI. Using the AI, we perform a numerical simulation in this research.
3. Model Design
3.1. GAN
In recent years, neural network models, for instance, convolutional neural networks (CNNs) have been used as image- classification models [21].

Figure 1: GAN model.

Figure 2: Constructed GAN model: generator (a), discriminator (b).
In addition, deep-neural-network, which are deeply stacked CNNs, has been used not only for image classification but also for a wide range of applications such as object detection [22], semantic segmentation [23], and the image generation [24]. Two advantages of the GANs use are that it is not necessary to define properties in the images to be generated beforehand, and that a number of images can be generated by using noise as the input to the network. In this study, the GAN was applied to the generator of time series. We can generate time series for the numerical simulation.
In this study, simulative time series (i.e., fake data) can be obtained from the generator G, which is defined as a network input noise. As the side note, the discriminator D distinguishes whether generated data are real (i.e., true data). “G” learns so that “D” determines the fake data as genuine. Inversely, “D” learns so that it can correctly determine whether the input data is true data or false data generated by “G”. By repeatedly learning these networks (Figure 1), it can be generated for a large number of simulated time series if the output of “G” can generate data that is very close to true data.
3.1. Learning Statokinesigrams in GAN Model
It has been reported that it is difficult to stabilize in the GAN learning. Several models were, in fact, designed and trained to generate pseudo-exchange rates, however, few models could be found to exhibit stable learning. The way has been already suggested how to stabilize the GAN learning [25]. Based on these proposals, the hyperbolic tangent function (tanh) was herein used as an activation function in the output layer of the generator. LeakyReLU was used as an activation function, except for the output layer/fully connected layer in “D” [26]. The hyperbolic tangent function is defined as
The advantage of using Eq. (4) is firstly that it can output any input value within the range of -1 to 1, thus reducing numerical divergence. Secondly, the hyperbolic tangent function does not have a large maximum value of the differential coefficient, which makes it stop vanishing gradients.
3.2. Parameter Optimization
To design a neural network model that achieves the desired performance, it is necessary to adjust the layer configuration to the optimum configuration. In general models for classification and prediction, the accuracy rate is often used as the objective variable [27]. However, because the aim of this study is to simulate the characteristics of SKGs, it cannot be evaluated using the accuracy rate. Therefore, it is necessary to define a new objective variable. In this study, we defined the following optimization function using the learning error for “G” and “D”, which was developed in a previous study [28].
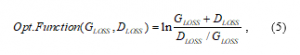
where the training error for “G” and the training error for “D” are expressed as and , respectively.
In this study, parameters in the GAN model (see Appendix) were set to minimize the value of the optimization function [29]. The value was evaluated after the parameters were optimized. It should be noted that the parameters in “D” was fixed because of the high computational expense (Table 1). Figures 2 show the a generator model and a discriminator model developed in this study. The “G” uses the combination input of noise and the label. In the subsequent generation process, a branch structure was added so that the variables x and y could be generated independently. This is based on the idea that the variables x and y are considered to be independent in the body sway. The “D”, in contrast to the “G”, did not have a branched structure. This is because both series are referred to when determining the state of body sway.
Table 1: Network configuration in the discriminator.
| Layers | Layer Name | Units | Kernel Size | Filters | Output Shape | Activation |
| 0 | Input | – | – | – | – | – |
| 1 | Convolution | – | 1×3 | 32 | 2×600 | LeakyReLU |
| 2 | Convolution | – | 1×3 | 64 | 2×300 | LeakyReLU |
| 3 | Convolution | – | 1×3 | 128 | 2×150 | LeakyReLU |
| 4 | Convolution | – | 1×3 | 256 | 2×75 | LeakyReLU |
| 5 | Convolution | – | 1×3 | 512 | 2×38 | LeakyReLU |
| 6 | Convolution | – | 1×3 | 32 | 1×38 | LeakyReLU |
| 7 | Flatten | – | – | – | 1216 | – |
| 8-1 | Dense | 32 | – | – | 32 | LeakyReLU |
| 9-1 | Dense | 32 | – | – | 32 | LeakyReLU |
| 10-1 | Dense | 1 | – | – | 1 | Sigmoid |
| 8-2 | Dense | 32 | – | – | 32 | LeakyReLU |
| 9-2 | Dense | 32 | – | – | 32 | LeakyReLU |
| 10-2 | Dense | 1 | – | – | 1 | Sigmoid |
4. Experiment
In this study, we measured the sway of the CoP of the elderly for the GAN learning. Next, pseudo SKGs were generated by the numerical simulation. Finally, SKGs was colored using a GAN discriminator to visualize the characteristics of the sickness.
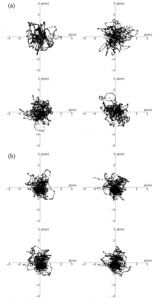
Figure 3: Typical SKGs: (a) measured data, (b) AI simulations
4.1. Measurement
In order to investigate the effects of stereoscopic video clips on the elderly, the body sway was simultaneously measured with the radial motion while/after viewing 2D/3D video clips for 60 s. In this experiment, 204 SKGs were observed from the elderly subjects that stood with Romberg posture on a gravicorder GS3000 (Anima Corp. Ltd., Tokyo) [30]. The SKGs were recorded at 20 Hz sampling in this experiment, which was approved by the Ethics Committee of the Graduate School of Information Science, Nagoya University.
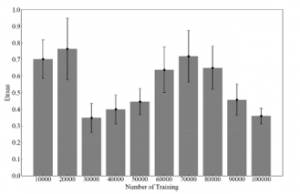
Figure 4: Translation errors for each learning step in the simulation of SKGs.
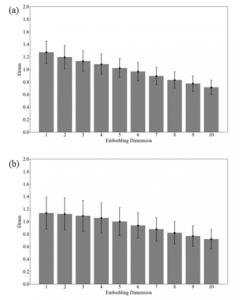
Figure 5: Translation error in SKGs: measured data (a), simulation pattern (b).
The results have shown that, in the elderly, the equilibrium function is affected while/after tracking the visual target in 3D video clips without statistical significance (sickeness-induced) [30]. Based on the previous studies on visually induced motion sickness (VIMS) [18-20], [30], the motion sickness is expected to be induced after/while viewing 3D video clips rather than 2D ones.
4.2. Simulation
In the constructed GAN model, it was confirmed that the machine-learning was not stable due to the small amount of raw data. Therefore, independent two-dimensional noise was generated from the Winner process, and one million time series were obtained for each component. Using the weights of the GAN model obtained from this learning process, the model was reconstructed so that GAN simulation that imitated the SKGs of 204 cases in the measurements could be generated (Tables 1–2). At this time, the information is also input to “D” to determine whether the input data is a sickness-induced SKGs or a sickness-free SKGs in addition to the condition whether the input data is raw data or fake data and determines. A total of 100,000 steps were learned. Thus, 2D/3D video clips are herein regarded as visual stimulus that do not/do induce the VIMS, respectively. SKGs generated from the GAN every 10,000 steps was evaluated by calculating the translation error using the Wayland algorithm [31–32].
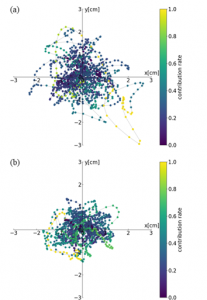
Figure 6: Patterns in SKGs that visualizes the characteristics of the following observation: sickness-induced (a), sickness-free (b)
4.3. Visualization of 3D Sickness Criteria
Using the trained GAN, the data obtained from the subject with the VIMS and the those without sickness were firstly input into the ”D”, respectively. Secondly, outputs of the intermediate layer close to the output layer were recorded to calculate the contribution rate for the discrimination of the VIMS. Lastly, the input SKGs were a colored with values of the contribution rate.
5. Results and Discussion
For the simulation SKGs (Figure 3b) generated by the GAN, the translation error was calculated every 10,000 steps using the Wayland algorithm (Figure 4). As a result, the value was approximately 0.7 after the machine learning up to 20,000 steps, and it decreased sharply to approximately 0.3 after 30,000 steps. After that, values of translation error increased to 70,000 steps again, and then decreased in learning after 80,000 steps. The GAN simulation might be influenced by the Winner process used for the pre-learning. That is why values of the translation error was high up to 20,000 steps. After that, the influence of the Winner process would be weakened around 30,000 steps. It was considered that the influence of the SKGs observed up to 70,000 steps gradually increased. After that, mode collapse might occur during the GAN-learning process. That is why values of the translation error decreased again after 80,000 steps. Mode collapse is a problem in which the generated data become similar because the variation of the data generated by “G” becomes smaller. This problem may occur in learning after 80,000 steps.
Next, the translation error of the observed SKGs (Figure 3a) are compared with that of the GAN simulation (Figure 3b) after 70,000 steps in the GAN-learning. Both values were about 0.8 in 10-dimensional embedding space, indicating very similar determinism (Figures 5).
Finally, the SKGs was colored using a GAN discriminator to visualize the characteristics of the sickness (Figures 6). It could be seen that the sickness-induced SKGs were widespread with respect to the sickness-free SKGs. It has been also discovered that GAN captures the shape of the cusp as a factor to determine the sickness. The contribution rate to judge the sickness-induced SKGs has been enhanced by the trajectories of the cusp (Figure 6a). We succeeded in extracting partial figure patterns that the AI regards as a property of 3D sickness. Consistency can be seen in the figure patterns that have been also extracted by our previous mathematical method [33]. Compering with the properties resulting from the mathematical analysis, interpretations can be given for the black box processing in the AI.
6. Conclusion
In this study, we proposed a method for the numerical analysis of biological data using AI. So far, there have been many studies that have attempted numerical simulations using SDE, but there is no research that performs simulations using GAN and visualizes/extracts the properties of the time series as shapes. As a result, the possibility of SKGs simulation using GAN was suggested. In the next steps, we would like to accumulate fundamental knowledge so that simulations using GAN can be applied in all fields.
Conflict of Interest
The authors declare no conflict of interest.
Acknowledgment
This work was supported in part by the Japan Society for the Promotion of Science, Grant-in-Aid for Scientific Research (C) Number 20K12528.
- I. Matsuba, Statistics of long-term memory processes: Self-similar time series theory and method, Tokyo: Kyoritsu Shuppan, 2007. (In Japanese)
- H.E. Hurst, “Long-term storage capacity of reservoirs,” Transactions of the American Society of Civil Engineers, 116(1), 770–799, 1951.
- K. Aihara, T. Ikeguchi, T. Yamada, M. Komuro, Basics and applications of chaos time series analysis, Tokyo: Sangyo Tosho, 2000. (In Japanese)
- K. Nakane, H. Takada, T. Hirata, “On Generation of Pseudo Exchange Rate Using GAN,” IEICE Technical report, NLP2019-13 (2019-05), 71–76, 2019. (In Japanese)
- L.Wang, J. Wittenstein, “Dow Jones Industrial Average average, worst decline in history – drops nearly $1600,” Bloomberg, 2018. https://www. bloomberg.co.jp/news/articles/2018-02-06/P3PHW06TTDS601 (2020.3. 26)
- S. Ponczek, E. Popina, L. Wang, “Dow Average, who dropped-machine criminal theory emerging,” Bloomberg, 2018. https://www.bloomberg.co.jp/
news/articles/2018-02-06/ P3PJGE6JIJVN01 (2020.3.26) - N. Baker, S. Mamudi, “Do ‘Circuit Breakers’ Calm Markets or Panic Them?” Bloomberg, 2020-3-9. https://www.bloomberg.com/news/articles/2020-03-09/what-are-circuit-breakers-and-do-they-calm-markets-quicktake (2020.3. 26)
- C. Mullen, A. Haigh, “Only One Market Circuit-Breaker May Be Left: Controlling Virus,” Bloomberg, 2020-3-12. https://www. bloomberg.com /news/articles/2020-03-13/only-one-market-circuit-breaker-may-be-left-controling-virus (2020.3.26)
- C. Ballentine, “Stocks at Risk of Tripping Circuit Breakers as Rout Resumes,” Bloomberg, 2020-3-16. https://www.bloomberg.com/news/articles/2020-03-16/stocks-at-risk-of-setting-off-circuit-breakers-as-rout-resumes (2020.3. 26)
- V. Hajric, “Circuit Breakers for Stocks Triggered a Second Time in 3 Days,” Bloomberg, 2020-3-18. https://www.bloomberg.com/news/articles/2020-03-18/circuit-breakers-for-stocks-triggered-a-second-time-in-3-days (2020. 3.26)
- F. Black, M. Scholes, “Pricing of options and corporate liabilities, Journal of Political Economy, 81(3), 637–654, 1973.
- T. Tasaki, “Motion equation of for stock prices,” Bussei Kenkyu, 81(4), 518–519, 2004. (In Japanese)
- S. Porter, J. Nantel, “Older adults prioritize postural stability in the anterior-posterior direction to regain balance following volitional lateral step,” Gait & Posture, 41(2), 666-669, 2015.
- P.A. Goldie, T.M. Bach, O.M. Evans, “Force platform measures for evaluating postural control: reliability and validity,” Arch Phys. Med. Rehabil, 70, 510–517, 1989.
- R.E.A. Emmerrik, R.L.V. Sprague, K.M. Newell, “Assessment of sway dynamics in tardive dyskinesia and developmental disability: sway profile orientation and stereotypy,” Mov. Dis., 8, 305-314, 1993.
- J.J. Collins, C. J. De Luca, “Open loop and closed-loop control of posture: a random-walk analysis of center of pressure trajectories,” Exp. Brain Res., 95, 308–318, 1993.
- K.M. Newell, S.M. Slobounov, E.S. Slobounova, P.C. Molenaar. “Stochastic processes in postural center of pressure profiles,” Exp. Brain Res., 113, 158-164, 1997.
- H. Takada, M. Miyao, “Visual fatigue and motion sickness induced by 3D video,” Forma 27(Special Issue), 67–76, 2012.
- Y. Mori, Y. Maeda, H. Takada, “Numerical Analysis of Body Sway While Viewing a 3D Video Clip Without Perspective Clues,” LNCS, 9176, 238-245, 2015.
- F. Kinoshita, Y. Mori, M. Miyao, H. Takada, “On Mathematical Models of Two-Minute Stereoscopic Viewing on Human Balance Function,” Forma, 32, 11–17, 2017.
- K. Wakabayashi, T. Namatame, “Examination of applicability of deep learning to consumers’ purchasing behavior,” Journal of the Japan Social Data Science Society, 1(1), 48–57, 2017. (In Japanese)
- J. Redmon, S. Divvala, R. Girshick, A. Farhadi, “You Only Look Once: Unified, Real-Time Object Detection,” arXiv:1506.02640v5 [cs.CV], 2016.
https://arxiv.org/abs/1506.02640 (2021.3.15) - H. Wu, J. Zhang, K. Huang, K. Liang, Y. Yu, “Fast FCN: Rethinking Dilated Convolution in the Backbone for Semantic Segmentation,” arXiv:1903.11816v1 [cs.CV], 2019. https://arxiv.org/abs/1903.11816 (2021.3.15)
- I.J. Goodfellow, J. Pouget-Abadie, M. Mirza, B. Xu, D. Warde-Farley, S. Ozair, A. Courville, Y. Bengio, “Generative adversarial Nets,” 1–9, 2014.
- A. Radford, L. Metz, “Unsupervised representation learning with deep convolutional generative adversarial networks,” Proceedings of ICLR, 1–16, 2016.
- A.L. Maas, A.Y. Hannun, Y. A.Y. Ng, “Rectifier nonlinearities improve neural network acoustic models,” Proceedings of ICML, 30(1), 3, 2013.
- J. Snoek, H. Larochelle, R.P. Adams, “Practical Bayesian optimization of machine learning algorithms,” Proceedings of NIPS, 1–9, 2012.
- K. Nakane, R. Ono, S. Yamamoto, M. Takada, F. Kinoshita, A. Sugiura, Y. Matsuura, K. Fujikake, H. Takada, “Numerical Analysis of Body Sway for Evaluation of 3D Sickness,” The 15th International Conference on Computer Science & Education (ICCSE 2020), 2020, doi: 10.1109/ICCSE49874.2020. 9201640.
- K. Nakane, H. Takada, S. Yamamoto, R. Ono, M. Takada, “Numerical analysis of bio-signal using generative adversarial networks,” Lecture Note in Computer Science,12427, 601-613, 2020, doi: 10.1007/978-3-030-60152-2_44.
- N. Amano, H. Takada, Y. Johno, T. Tanimura, F. Kinoshita, M. Miyao, M. Takada, “Analysis of the body sway while/after viewing visual target movement synchronized with background motion,” LNCS, 10908, 3-14, 2018.
- R. Wayland, D. Bromley, D. Pickett, A. Passamante, “Recognizing determinism in a time series,” Physical Review Letters, 70, 580–582, 1993.
- H. Takada, T. Morimoto, H. Tsunashima, T. Yamazaki, H. Hoshina, M. Miyao, “Applications of Double-Wayland algorithm to detect anomalous signals,” Forma, 21(2), 159–167, 2006.
- H. Takada, Y. Kitaoka, M. Ichikawa, M. Miyao, “Physical Meaning on Geometrical Index for Stabilometry,” 62(3), 168-180, 2003.