LED Lighting and the Impact on the PLC Channel
Volume 6, Issue 2, Page No 933-941, 2021
Author’s Name: Allan Emleh1, Arnold de Beer1, Hendrik Ferreira2,a), Adrianus Han Vinck3
View Affiliations
1Center for Telecommunications, Department of Electrical and Electronic Engineering Science, University of Johannesburg, Johannesburg 2006, South Africa
2Faculty of Engineering, University of Johannesburg, Johannesburg 2006, South Africa
3Institute for Digital Signal Processing, University of Duisburg-Essen, Duisburg 47048, Germany
a)Author to whom correspondence should be addressed. E-mail: telecoms@uj.ac.za
Adv. Sci. Technol. Eng. Syst. J. 6(2), 933-941 (2021); ![]() DOI: 10.25046/aj0602106
DOI: 10.25046/aj0602106
Keywords: Light Emitting Diode, Power Line Communications, Interference, Noise, EMC

Export Citations
Light Emitting Diode (LED) lamps are used as a replacement of “old-fashioned” or incandescent lighting sources, as they reduce the amount of energy consumed. As a side-effect of more efficient energy usage they produce electrical noise. This noise reduces the efficiency of information signal transfer when Power Line Communications (PLC) are used. This study focuses on the noise signatures of LED lamps which have a direct impact on the information transfer of the PLC channel. The contribution of this study is that two categories of noise characterisations are given. First is equations describing the maximum and minimum bounds of the lamp noise current. This is useful in calculating channel throughput where an equation for the noise is required. For example, the Shannon-Hartley theorem. Second is a methodology to determine individual frequencies in the spectrum of harmonics emanating from the lamp. Both these characterisations will aid in designing communication schemes for PLC. An unexpected result of this study was to find LED lamps which had inadequate or no Electromagnetic Interference (EMI) filters. These lamps produce noise in orders of magnitude higher than properly filtered LED lamps.
Received: 06 November 2020, Accepted: 16 February 2021, Published Online: 10 April 2021
1. Introduction
Light Emitting Diode (LED) lamps or bulbs are used as a replacement of “old-fashioned” or incandescent lighting sources. They reduce the amount of energy consumed. As lighting is a main category in electricity consumption [1], improving efficiency of light sources are paramount to long term energy savings. Although LED lighting is more energy efficient its operation produces electrical noise [2]. This can have a detrimental effect on Power Line Communications (PLC) [3].
PLC is used in lieu of physical data cable connections or wireless connections such as Wi-Fi. Since power cables already connect different nodes possible to communicate, PLC usage is advantageous where a minimum of added infrastructure is required. An application of importance is for the Smart Grid [4]. It is envisaged that a future Smart Grid will control and schedule loads actively and in real time with PLC. By doing this, energy transfer via the electrical network will be optimised. In the future, households will communicate via the power lines (i.e. PLC) to not only provide control but also Information and Communications Technology ICT services. Since the electronics for using PLC is cheaper and radio spectrum need not to be used, PLC seems to be the economical option [5].
PLC is used to transmit and receive data across physical power cables. PLC systems are divided into so called Narrow Band (NB) and Broad Band (BB) types.
NB PLC is used for control signals with a low data rate and typically has a carrier frequency of up to 150 kHz [6,7]. BB PLC is used to convey internet on the power line in lieu of Wi-Fi. It has carrier frequencies typically up to 30 MHz [8]. For further investigation, readers are referred to [9-12].
The PLC channel can be viewed as a classical communications channel. In such a channel, the Shannon-Hartley equation [13] for information transfer holds or:
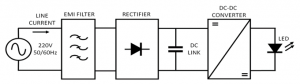
Figure 1: Bock diagram of a typical LED lamp of the type used in this study
![]()
where C is the maximum theoretical channel capacity in bits per second, B is the bandwidth of the channel in hertz, S the signal strength or averaged received signal power across the bandwidth in watts and N is the average power of the noise / interference across the bandwidth, also measured in watts. The purpose of this paper is to characterise N, as S and B are usually predetermined as follows:
- The signal strength S is subject to Electromagnetic Compatibility standards [14] where a maximum signal strength is specified.
- The bandwidth B is allocated by spectrum regulations.
It therefore stands to reason that in (1), C is determined by N if B and S are fixed. In this paper the noise characteristics of LED lamps (N in (1)) are investigated and measured. The noise spectra measured from the lamps can therefore be applied as the channel noise for a PLC channel.
This paper characterises the LED lamp noise spectra in two ways:
- First is to describe the noise spectrum across a band. Two bands have been chosen: 150 kHz for representing NB PLC and 30 MHz for representing BB PLC. In both cases the bands are characterized by equations giving an upper limit for maximum noise and lower limit for minimum created noise.
- The second part is to determine unique harmonics in the noise signature. It is shown that when zooming into the created noise spectra, certain harmonics (governed by switching and rectification) stand out and can uniquely be identified.
Results from both of these two vantage points can aid a designer in estimating channel throughput and designing modulation schemes for a channel with LED lamp noise present.
An unexpected result of this study was to find LED lamps which had inadequate or no Electromagnetic Interference (EMI) filters. These lamps produce noise in orders of magnitude higher than properly filtered LED lamps. This can have a large adverse effect on PLC channel throughput.
2. LED Lamp Structure
In this section a generic model of an LED lamp is proposed and used to explain how interference is created on the power line by the lamp operation. Lamps measured in this study follow this broad topology.
Figure 1 shows a high level block diagram of a typical LED lamp of the type that was measured in this study.
Starting at the left hand side of figure 1, is the source of 220VAC or 110VAC, 50 Hz or 60 Hz. This passes through an EMI filter. The filter reduces the noise being generated by the LED lamp as seen on the supply grid. One must not confuse the direction of main power flow with that of the noise. The main power flow is from left to right, AC supply to LED while noise is generated by the lamp circuitry and permeates through to the supply grid (right to left). A rectifier is used to produce DC from AC. At the rectifier output is a DC-link capacitor reducing the ripple on the DC link. A DC-to-DC converter is used to drive the LED. This converter usually operates with a current output as the brightness of the LED is determined by current through the LED but with a relatively constant voltage.
Figure 2 illustrates noise generation in an LED lamp. High frequency switching noise is produced by the DC-to-DC converter and present itself on the DC-link current. Conventional wisdom will have it that this high frequency noise (in the tens of kHz) will be supplied by the DC-link capacitor and not seen on the line. This is however not the case. The DC-link capacitor is rated for 50Hz/60Hz and have a large Equivalent Series Inductance (ESL). The capacitor ESL keeps it from by-passing the high frequency noise. Subsequently the DC-DC convertor noise travels through the rectifier (when a rectifying diode is conducting) and presents itself on the line current – superimposed on the nonlinear rectifier current shape.
EMI Filters are used to mitigate noise to below compliance levels [15]. These filters reduce noise from two noise sources. One is the high frequency noise from the DC-to-DC converter and another is line rectifier harmonics. It is interesting to note that some LED lamps have no EMI filters. This was found when using both local and imported brands. This is apparently done to save costs and where enforcement of EMI standards is not very strict. Typical results of LED lamp noise with sufficient EMI filtering vs those with low or no filter are shown later in this article.
Throughout this article noise from LED lamps is measured as current. Noise currents are converted to voltages after flowing thorough line impedances. These impedances are highly network specific and noise voltages will vary depending on the network
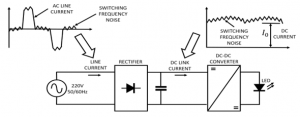
Figure 2: Illustration of LED lamp noise generated by the DC-to-DC converter and processed through the rectifier
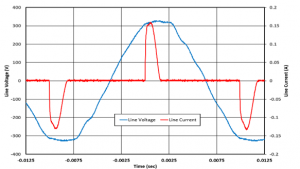
Figure 3: Measured input voltage to the LED lamp and current drawn for a 5.5W LED lamp at the AC line side
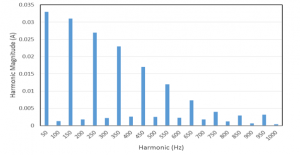
Figure 4: Measured harmonics for the input current drawn (figure 3) in a 5.5W LED lamp
configuration. The results given in this study is worst case as if the network is short and noise currents are directly converted to voltages.
3. Rectification
As can be seen in figure 2, DC-link current is converted from a predominant DC current at the DC-link capacitor to the typical wave shape of current through a rectifier. For details see [16] and [17]. The difference between a normally rectified current at the input to the rectifier is the presence of high frequency noise in a LED lamp. This is the “switching frequency noise” shown in figure 2. In this study two “types” of noise are investigated; the low frequency rectifier noise (and subsequent harmonics) and the high frequency switching noise. This section deals with the rectifier noise (or creation of rectifier harmonics) while the rest of this paper deals with the added high frequency switching noise.
As an example, measured time domain line voltage and current waveforms for a 5.5W LED lamp are given in figure 3. For this low frequency (50 Hz to 1 kHz) time domain measurement, voltage and current probes (Tektronix TCP0030) were directly attached at the line side of the LED lamp. A Tektronix (DPO7254) oscilloscope was also used in this experimental measurement.
Figure 4 gives the line current harmonics for the current waveform of figure 3 up to 1kHz. It shows current components (harmonics) in 50Hz intervals – as the fundamental is 50Hz. It is important to take note of this spectrum shape as it becomes the modulating function for the DC-to-DC converter switching (carrier) frequencies – as showed later in this paper.
4. High Frequency Measurement Set-Up
Figure 5 shows the current measurement setup for higher frequencies (typically up to tens of MHz). This set-up is different from that of the previous section where the voltage and the current were of relatively low frequency (up to 1kHz) and in Differential Mode (DM) only. In the previous section voltage and current were directly measured on the incoming line. Higher frequency conducted noise usually has components in both differential and Common Mode (CM). Since the PLC channel is differential in nature, measurements were made in DM and CM discarded. The CM contribution of the LED lamp noise source was cancelled as shown by the routing of the power cables through the high frequency current probe in figure 5.
Also shown in figure 5 is a Line Impedance Stabilisation Network (LISN). This device supplies the lamp with 220V/50Hz for power but blocks higher frequency noise from the supply network from interfering with the measurement side noise that is generated by the LED lamp. Since it has a high leakage current to earth, an isolation transformer is used; keeping the LISN from tripping the protective earth leakage. The LISN also provides a standardised high frequency noise load impedance to the noise generating LED lamp.
The high frequency current harmonics produced by the LED lamp are measured using a Rhode & Schwarz FSH323 Spectrum Analyzer and ETS-Lindgren 94111-1L 1GHz bandwidth current probe and processed by a PC.
5. Measurement Results
Using the measurement set-up of figure 5, the noise current of different LED lamps was measured. Figure 6 shows results for a measurement span of 30MHz. This span is representative of a broad band high frequency PLC operating region. Figure 6 also shows the Electromagnetic Compatibility (EMC) Limits (according to EN55015: 2013 for lighting) – for reference. Background noise levels were conducted with the set-up as shown in figure 5, but with the power switched off.
Some of the LED lamps do not produce noise current significantly above the background noise levels. Two of the measured LED lamps however, produce noise levels comparable and exceeding the EN55015 limit – implying non-compliance. Note that in the original EN55015 specification, the noise limit is indicated in volts generated across the LISN impedance. This was converted to a current limit by using the DM LISN impedance for comparison in figure 6.
The large difference in interference produced by different LED lamps is due to the inclusion (or exclusion) of an EMI filter in the product. Lamps that produce noise current at levels just above the background have EMI filters. The FS200 and 3W LED lamps in figure 6 do not have or have limited EMI filtering and are therefore noisy.
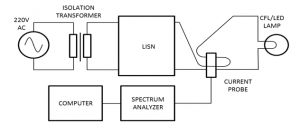
Figure 5: Measurement set-up for higher frequencies
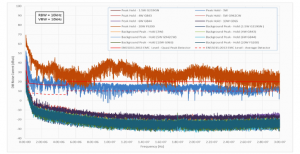
Figure 6: Noise current measurements for different LED lamps across a span of 30MHz
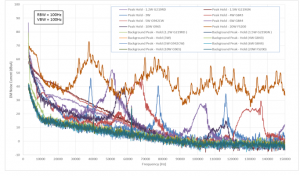
Figure 7: Noise current measurements for different LED lamps across a span of 150kHz
With the same set-up as in figure 5, measurements were taken across a span of 150kHz. This span is equal to the so called ‘CENELEC’ band (or Narrow Band) [14] for low frequency PLC operation. The results are shown in figure 7. As with the results across 30MHz (figure 6), measurements of the background noise floor were done to compare noise contributions of the different LED lamps.
Figure 7 clearly shows the switching frequency spectrum of the DC-DC converter part (see figure 1) of the different LED lamps. As examples, the FS200 type and a 3W type switch around 40kHz (switching fundamental). Harmonics are present around 80kHz (2nd harmonic) and 120kHz (3rd harmonic). The other LED lamps’ noise spectra that is above the noise floor also follow this pattern.
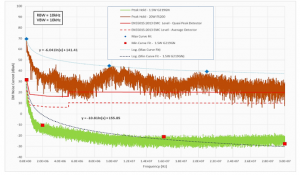
Figure 8: Curve fitting to noise current measurements for different LED lamps across a span of 30MHz
An interesting aspect of the measurements done is that at higher frequencies (kHz and MHz) the power line noise is not influenced primarily by the amount of power consumed. It is rather a function of the quality of the EMI filters and the original amount of noise produced (pre-filtered). For example, in figure 7, the 1.2W type G219RD generates more noise than the 10W, G965 type. It has been found that some LED lamps do not contain EMI filters (or inadequate filtering) – especially produced for the local market where EMI regulations are not strictly enforced.
6. Bounds on Interference Through Curve Fitting
To use the interference measurements in an equation (for example (1)), it is convenient to have an expression for the noise current. To this end, the worst case noise current spectra (upper bounds) in figure 6 and figure 7 were curve fitted. A typical low noise LED lamp from figure 6 and figure 7 were also curve fitted giving to give a maxima and minima (lower bound) for figure 6 as well as for figure 7.
The table below illustrates the peak values obtained from all LED lamps used for experimental measurements in figures 6 and 7.
Table 1: Summary of significant values obtained from figures 6 &7
| LED Size (Watt) | Noise Frequency (kHz) | Noise Value (dBµA) | ||
| Figure 6 | Figure 7 | Figure 6 | Figure 7 | |
| 1.5 | 1900 | 17 | -10 | 13 |
| 3 | 3200 | 38 | 25 | 46 |
| 4 | 1200 | 67 | 0 | 48 |
| 5 | 3000 | 12 | -4 | 35 |
| 6 | 1500 | 52 | 4 | 53 |
| 10 | 1600 | 57 | 3 | 40 |
| 20 | 3600 | 38 | 47 | 73 |
Figure 8 shows the curve fitting results across a 30MHz span with data taken from figure 6. The expression for the upper bound noisiest LED lamp (FS200) is:
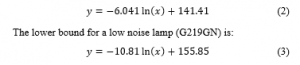
The y-values are the noise current in dBµA and the x-values the frequency in Hz.
Figure 9 shows the curve fitting results across a 150kHz span with data taken from figure 7. The expression for the upper bound of the noisiest LED lamp (FS200) is:
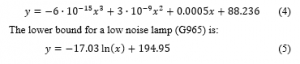
The y-values are the noise current in dBµA and the x-values the frequency in Hz.
7. Amplitude Modulation
The bounds expressed in the previous section are useful when uniform noise spectra are used to determine PLC channel interference across a large bandwidth. This section however, shows how a high frequency carrier signal (for example a single converter switching frequency harmonic) is modulated by a lower frequency signal (the rectifier harmonic spectrum (see figure 4)). This leads to determining specific harmonic content as opposed to the blanket bound description where specific frequencies are not addressed. This is useful to know when particular frequencies interfere with the PLC. If this happens either the NB PLC carrier must be shifted or the switching frequency of the DC-to-DC converter or both.
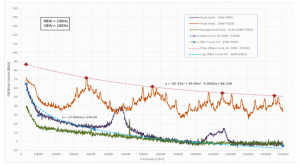
Figure 9: Curve fitting to noise current measurements for different LED lamps across a span of 150kHz
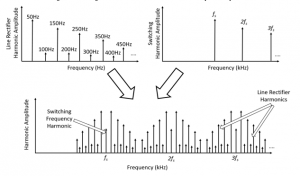
Figure 10: Spectrum of the line current consisting of the combination of the DC-to-DC converter switching harmonics and the line rectifier harmonics (flipped around the converter switching harmonics).
Figure 2 shows how high frequency switching noise is permeated by the DC-to-DC converter to appear at the LED lamp input. This converter noise is also seen on the DC link current. The high frequency switching noise is exaggerated in figure 2 for illustration purposes. The DC link capacitor is usually not sufficient to reduce this noise as the capacitor is large with a significant Equivalent Series Inductance (ESL).
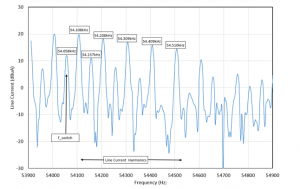
Figure 11: Measured line current harmonics around a switching frequency of 54.058 kHz for a 5.5W LED lamp from a 50 Hz supply. The harmonics surrounding the switching frequency are similar than the rectifier harmonics and spaced in 50 Hz increments
In the rest of this section it is shown how the harmonics surrounding the switching frequency are similar than the rectifier harmonics and spaced in 50 Hz increments. This is graphically illustrated in figure 10. Using the structure of an LED-lamp as shown in figure 1 and the extended version showing noise added from the lamp in figure 2, the harmonics of the line current are graphically illustrated in figure 10. Figure 11 shows a practical measurement that is a part of the spectrum shown at the bottom of figure 10.
The bottom graph of figure 10 is a harmonic interpretation of the line current seen at the input of the LED lamp. This line current spectrum is a convolution of two noise source spectra. The first is the high frequency switching harmonics of the DC-to-DC converter and the second is the low frequency line rectifier harmonics. The line current rectifier spectrum is repeated (in frequency components) by the switching frequency harmonics. Every switching frequency harmonic is flanked with the positive and negative of the rectifier spectrum.
To show this theoretically (and to simplify the mathematics), a single carrier (switching frequency harmonic) is shown to be modulated by a single low frequency harmonic (rectifier frequency).
The rest of this section shows theoretically how the process of figure 10 works. The line current signature frequencies are illustrated by simplifying the mathematics to use a single frequency amplitude modulating a higher single frequency carrier. Say for example a low frequency ωlf=2πf (f=50Hz) is modulating a carrier of higher switching frequency ωhf (around 55 kHz). With reference to figure 2, ωhf is representing the switching frequency noise on top of the DC link current and ωlf the line frequency at the lamp input.
From [18] it can be shown that the first harmonic of an ideal single-phase rectifier line current can be written as:
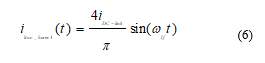
An idealized constant DC link current of I0 is specified in [18]. A high frequency switching converter will draw a high frequency current from the source through the rectifier. The DC-link current (for the first harmonic of switching converter current) is:
![]()
The modulation index is m= I0/Ihf and generally m >> 1, as the switching harmonic current is much smaller than I0 in practical converters. Combining (6) and (7) and using trigonometrical identities, the idealized single harmonic line current is:
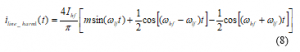
Equation (8) shows an AM signal with fundamental at ωlf and sidebands (of distance ωlf) around ωhf. This pattern, where the rectifier harmonics present around the switching frequency and its harmonics are experimentally shown in figure 11. Note that the carrier (ωhf or f_switch) is not present (or suppressed) as with a conventional AM signal as m >> 1.
If the spectrum is enlarged around the first switching frequency (54.058 kHz in figure 11) the line current harmonics become clearly visible in 50Hz increments and is indicative of a switching converter / rectifier combination. In this case, the carrier (f_switch) is not dominant as with a conventional AM signal.
An EMI signal from a LED lamp can thus be identified by first finding the switching harmonics. Around the switching harmonics will be the rectifier spectrum with main components flipped at f_switch ± 50Hz, f_switch ± 150Hz, f_switch ± 250Hz and so on (in the case of a 50Hz line frequency).
8. Conclusion
In this paper it is argued that noise from an LED lamp can interfere with PLC. The LED lamp noise will have an impact on the PLC channel throughput. It is argued that high frequency noise permeates from an LED lamp to the input line over which PLC takes place.
In this paper only LED lamps with a rectifier and high frequency DC-to-DC converter combination are dealt with.
A contribution of this study is that result sections for LED-lamp noise are provided. The noise spectra of LED lamps (across a band) are described with expressions for upper and lower bounds giving maximum and minimum interference (NB up to 150 kHz and BB up to 30 MHz). These are useful when expressing the noise in channel throughput calculations (such as (1)). It was shown that some LED lamps radiate above the EMC limit and the interference level can decrease PLC operations, resulting in reduced data throughput.
The second contribution of this paper shows how individual noise harmonics can be identified. The rectifier line spectra modulate (in AM fashion) around switching frequency harmonics and appears as spectra with a switching frequency at its centre. This knowledge is useful for fixed carrier PLC where specific frequencies are of concern; for example, if a noise harmonic blanks a valid PLC carrier frequency.
An interesting conclusion arrived at when testing different LED lamps for noise are that some lamps employ poorly designed or no EMI filtering.
Using the results from this paper, designers should be able to estimate some of the adverse effects of LED lamps on the PLC channel.
Acknowledgement
Our deepest gratitude goes to the late professor Hendrik Ferreira for his academic contribution and financial support to this work.a
- E. Mills, “Global lighting energy savings potential,” Light & Engineering, 10(4), 5–10, 2002.
- Y. Matsumoto, I. Wu, K. Gotoh, S. Ishigami, “Measurement and modeling of electromagnetic noise from LED light bulbs,” IEEE Electromagnetic Compatibility Magazine, 2(4), 58–66, 2013, https://doi.org/10.1109/MEMC.2013.6714699.
- A. S. De Beer, A. Emleh, H. C. Ferreira, A. J. H. Vinck, “Effects of LED lamps on the power-line communications channel,” ISPLC 2013 – 2013 IEEE 17th International Symposium on Power Line Communications and Its Applications, Proceedings, 209–213, 2013, https://doi.org/10.1109/ISPLC.2013.6525851.
- J. Anatory, N. Theethayi, R. Thottappillil, M. M. Kissaka, N. H. Mvungi, “The effects of load impedance, line length, and branches in the BPLC-transmission-line analysis for indoor voltage channel,” IEEE Transactions on Power Delivery, 22(4), 2150–2155, 2007, https://doi.org/10.1109/TPWRD.2007.905788.
- C. Nunn, P. Moore, P. William, “Remote meter reading and control using high performance PLC communication over the low voltage and medium voltage distribution networks,” Proceedings of the 7th International Conference on Metering Apparatus and Tariffs for Electricity Supply, 304–308, 1992.
- Comité Européen de Normalisation Electrotechnique, Retrieved July 29, 2020, from http://www.cenelec.eu.
- B. S. I. Staff, “Signalling on low-voltage electrical installations in the frequency range 3KHz to 148.5KHz. Immunity requirements for mains communications equipment and systems operating in the range of frequencies 3KHz to 95KHz and intended for use by electricity suppliers and distributors,” B. S. I. Standards, 2003.
- H. C. Ferreira, L. Lampe, J. Newbury, T. G. Swart, “Power line communications: theory and applications for narrowband and broadband communications over power lines,” In Power Line Communications: Theory and Applications for Narrowband and Broadband Communications over Power Lines, 2010, wiley, https://doi.org/10.1002/9780470661291.
- M. Kashef, M. Abdallah, N. Al-Dhahir, “Transmit power optimization for a hybrid plc/vlc/rf communication system,” IEEE Transactions on Green Communications and Networking, 2(1), 234–245, 2018, https://doi.org/10.1109/TGCN.2017.2774104.
- M. Nicolas Hadad, M. Alan Funes, P. Gabriel Donato, D. O. Carrica, “Dynamic characterization and equalization of a power line communication channel,” IEEE Latin America Transactions, 11(6), 1301–1306, 2013, https://doi.org/10.1109/TLA.2013.6710376.
- K. S. Surendran, H. Leung, “An analog spread-spectrum interface for power-line data communication in home networking,” IEEE Transactions on Power Delivery, 20(1), 80–89, 2005, https://doi.org/10.1109/TPWRD.2004.838468.
- A. Haidine, B. Adebisi, A. Treytl, H. Pille, B. Honary, A. Portnoy, “High-speed narrowband PLC in smart grid landscape – state-of-the-art,” 2011 IEEE International Symposium on Power Line Communications and Its Applications, ISPLC 2011, 468–473, 2011, https://doi.org/10.1109/ISPLC.2011.5764443.
- C. E. Shannon, “Communication in the presence of noise,” Proceedings of the IRE, 37(1), 10–21, 1949.
- EN 50065-1: Signaling on low-voltage electrical installations in the frequency range 3kHz to 148,5kHz – Part 1: General requirements, frequency bands and electromagnetic disturbances. European Standard, CENELEC, Ref. No. EN 50065-1:2011 E, Brussels, 2011.
- F. Pop, C. Munteanu, A. Racasan, C. Pacurar, S. Prusu, G. Mihai, “Evaluation of conducted disturbances from LED lamps according to en 55015,” IEEE International Conference on Communications, 2016, 509–512, 2016, https://doi.org/10.1109/ICComm.2016.7528260.
- N. Mohan, T. M. Undeland, W. P. Robbins, Power electronics: converters, applications, and design, 2002, John Wiley & Sons.
- F. A. Karim, M. Ramdhani, E. Kurniawan, “Low pass filter installation for reducing harmonic current emissions from LED lamps based on EMC standard,” ICCEREC 2016 – International Conference on Control, Electronics, Renewable Energy, and Communications 2016, Conference Proceedings, 132–135, 2016, https://doi.org/10.1109/ICCEREC.2016.7814966.
- H. A. Kazem, A. A. Albaloshi, A. S. A. Al-Jabri, K. H. Al-Saidi, “Simple and advanced models for calculating single-phase diode rectifier line-side harmonics,” Proceedings of World Academy of Science, Engineering and Technology, 1449–1453, 2007.
Citations by Dimensions
Citations by PlumX
Google Scholar
Crossref Citations
No. of Downloads Per Month
No. of Downloads Per Country