Assessment of Electricity Industries in SADC Region Energy Diversification and Sustainability
Assessment of Electricity Industries in SADC Region Energy Diversification and Sustainability
Volume 6, Issue 2, Page No 894-906, 2021
Author’s Name: Kakoma Chilala Bowa1,a), Mabvuto Mwanza2, Mbuyu Sumbwanyambe3, Kolay Ulgen4, Jan-Harm Pretorius1
View Affiliations
1Faculty of Engineering & Built Environment, University of Johannesburg, Johannesburg, 524, South Africa
2School of Engineering, University of Zambia, 32379, Zambia
3Department of Electrical and Mining Engineering, University of South Africa box 392 South Africa
4Solar Energy Institute, Department of Energy Technology, Ege University, Izmir, 35100, Turkey
a)Author to whom correspondence should be addressed. E-mail: chilalakakoma@gmail.com
Adv. Sci. Technol. Eng. Syst. J. 6(2), 894-906 (2021); ![]() DOI: 10.25046/aj0602102
DOI: 10.25046/aj0602102
Keywords: Energy Sustainability, Social, Environmental & Economical (SEE), Renewable Energy Technologies (RETs), SADC, Zambia
Export Citations
Before the COVID-19 crisis, the Southern African Developing Countries (SADC) had a varied energy mix including renewable energy, fossil fuels, and military energy production. The use of fossil fuels in the energy mix is known to be the source of the growing levels of greenhouse gases in the atmosphere. However, there was a reduction in GHG emissions following the pandemic, which reduced travel and trade, and worldwide disruption in economic activities. The priority of priority B in the 2015-2020 Regional Indicative Strategic Development Plan, which is Energy, continues. As a result, the availability of affordable and renewable energy is still a priority for south of the equator countries and their growth agenda. This paper is aimed at exploring the sustainability of SADC countries’ electricity sectors by using three sustainability pillars: Social, Environmental and Economic (SEE). SEE offers the main concepts of renewable energy, in a way that is socially, environmentally appropriate and economically viable. Study shows a gap in access rate in SADC countries with only Mauritius and Seychelles reaching 100% access to modern energy services (electricity) for both rural and urban areas. Currently all the member countries have set their RE goals for the year 2030. However, the subsidies by SADC member countries indicate that they are practiced as a way to make electricity affordable, and also to make electricity available to lower income households. In the period 2014-2017, big national budget deficits happened in various Southern African countries because of subsidies. Thus, this paper is of crucial importance to the foundational advancement of sustainable electricity sector growth in the country. The findings of this paper play a crucial role in helping and guiding politicians to better understand the existing and challenges future in the energy market and alternatives to address these problems. Additional research is given on how to arrive at sustainable decisions for the electricity sector in the region.
Received: 24 October 2020, Accepted: 11 March 2021, Published Online: 10 April 2021
1. Introduction
This paper is an extension of work originally presented at the IEEE 2nd conference on renewable energy and power engineering [1]. In the past decade, the electricity industry has expanded rapidly with greenhouse gas emissions (see fig.1). As the economy is rising, carbon dioxide emissions are increasing in proportion to increasing energy demand, industry and access. Electricity is now the number one contributor to greenhouse gases around the globe due to reliance on hydrocarbon (fossil) fuels such as coal, diesel, and gas [2, 3]. There is currently a global concern about environmental impacts due to countless provocations emanating from rapid and extremely precarious demand for energy resulting from population increase, decreased reserves of fossil fuel,
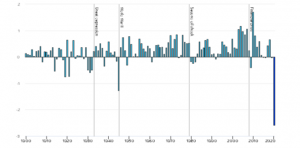
Figure 1: Globe Energy Related CO2 Emission,1900-2020 [2, 7]
economic activities and high volatile fossil fuel [4, 5]. Following the COVID-19 pandemic, due to the new trend [6, 7], there will be a decrease in GHG emissions, foreign travel disruptions and economic activities. The electricity sector therefore faces difficulties, both politically and socially, in fostering sustainability.
The most pressing global challenge is the effort to guide the energy industry’s future growth in a way that guarantees secure, sustainable, and sufficient access to electricity while being environmentally and socially appropriate as well. But the solutions presented must be commercially viable and must be combined with solutions from the real world. In Sub-Saharan Africa, this is needed in order to resolve numerous pressing energy challenges [8, 9]. Technologies for the generation of low-carbon electricity such as geothermal, solar photovoltaics (PV), wind turbines (WT), concentrated solar power (CSP), , biomass energy, and hydroelectric are rapidly recognized as crucial for a renewable electricity industry.
“The ultimate aim of SADC states (2016) is to “ensure that sufficient, effective, low-cost energy supplies are made available to help achieve economic efficiency and eliminate poverty while maintaining the efficient usage of energy resources [10]. The SADC member states have set up several subsidiary bodies to undertake energy related programs and initiatives in order to promote the harmonization of the energy sector. These numerous organizations include the SADC Center for Clean Energy and Energy Conservation, the Southern African Power Pool (SAPP) and the Southern African Regional Electricity Regulators Association (SARERA). These subsidiary organizations manage electricity planning, generation, delivery and marketing, as well as helping to harmonize regulatory policies [11].
The current RISDP 2015-2020 Priority B, provides guidelines on ensuring that regional and national strategies are compatible with the stability, sustainability, and efficiency of the region’s energy market, with Member Countries working together to study and improve low-cost energy technology and energy sources for the region [10, 11]. With regard to the supply of electricity that is secure and affordable, Southern African countries Development Community considers energy access as a very important development priority.
This paper presents a comparative assessment of the SADC countries’ electricity industry sustainability using the energy approach of Four (4) Aspects of Electricity (4EA’s) which is based on sustainability criteria and indicators. The method was adopted on the basis of claims that it would stick to the four aspects belonging to 4EAs for any energy scheme to be viable. The four aspects of a comprehensive electricity industry assessment in the SADC region are grouped into sixteen (16) indicators. These indicators are linked to the performance of the electricity industry in terms of social and environmental including economical and technical performance. The 4EAs approach includes; Affordability, Accessibility, Availability and Acceptability of electricity sector in the SADC member countries [12]. The methodology of the 4EA discusses the three main sustainability pillars; societal, economic and environmental influences [13]. In particular, these pillars are major principles to achieve electricity sustainability in a way that is technically and economically viable plus a more socially and environmentally acceptable and appropriate for sustainable electricity sectors.
An appropriate quantitative and qualitative indicators and criteria were drawn up for the SADC electricity industry in the evaluation of the SADC Member State electricity sector. The findings of the electricity sector sustainability assessment in the SADC countries will therefore play an essential role to provide a basis to guide and assist policy-makers. The findings will help policy makers have a better understanding of the current and future challenges that arise in the SADC regional electricity industry and by providing alternatives to address them [14]. This will also assist in the development of an informed investment strategy and decisions to achieve resilience in the region’s electricity market.
2. Electricity Industries Sustainability Assessment in the SADC Region
The electricity sector in the SADC region, similarly to other parts of sub-Saharan African, faces numerous energy security related challenges due to rapid energy demand growth, reduced accessibility to energy because of grid lower coverage, high reliance on fossil fuels due to greenhouse gas emissions, leading to environmental and social impacts. Therefore, the SADC region is facing two (2) main energy policy challenges; lower access levels to electricity which are estimated at 48%, with 32% rural and 75% urban (see Table 5), and energy security issues because of dependence on fossil fuels or only single (one) source of energy in the national energy mix [11].
IEA defines energy security as “uninterrupted availability of energy sources at an affordable price” (2019). It can be categorized into two (2) major aspects, short and long-term. The long term aims at making timely investments in the energy system without compromising the environment in meeting economic development. However, the short-term primarily deals with the current energy supply system’s ability to meet energy demand sudden changes [15]. Sustainability of energy is one of the key issues in the energy sector because of its strong links to social, economic, and environmental aspects [16]. The effect of access to affordable, reliable, and clean electricity is measured to improve the standard of human well-being. Economic aspects; represents the impact that the energy availability may have on economic growth and development prospects of any society or nation. The research conducted in 2013, highlighted that access to affordable, reliable and clean modern energy services, (e.g. electricity), is essential for the alleviation of poverty and economic development in developing countries [17]. The impact on energy systems that contribute to the environment as a whole is reflected in Environmental Sustainability. Thus, the current main drivers of environmental challenges such as greenhouse gas emission including climate change across the globe are energy systems based on fossil fuels. Therefore, the use of non-renewable energy sources in the energy mix poses a higher risk to natural environmental sustainability as compared to the use of renewable energy sources.
The 4EA sustainability indicators and criteria adopted for assessing the sustainability of the performance of the electricity industry in SADC member states are illustrated in table 1 below.
2.1. SADC Socio-Economic Development
The SADC consists of sixteen (16) member countries, including, as new Member States, Botswana Angola,, Lesotho, the DRC Congo (DRC), Malawi, Madagascar., Eswatini, Mauritius, Namibia, Mozambique, South Africa, Seychelles, Zimbabwe, Zambia and Tanzania. Approximately 33 percent of Sub-Saharan African population belongs to SADC region. The area has a projected 1.9 percent annual population growth. The area has seen an increase in urbanization in recent decades, for example in the period between 2013 and 2017, with the region seeing an increase in urban population share raising to 46% in 2017 from 35% in 2013. However, there exist a differences in the size and complexity of the gross domestic product (GDP) between SADC member states, with the lowest of US$1.498 billion (Seychelles) and highest of US$349.3 billion (South Africa) (check Table 2). This is the same with the GDP per capita, with ranges of US$800 (Malawi) to US$29300 per capita (Seychelles). However, on the overall, there is decline experienced by the SADC region in GDP per capita annual growth because of a drop in commodity prices on the international market (worldwide) including droughts that caused electricity deficit in industrial and agricultural production [16]. There are also large differences in member countries’ economic and social growth profiles in the region. The SADC member countries are classified into three categories, lower, medium and high according to United Nations Human Development Index (HDI). The HDI in the region ranges between 0.418 (Mozambique) and 0.782 (Seychelles), with nine Member States below 0.50, four between 0.50 and 0.70 and only two above 0.70 (see Table 2 [11].
Table 1: Summary of 4EA’s SADC Electricity Industry Sustainability Indicators and Criteria
| Aspects of 4A’s | Issues | Sustainability Criteria & Indicators |
| Acceptability | Global Warming | 1) Policies on Renewable energy technologies (checklist)
2) Renewable energy share in electricity generation (%) 3) CO2 emission per capital (t CO2/capital ) 4) CO2 emission (ktCO2/year) |
| Accessibility | Access to Modern Energy Services and Future Targets | 5) Electrification rate (%)
6) Electricity consumption per capital(kWh) 7) Electricity Intensity (kWh/GDP) 8) Future Electrification Targets |
| Availability | Energy security | 9) Diversity in Electricity generation mix (% share of each fuel type)
10) Diversity of fuel in Electricity generation (Shannon Wiener Index) 11) Dependence on imported electricity generation § Self-Supply Sufficiency of Electricity (%) 12) Future Share of Renewable Energy Targets |
| Affordability | Energy Affordability | 13) Electricity Prices ($/kWh)
14) GDP per Capita |
Table 2: Socio-Economic Statistics for the SADC Member States [11,18,19]
| Member States | Socio-economic indicators for the SADC Countries as of 2017 | kWh per Capita | CO2 Emission
(kilotons/year) |
National Electrification Rates (%) | ||||
| Surface Area (km2) | Population | GDP (US$ Billion) | GDP per capita ($) | HDI | ||||
| Angola | 1,246,700 | 30,355,880 | 126,5 | 6,800 | 0.533 | 336.01 | 34,763 | 41 |
| Botswana | 581,730 | 2,249,104 | 17,38 | 17,000 | 0.698 | 1123.56 | 7,033 | 61 |
| DRC | 2,344,858 | 85,281,024 | 41,44 | 0,800 | 0.435 | 106.07 | 4,672 | 17 |
| Eswatini | 17,364 | 1,087,200 | 4,417 | 10,100 | 0.541 | 350.44 | 1,203 | 66 |
| Lesotho | 30,355 | 1,962,461 | 2,749 | 3,300 | 0.497 | 259.88 | 2,468 | 34 |
| Madagascar | 587,041 | 25,683,610 | 11,50 | 1,600 | 0.512 | 66.42 | 3,077 | 23 |
| Malawi | 118,484 | 19,842,560 | 6,240 | 1,200 | 0.476 | 71.56 | 1,276 | 11 |
| Mauritius | 2,040 | 1,364,283 | 13,33 | 22,300 | 0.781 | 2124.19 | 4,228 | 100 |
| Mozambique | 799,380 | 27,233,789 | 12,59 | 1,300 | 0.418 | 674.90 | 8,427 | 24 |
| Namibia | 823,290 | 2,533,224 | 13,24 | 11,200 | 0.640 | 553.84 | 3,755 | 56 |
| Seychelles | 455 | 94,633 | 1,498 | 29,300 | 0.782 | 3698.50 | 495 | 100 |
| South Africa | 1,219,090 | 55,380,210 | 349,3 | 13,600 | 0.666 | 4234.36 | 489,772 | 86 |
| Tanzania | 947,300 | 55,451,343 | 51,76 | 3,200 | 0.531 | 120.81 | 11,562 | 33 |
| Zambia | 752,614 | 16,445,079 | 25,71 | 4,000 | 0.579 | 702.34 | 4,503 | 31 |
| Zimbabwe | 390,757 | 14,030,368 | 17,64 | 2,300 | 0.516 | 484.66 | 12,020 | 38 |
| SADC | 9,509,776 | 695,294 | 8,533 | 0.574 | 993,84 | 48 | ||
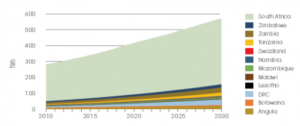
Figure 2: Projected Energy Demand in Southern Africa by 2030 [IRENA, 2015b]
2.2. SADC Share of Electricity Industry
As of 2018, the overall installed capacity of the SADC region was estimated at more than 61,859 GW, with 59,539 GW of installed capacity and 54,397 GW of operational capacity for SAPP Member States alone. Regional electricity demand growth is expected at an average rate of between 3 percent and 6 percent annually, in line with economic growth [20]. Complete electricity demand forecasts from the International Renewable Energy Agency (IRENA) (2015) indicate that demand in the SADC region is projected to double from 280 TWh (2010) to 570 TWh (2030) by 2030 (see Fig.2) owing to numerous activities such as strong economic growth, demographic growth, urbanization and industry production in the region [21, 22]. The demand for energy will continue to outpace production, with real costs, unless SADC countries raise cooperation with each other. Electricity will remain high and SADC’s aspirations for wide-scale industrialization will continue to be suppressed by an inadequate supply of available electricity at fair prices.
In the region, however, generation capacity and installed power grids are limited; thus, electricity supply has lagged behind demand growth from 2007 until 2018, when the SADC region experienced excess energy supply as the result of the commissioning of the new energy projects [23]. In most SADC member states, this delay in the supply demand balance has resulted in a complex and persistent electricity shortage. Moreover, even in some highly hydroelectricity dependent SADC Member States due to climate change that has triggered droughts in recent years, the presence of a grid link has not guaranteed access to electricity for the end user, or even would be used by consumers due to prolonged load shedding, brownout and power cuts [24]. The SADC region’s level of access to modern energy resources remained lower, with the total level of access to electricity as of 2017 being approximately 48% with 32% for rural and 75% urban areas (checkTable.5). The zone, however, aims to boost levels from the current level to 85.5 percent by 2030 [11].
2.3. SADC CO2 Emission
While Africa contributes little to global CO2 emissions overall, with many countries contributing almost zero, South Africa, by comparison, is the fourteenth largest CO2 emitter in the world. Tackling climate issues and related problems in the SADC region is obviously closely linked to tackling South Africa’s and SADC’s dependency on coal. At the 2016 Conference of the Parties (COP) to the United Nations Framework on Climate Change in Paris, countries committed to reducing emissions by individual pledges in a collective effort to minimize global emission levels. Such obligations are known as nationally specified contributions (NDCs). Although the SADC does not have a detailed shared strategy on how to achieve NDC targets at regional level, organized discussions on how to define and formulate national targets were conducted in the lead-up to COP 21. And the SADC Regional Infrastructure Growth Master Plan 2012 sets out the target to increase renewable energy share in the grid to 39% by 2030 from the current 29% and reaching an off-grid share of 7.5% by 2030 [11, 20].Almost 85.7% of the electricity produced in the SADC region comes from coal-fired thermal power plants, posing a high health risk and rising the region’s greenhouse gas emissions. Despite contributing fewer greenhouse gas emissions in the region, which was around 2.2 percent of global emissions in 2011, some SADC Member States, such as South Africa, have remained higher greenhouse gas emitters with 13th place in the world ranking. South Africa alone accounted for 48% of the carbon dioxide released in the SADC region in 2016 (see table 2) [11].
2.4. SADC Electricity Generation and Consumption
The only approach to solving existing electricity problems and promoting natural environmental resilience in the area is the transition to renewable energy in the electricity market of regional. In recent research in the field, the viability of renewable energy projects has been increasingly highlighted as a viable alternative. Renewable energy technologies such as biomass, wind, hydro, geothermal, and solar power is therefore rapidly gaining popularity in the SADC region, with total installed capacity reaching 18,069MW as of 2017 (see Figure 3 and Table 3), and capacity increased further to 21,760MW as of mid-2018 [11, 25]. The SADC region is projected to have an annual combined wind and solar capacity of 800 TWh, 219.5 TWh (solar PV) and 109.3 TWh (concentrated solar power) [21, 26]. However, the estimated electricity generation capacity from renewable energy sources for the period between 2010 and 2030 [26] in the region for consolidated energy systems is 62,781MW and 24,725MW for decentralized off-grid projects. A recent SACREE report published in 2018 showed that for the SADC area [11], wind and solar power could be an environmentally and economically competitive choice in the near future. Table 4 highlights advances in the generation of renewable energy (RE) for the period 2006-2017 in the SADC Member States.
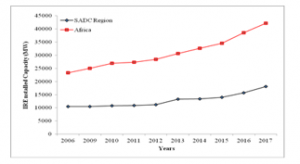
Figure 3: Renewable Energy Trend Comparison in Africa and SADC Region
Table 3: RE Development Trends for Eelectricity Generation in SADC Member States [IRENA 2018]
| SADC Member States | RE Development Trends in SADC Member States (MW) | ||||||||||
| 2006 | 2009 | 2010 | 2011 | 2012 | 2013 | 2014 | 2015 | 2016 | 2017 | 2018 | |
| Angola | 776 | 777 | 779 | 779 | 867 | 948 | 1016 | 1017 | 1418 | 2800 | 2428,0 |
| Botswana | – | – | 0 | 0 | 1 | 2 | 2 | 6 | 6 | 6 | 1,3 |
| DRC | 2514 | 2514 | 2514 | 2514 | 2514 | 2515 | 2515 | 2537 | 2687 | 2687 | 2601,0 |
| Eswatini | 124 | 124 | 124 | 186 | 186 | 186 | 186 | 186 | 186 | 186 | 167,6 |
| Lesotho | 73 | 73 | 73 | 73 | 75 | 75 | 75 | 75 | 75 | 75 | 77,3 |
| Madagascar | 122 | 122 | 131 | 131 | 165 | 167 | 170 | 173 | 175 | 177 | 177,3 |
| Malawi | 299 | 299 | 299 | 301 | 301 | 303 | 370 | 374 | 374 | 374 | 378,4 |
| Mauritius | 130 | 134 | 135 | 135 | 152 | 155 | 171 | 171 | 189 | 191 | 247,3 |
| Mozambique | 2198 | 2198 | 2198 | 2198 | 2201 | 2205 | 2207 | 2211 | 2214 | 2233 | 2198,9 |
| Namibia | 252 | 253 | 254 | 257 | 343 | 346 | 348 | 359 | 379 | 391 | 404,5 |
| Seychelles | – | – | – | – | – | 6 | 7 | 7 | 8 | 8 | 8,7 |
| South Africa | 838 | 848 | 853 | 897 | 903 | 1358 | 2524 | 3060 | 4069 | 4959 | 8679 |
| Tanzania | 607 | 609 | 620 | 636 | 642 | 645 | 649 | 656 | 657 | 659 | 612,9 |
| Zambia | 1715 | 1723 | 1937 | 1937 | 1944 | 2304 | 2304 | 2314 | 2434 | 2435 | 2597,8 |
| Zimbabwe | 835 | 835 | 837 | 856 | 856 | 862 | 863 | 879 | 884 | 888 | 1180,0 |
| SADC Region | 10483 | 10509 | 10754 | 10900 | 11150 | 13339 | 13407 | 14025 | 15755 | 18069 | 21759,7 |
| Africa | 23381 | 24986 | 26940 | 27319 | 28485 | 30639 | 32666 | 34511 | 38603 | 42139 | |
Table 4: Energy Imports, Export, Generation, and Consumption, for the SADC countries,2016/2017 [11,18,25]
| Member States | Energy indicators for the SADC Countries (TWh/Year) | Primary Energy Generation Mix (%) | Diversification | ESE(%) | SSR(%) | ||||||
| Generation | Consumption | Exports | Imports | Other RES | Hydro | Nuclear | Fossil | ||||
| Angola | 10,20 | 9.036 | 0.00 | 0.00 | 2 | 64 | 0 | 34 | 0,67 | 88,59 | 100,0 |
| Botswana | 2,527 | 3,636 | 0,00 | 1,673 | 0 | 0 | 0 | 100 | 0,00 | 86,57 | 60,17 |
| DRC | 9,046 | 7,430 | 0,422 | 0,020 | 0 | 98 | 0 | 2 | 0,14 | 86,61 | 99,77 |
| Eswatini | 0,381 | 1,431 | 0,00 | 1,077 | 41 | 20 | 0 | 39 | 0,96 | 98,15 | 26,13 |
| Lesotho | 0,510 | 0,847 | 0,00 | 0,373 | 1 | 99 | 0 | 0 | 0,08 | 95,92 | 57,76 |
| Madagascar | 1,706 | 1,587 | 0,00 | 0,00 | 2 | 24 | 0 | 74 | 0,59 | 93,02 | 100,0 |
| Malawi | 1,420 | 1,321 | 0,00 | 0,00 | 6 | 93 | 0 | 1 | 0,28 | 93,03 | 100,0 |
| Mauritius | 2,898 | 2,726 | 0,00 | 0,00 | 14 | 7 | 0 | 79 | 0,59 | 94,06 | 100,0 |
| Mozambique | 18,39 | 11,57 | 12,88 | 9,928 | 1 | 83 | 0 | 16 | 0,45 | 86,34 | 35,69 |
| Namibia | 1,403 | 3,891 | 0,088 | 3,073 | 8 | 64 | 0 | 28 | 0,77 | 88,90 | 29,97 |
| Seychelles | 0,350 | 0,326 | 0,00 | 0,00 | 9 | 0 | 0 | 91 | 0,44 | 93,14 | 100,0 |
| South Africa | 234,5 | 207,1 | 16,55 | 10,56 | 10 | 1 | 4 | 85 | 0,39 | 91,26 | 95,38 |
| Tanzania | 6,699 | 5,682 | 0,00 | 0,102 | 6 | 40 | 0 | 55 | 0,79 | 83,55 | 98,50 |
| Zambia | 11,55 | 11,04 | 1,176 | 2,185 | 2 | 93 | 0 | 5 | 0,27 | 88,94 | 82,60 |
| Zimbabwe | 6,800 | 7,118 | 1,239 | 2,220 | 5 | 37 | 0 | 58 | 0,76 | 92,65 | 71,47 |
The primary energy generation combination of imports, exports and consumption as of 2016 by the SADC member states is shown in Table 4. It can be seen that South Africa had the highest generation, consumption, imports and exports in a region followed by Mozambique and, least of all, Seychelles, which has zero imports and exports.
3. Energy Sector Sustainability Evaluation of SADC Countries based on 4EAs
3.1. Electricity Acceptability
In terms of social and environmental acceptability, electricity generation technologies cause various and numerous environmental and social impacts such as visual impacts, land use and degradation, fugitive dust, noise, soil and air pollution including greenhouse gas emission which is the most serious threats to both the environment and society arising from present electricity industry. These impacts pose different policy challenges and there is no one straightforward solution. Hence, this dimension reflects environmental and social acceptability of the electricity sector by society and environmental organizations based on national energy mix. According to WEC(2007), the best alternative to attain environmental sustainability and increase social acceptability is by reducing greenhouse gas emission through adopting of low-carbon renewable energy technologies in the national energy mix [16]. Thus, an electricity generation mix with combination of various sources from low-carbon technologies is expected to increase social and environmental acceptability. Therefore, to assess the acceptability of SADC countries’ electricity industry the following criteria have been considered; RE share in electricity production (%), emission of CO2 per capital (t CO2/capital ), country’s CO2 emission and Policies on Renewable energy technologies.
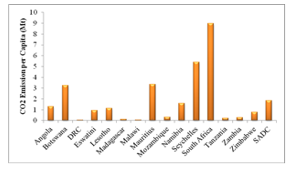
Figure 4: CO2 Emission per capita in SADC Countries [27]
1) CO2 Emission Per Capita
Figure 4 shows the emissions of CO2 per capita in the SADC countries as of 2015. The results indicate that, except for South Africa, the region’s member countries have lower emissions of CO2 per capita, mainly because of higher dependence on fossil fuels (coal) in the electricity sector. Therefore, South Africa (SA) has the highest per capita emissions (8,98 tonnes of CO2) in the country, followed by Seychelles (5,42 tonnes of CO2) with the lowest value of 0,06 tonnes of CO2 in DRC [27]. This makes SA, as previously mentioned, the largest contributor and emitter of CO2 emissions in the SADC region. South Africa draws 85% of its energy from fossil fuels at the same time contributes more than 76% to the final electricity generation in the SADC region, hence contributing to nearly half of the region’s CO2 emissions [27].
2) Policies on Renewable energy technologies
As seen in Table 8, it appears that all SADC member states have progressed towards the establishment of RE technology national and regional policies. These policies, however, differ according to the priorities and objectives of the country set in the national energy master plans.
3) Share of RE in Final Electricity Generation Mix
Figure 5 shows the renewable energy (RE) share in the electricity generation in member states of SADC. It can be seen that due to the high use of hydro for electricity generation, DRC shows a highest share of RE of 92.87 percent in the final national general electricity generation mix, with the lowest share of 1.03 percent shown by Seychelles because of its reliance on fossil fuels. In general, the shares of RE in the final energy generation mix have increased in the region and member countries (see table 4).
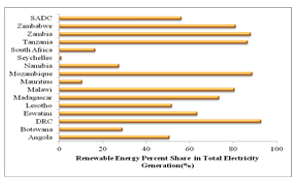
Figure 5: RE Share in SADC Countries ‘Electricity Generation [11]
4) SADC Countries CO2 Emission Per Year
Most SADC member countries have low CO2 emissions because the overall generation of electricity is highly dependent on renewable energy. Nonetheless, few Member States such as South Africa, Botswana, Seychelles, Mauritius, and Namibia are heavily dependent on fossil fuels with less than 50% share of RE in the final electricity generation mix. Therefore, in terms of the total contribution of CO2 emissions to the region, South Africa is at the top of the group, followed by Angola, Zimbabwe, Tanzania and Seychelles at the very least (see table 2 above).
3.2. Electricity Accessibility
This dimension underlines society’s accessibility to modern energy facilities, both now and in the future, in a sustainable way for everyone. Access to electricity can have multiple social impacts, including enhancing human well-being by meeting the basic needs of human being, such as entertainment, gender equality, food, education, clean water and health [14]. Moreover, accessibility to energy services will also help to reduce the effects on the environment, such as deforestation. Therefore, the idea of efficiency, quality and easy access to energy services to society poses a policy challenge. Societies must clearly have easy accessibility to critical energy resources, but services must be efficient and of high quality. A comparative study is also conducted in this dimension to determine the accessibility of electricity in the SADC countries, as well as the possible access goals. In this dimension, three parameters are taken into account: electricity intensity (kWh/GDP) and electricity consumption per capital (kWh/capital), existing levels of electrification and potential access targets for connectivity and electricity Disruption Risk Index [28] to assess the efficiency and quality of services.
1) Consumption of Electricity per Capita
Figure 6 shows the energy consumption per capita in member states as of 2017. In general, electricity consumption per capita in most SADC countries is low below the average value of the region (993.84 kWh/ capita), with the exception of Seychelles, Mauritius and South Africa, with more than 2000 kWh per capita. Electricity consumption per capita varies significantly, with the smallest being 66.42kWh per capita for Madagascar and the highest of 4234.36kWh per capita for South Africa.
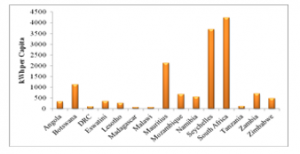
Figure 6: Consumptions of Electricity per Capita
2) Electricity Intensity
Figure 7 shows the energy intensity (kWh per US$) in member states. With Mauritius, Botswana, Seychelles and Namibia having the lowest because of higher GDP due to lower population with Zimbabwe, Madagascar and DRC having the highest energy intensity among the member countries. This means that growth in electricity demand is far below economic growth in most member countries. Hence, this shows that there is less modern energy services accessibility including lower penetration and utilization of electrical appliances and equipment in the region and in the member States.
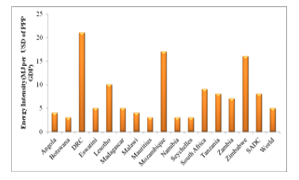
Figure 7: Energy Intensity in SADC Member States in 2017 [11]
3) Electrification Levels and Future Access Targets
Table 5 shows the electricity accessibility in SADC member states and the potential goals for access to electricity as set in the Member States’ national energy master plans to be achieved by 2030. As of now, with the exception of a few countries like: Botswana, South Africa, Eswatini, and Namibia that are above 50%, the country and several Member States have lower access levels to electricity. The only two member countries that are now able to have 100% access to electricity are Mauritius and Seychelles. For most member countries, however, urban electrification levels are above 60 percent, with only Malawi having the lowest 42 percent. Nevertheless, with the exception of Mauritius and Seychelles, which have already crossed 100 percent, rural electrification levels are still lower in most member countries. Rural electrification should therefore be listed as a priority area for the SADC region and its member countries in order to achieve this aim.
Table 5: Electrification Rates in SADC Member, 2016 [11]
| Member States | Electrification Rates (%) | Energy Access Targets (%) | |||
| Rural | Urban | National | People without Access to Electricity (million) | ||
| Angola | 16 | 69 | 41 | 17 | 100% by 2030 |
| Botswana | 37 | 78 | 61 | 1 | 100% by 2030 |
| DRC | . | 78 | 17 | 68 | 60% by 2025 |
| Eswatini | 61 | 83 | 66 | <1 | 100% by 2030; 75% by 2018; 85% by 2020 |
| Lesotho | 16 | 66 | 34 | 1 | 40% by 2020 |
| Madagascar | 17 | 67 | 23 | 19 | – |
| Malawi | 4 | 42 | 11 | 16 | 30% by 2030 |
| Mauritius | 100 | 100 | 100 | – | – |
| Mozambique | 5 | 65 | 24 | 21 | 100% by 2030; 30% Modern Cooking Fuel by 2030 |
| Namibia | 29 | 77 | 56 | 1 | 50% by 2020; 100% by 2030 |
| Seychelles | 100 | 100 | 100 | – | – |
| South Africa | 68 | 93 | 86 | 8 | 100% by 2025 |
| Tanzania | 17 | 65 | 33 | 36 | 75% by 2030 |
| Zambia | 4 | 67 | 31 | 11 | 66% by 2030; 90% by 2030 urban, 51% by 3030 rural |
| Zimbabwe | 16 | 86 | 38 | 11 | 100% by 2030 |
| SADC | 32 | 75 | 48 | 49 | – |
3.3. Electricity Availability
Electricity reliability and supply continuity are very vital for the social and economic development of every community, society or country. In order to achieve the social and economic well-being of every community and country, electricity plays an important role. However, there are different issues that can cause short-term and long-term unreliability and electricity discontinuity. These vary from nation to nation, but it’s very similar and popular in the SADC member states. The causes maybe due to insufficient electricity generating units, insufficient transmission lines to transport electricity generated to demand centers, inadequate demand-compliant generating units, poor maintenance of transmission networks or generating power station, weak electricity systems to withstand disruptions and contingencies. For example, severe weather conditions such as low precipitation (droughts) and potential availability of primary energy sources such as fossil fuels may be other factors [16]. However, it is argued, according to the [16] literature, that a well-diversified energy generation industry comprising of different types of local primary energy sources, including reliable generation technologies, is capable of helping to improve energy security and to reduce the risks that may arise from high and volatile fluctuations in fuel prices.
Therefore, the use of available local resources in the generation of electricity is important. Furthermore, timely and adequate investment in the electricity sector is essential to ensure the reliability and continuity of the supply of electricity [17]. This dimension examines the energy security of the SADC countries with regard to the short and long-term reliability and continuity of the supply of electricity by meeting four of the following availability indicators and criteria: the reserve margin of the supply of electricity, the efficiency of the supply of electricity, the diversification of the supply of electricity, the sufficiency of the self-supply of electricity (SSR).
1) Efficiency of Electricity Supply (ESE) in SADC Countries
The ESE is described as ” the ratio of electricity not lost(ENL) to the total supply of electricity (TES)”[28]. This indicator shows the overall output of the country. The estimate was made using Equation 1 (1a to 1d). As given below, the general equation is expressed as.
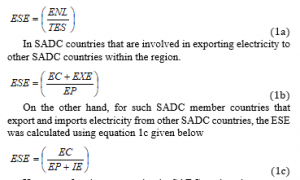
where, “EC” denotes consumption of electricity, IE-import of electricity, EP-output of electricity, EXE-export of electricity. Figure 8 below shows the output of SADC countries in terms of electricity supply reliability. The results show that among the member countries, the lowest ESE is shown by Tanzania whereas highest ESE is shown by Eswatini. In other words, with the exception of Eswatini, the majority of SADC countries have an ESE of less than 95%. This shows that the general electricity industry faces problems with electricity losses in most of the member countries. This may be due to theft of electricity or losses in the grid due to long grid distances or inadequate maintenance.
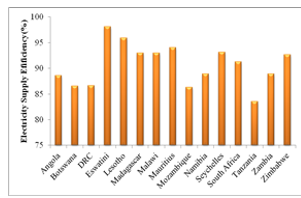
Figure 8: ESE in SADC Countries
2) Electricity Supply Diversification of SADC Countries
Using the Shannon Wiener Index given in equation 2 [5,29], the diversification of electricity supply is calculated.

In the equation “si” represents the portion of each energy source in the electricity generation mix, “I and n” is the number of main energy sources in the electricity generation mix. When the equal share (1/n) of all energy sources contributes to the final electricity generation mix, the maximum “Ln(n)” occurs. In terms of electricity supply diversification, the higher the value means higher energy resilience and security. Hence, lower risk for the electricity industry (see Fig.9). The findings show that diversification in the SADC countries’ electricity industry varies widely, with highest in Eswatini and lowest in Botswana. However, Table 7 below shows that all SADC member states have put in place plans for the diversification of the local mix of electricity production by 2030. Hence, it is expected that the future of SADC electricity industry of the Member States will be more diversified. However, the energy security and accessibility will be strengthened only if all Member States follow and meet their planned targets. Nonetheless, fossil fuels (natural gas and coal) which are readily available locally are expected to continue playing a major role in the region’s energy generation mix.
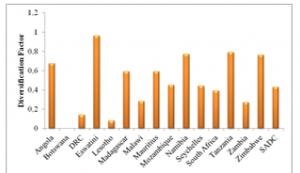
Figure 9: Energy Diversification in SADC Countries, 2016
3) Self-Supply Sufficiency Rate of SADC Countries
For each member state, the Self-Supply Sufficiency Rate (SSR) in the national electricity sector was assessed using equations 3a-d [28] to determine the energy diversification impact on the SADC member countries’ electricity sector. This deminsulation tests the capability of the SADC countries’ electricity sector to meet the current demand with local generation. Consequently, greater the value or equal to 100% represents that the nation is self-sufficient, while less than 100% means that the country is dependent on the energy it imports. General equation 3a.
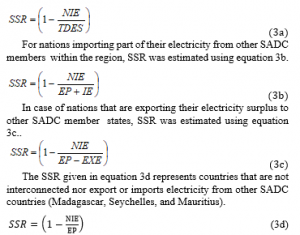
Where “NIE” denotes the net electricity imports whereas “TDES” is the total electricity generation. In terms of sustainability, the country with higher SSR value have higher energy security hence lower the risk due to lower dependency on the imports of electricity (see fig.10 ). The results shows that the majority of the SADC countries are self-sufficient in the electricity supply with only handful of countries facing challenges.
4) RE Share and Reserve Margin in Electricity Supply in SADC Countries
As of mid-2018, Table 6 highlights the share of RE in SADC member countries. In spite of the number of Member States producing electricity from RESs, the majority of electricity production in the region is highly dependent on fossil fuels. However, the region and Member States have increased their RE share in the overall mix of final electricity generation as of 2018, with South Africa leading the ladder (see table 4). As regards the reserve margin, it can be seen that, as of 2016, seven of the member countries had an energy deficit. Except for South Africa, which had more than 10.0GW, the other member countries had negligible reserve margins. These negligible reserve margins are mainly due to the region’s rapid electricity demand, but also due to underinvestment in the electricity industry in many SADC nations.
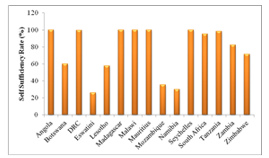
Figure 10: SSR for SADC Countries
Table 6: Share of Energy Sources in Total Final Energy Generation (TFEG)in SADC Countries, 2016[18,20]
| Member States | Share of Energy Sources in TFEG (%) | |||
| Other RES | Hydro | Nuclear | Fossil | |
| Angola | 2 | 64 | 0 | 34 |
| Botswana | 0 | 0 | 0 | 100 |
| DRC | 0 | 98 | 0 | 2 |
| Eswatini | 41 | 20 | 0 | 39 |
| Lesotho | 1 | 99 | 0 | 0 |
| Madagascar | 2 | 24 | 0 | 74 |
| Malawi | 6 | 93 | 0 | 1 |
| Mauritius | 14 | 7 | 0 | 79 |
| Mozambique | 1 | 83 | 0 | 16 |
| Namibia | 8 | 64 | 0 | 28 |
| Seychelles | 9 | 0 | 0 | 91 |
| South Africa | 10 | 1 | 4 | 85 |
| Tanzania | 6 | 40 | 0 | 55 |
| Zambia | 2 | 93 | 0 | 5 |
| Zimbabwe | 5 | 37 | 0 | 58 |
| SADC | 7,0 | 48,2 | 0,3 | 44,5 |
5) RE Share Targets and Interconnection in SADC Countries by 2030
In order to promote in the regional and national electricity supply in the sustainable manner and promote the use of and increase access to clean modern energy services for the greater benefit of all people in the region and member states. The region and SADC states have set up targets plans to be achieved by 2030 for the renewable energy share in the electricity generation as illustrated in Table 7. In addition, to increase regional and national energy security and reliability in electricity sector almost all mainland member countries are interconnected and are involved in international electricity trade except for Malawi and Tanzania which are expected to be interconnected with other members by 2030. However, Madagascar, Mauritius and Seychelles due to their geographical location will always remain not connected to the region electricity grid. Furthermore, in terms of grid losses as shown in table 7, it indicates that Lesotho followed by Angola have higher losses in the SADC region with South Africa having the lowest among the member states. Hence, it can be concluded that the South African power grid has higher efficiency in the region.
Table 7: Regional and National Targets in SADC Member States by 2030 [11]
| Member States | Renewable Energy Targets | Transmission and Distribution Losses (%) | Interconnections with other countries |
| Angola | Increase in RE capacity by 2025 as follows:
§ Small Hydro:100MW with 60MW for municipalities § Solar:100MW with 10MW off-grid § Wind:100MW § Biomass:500MW |
10 | ü |
| Botswana | 100% access to modern energy services by 2030
Capacity increase expected from REFIT programme 15% RE share in final energy consumption by 2025 but may increase to 20% |
3,7 | ü |
| DRC | 60% overall energy access by 2025 | 9 | ü |
| Eswatini | 50% RE share in Electricity Consumption by 2030
60MW intermittent resource by 2030 e.g solar |
6 | ü |
| Lesotho | Targets pnding completion of Sustainable Energy Strategy 2018 | 11 | ü |
| Madagascar | 85% RE Share in final energy by 2030 | – | v |
| Malawi | By 2025/2030
307% access to electricity 100% use of efficient cook stoves in off grid households 6% RE share in energy mix Biofuels mandate of 20% ethanol and 30% biodiesel |
6 | § |
| Mauritius | 35% RE Share in electricity generation by 2025:
Bagasse:17%, Wind:8%, Waste to enrgy:4%, Hydro:2%, Solar:2%, Geothermal: 2% |
6 | v |
| Mozambique | 400MW increase in installed RE capacity by 2024
Wind:150MW Hydro:100MW large\scale & 100MW small scale |
6,4 | ü |
| Namibia | 70% RE share in electricity generation by 2030 | 3,2 | |
| Seychelles | 5% RE share in electricity generation by 2020 & 20% by 2030 | – | v |
| South Africa | 21% RE Share in electricity generation by 2030
17.6GW solar capacity by 2050 37.4GW wind capacity by 2050 |
0,1 | ü |
| Tanzania | 5% RE share in electricity generation by 2030 | 6,0 | § |
| Zambia | 200MW increase in RE capacity by 2020 | 6,2 | ü |
| Zimbabwe | 16-5% RE Share increase in overall
1100MW increase in RE capacity by 2025 2100MW increase by 2030 2400GWh increase in RE generation by 2025 4600GWh increase in RE generation by 2030 (26.5%overall increase) |
4 | ü |
| SADC | 71% by 2025, 85,5% by 2030 Regional Electricity Access targets
39% Regional Renewable Energy Mix target in the grid 7,5% Off-Grid share of RE as per total grid electricity capacity 15% Energy efficiency % savings achieved from grid consumption |
5.97 | ü |
3.4. Electricity Affordability
According to literature [13], for electricity to be considered as being affordable the following conditions have to be fulfilled:
- The electricity tariffs should be low as compared to household income, that is, the household should be able to afford their electricity bills.
- The electricity tariffs should be low as compared to other alternative prices of competitor, that is, the price of electricity should be lower than other option such as wood fuel, traditional fuels, fossil fuels etc.
- The electricity tariffs should be low enough to ensure the energy import bill is small compared to export earnings [13],
- The electricity tariff should be high enough to ensure sufficient benefit and profitability for independent Power Producers and Utility Companies i.e., the tariff should be able to reflect the real value of the electricity supply. In short, the electricity price should take care of all the value chain cost of electricity supply (Production, Transmission/Distribution and other cost of the industry) [16].
This dimension investigates the electricity affordability of SADC countries using the following affordability indicators and criteria; Electricity Prices, GDP per Capita and Cost of Electricity Supply (i.e. the amount spent on electricity as compared to national GDP).
1) Electricity Tariffs
Figure 11 highlights the average tariffs for electricity as of 2018 in the SADC countries. The lower the price of electricity in terms of affordability, means the higher the government subsidies practiced, hence, a huge burden on expenditure of government. This suggests that the supply of energy is heavily subsidized and does not reflect the actual electricity cost. The results shows that the majority of SADC member countries have electricity tariff rates of less than US$c10/kWh. However, Namibia among member states has the highest electricity tariff. These lower tariffs suggest that majority of SADC countries’ energy is heavily government-subsidized, hence does not attract the private investors, which is the biggest obstacles to the sustainable growth of the electricity industry in the region. Nonetheless, with expectation to meet the cost-reflective rates in SADC member countries, it is expected that the sector will draw a lot of private investment by 2030.
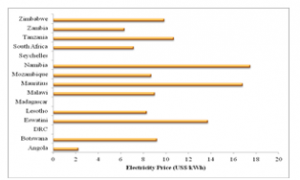
Figure 11: Electricity Tariffs in SADC Member, 2018 [24]
2) GDP per Capita
The per capita GDP reflects the citizen’s purchasing power, thus nations with higher per capita GDP mean that people have more buying power and vice versa. The scenario represents electricity investment in terms household electricity affordability. Figure 12 shows that most SADC states face problems because the population has less purchasing power, so government subsidies are required to make electricity affordable.
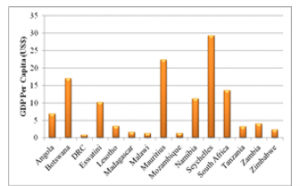
Figure 12: GDP per Capita in SADC Countries, 2016
3) Real Cost of Electricity Supply (RCES)
RCES is defined as “the ratio of the proportion of real GDP not dedicated to cover the net electricity supply expenditures (NESE) to real GDP (RGDP)or it is one minus the share of GDP dedicated to cover the cost of the electricity supply(ES)” [28]. The criteria measures the ability of the SADC countries to reduce the RCES and the vulnerability of member states to high RCES. The higher the RCES shows the country’s ability to reduce its RCES whereas low values shows exposure of the country to high RCES. RCES is estimated using equation 4 given below.
Where ES is estimated by firstly converting the total electricity supply into barrel of oil equivalent (bbl) and multiplying it with the annual real average crude oil price (COP) given in US$ per bbl. Figure 13 below indicates the RCES for SADC member states as of 2019 at COP of US$59.06 per barrel (1kWh=0,006Barrels of Oil Equivalent) [30]. Apart from South Africa, it can be seen that the SADC member countries have RCES above 80%. As earlier mentioned this shows that the member countries have the ability to reduce their RCES. In short this indicates that the majority of SADC countries spend less on electricity from their GDP.
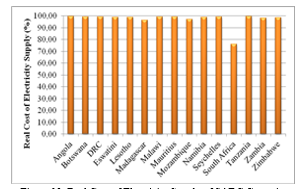
Figure 13: Real Cost of Electricity Supply of SADC Countries
4. RE Support Policies for improving the Sustainability of Energy in the SADC Countries
To ensure private sector participation in electricity Ensuring the participation of the private sector in the electricity industry and the successful development and dissemination of programs for renewable energy technologies (RETs) in the SADC region, as well as encouraging investment in RETs. A number of additional incentives and RE support policies have been/have been established by the SADC member countries, including (see table 8)[11,31,32]:
- Renewable Energy Targets
- Renewable Energy in NDC or INDC
- Regulatory Policies
- Feed-in-Tariff/ Premium Payment
- Electric Utility Quota Obligation
- Net Metering
- Grid Code Revisions
- Tradable Renewable Energy Credit
- Renewable Energy Project Tendering
- Capital Subsidy’ Grant or Rebate
- Fiscal Incentives & Public Financing
- Investment /Production Tax Credits
- Reductions in Sales, Energy’ CO2, VAT or other taxes
- Energy Production Payment
- Public Investment Loans or Grants
As illustrated in Table 8, all SADC member countries have progressed to establishing policies on RE technologies. However, these policies vary according to the country targets and goals set in the national master plans.
Table 8: RE Support Policies in SADC Member States as of Mid-2018 [9,31]
| Member States | RE Targets | RE in NDC or INDC | Regulatory Policies | Fiscal Incentives & Public Financing | ||||||||||
| FiT/ Premium Payment | Electric Utility Quota Obligation | Net Metering | Biofuels Obligation/
Mandates |
Grid Code Revisions | Tradable RE Credit | Tendering | Capital Subsidy’ Grant or Rebate | Investment /Production Tax Credits | Reductions in Sales, Energy’ CO2,VAT or other taxes | Energy Production Payment | Public Investment Loans or Grants | |||
| Angola | § | § | § | § | § | § | § | § | ||||||
| Botswana | § | ü | § | ü | ||||||||||
| DRC | § | |||||||||||||
| Eswatini | ü | § | § | ü | ü | |||||||||
| Lesotho | § | § | ü | ü | ü | ü | ||||||||
| Madagascar | § | § | ü | ü | ü | |||||||||
| Malawi | § | § | ü | § | ü | ü | ü | ü | ||||||
| Mauritius | § | § | ü | ü | § | § | § | ü | ü | |||||
| Mozambique | § | § | ü | |||||||||||
| Namibia | § | § | ü | § | § | |||||||||
| Seychelles | § | § | ü | ü | ü | ü | ü | |||||||
| South Africa | § | § | ü | § | § | § | § | § | § | § | ü | |||
| Tanzania | § | § | ü | ü | ü | ü | § | ü | ü | |||||
| Zambia | § | § | § | § | § | ü | § | § | ü | |||||
| Zimbabwe | § | § | ü | ü | § | § | § | ü | ||||||
5. Key Findings and Conclusion
A total of 15 SADC Member States are analyzed in this paper, with a focus on the ability to provide reliable, effective and environmentally friendly energy systems. The analysis was carried out on the basis of performance measures of the electricity sector and factors such as availability, supply and demand for electricity, access to electricity and the environmental social effects of the use and development of electricity in the Member States. The research outcomes;
The economy of the SADC region is highly dependent on commodities. The world market saw a decline in oil prices over time and this culminated in a dramatic decrease in the SADC countries’ economy. SADC Member States are currently facing a challenge with regard to electricity access levels, especially in rural areas, with only Mauritius and Seychelles achieving 100% access to electricity in both rural and urban areas. The region’s population is around 341 million people, but just 48 percent of the total households have access to electricity. Studies by SACREE (2018) show that the majority of people live in rural areas and only 32% of the total population in rural areas has access to modern energy facilities, with electricity being available to only 75% of the total urban population.
- Low-carbon renewable energy technologies (RETs) are expected to contribute significantly to future electricity as all SADC member countries set goals are met by 2030, and the SADC region will be greener and cleaner relative to current trends.
SADC member countries have adopted subsidies as a affordability and accelerate access to electricity. Subsidies are proving to burden the national budget. In the case of Zambia, the country experienced enormous costs between the years 2014-2017 due to the electricity deficit resulting from electricity imports priced in neighboring countries at a cost-reflective tariff. This increased expenditure for the utility company (ZESCO) and the government.
- SADC Member States will benefit greatly from the diversification of RET and energy conservation policies as set out in the regional objectives. Adherence to the vast potential of RE sources in the area will negatively increase the degree of access to electricity in the region. In addition, the use of RE in the regional and national mix of electricity generation would lead to better health services and better living conditions for the population in both urban and rural areas, which will be significantly enhanced, resulting in safe and clean cities and communities.
It is therefore argued that policies addressing basic human needs, such as increased access to electricity and improved national or regional energy protection, are required in developing countries, and environmental and social acceptability should be taken into account. The cost of electricity is ideally representative of the cost and also represents the true cost of electricity services.
Conflict of Interest
The authors declare no conflict of interest.
Acknowledgment
The authors gratefully acknowledge the support provided by University of Johannesburg, University of Zambia, University of South Africa and Ege University.
- K.C.Bowa, M.Mwanza, M.Sumbwanyambe, K.Ulgen, J.H.Pretorius, Comparative Energy Sustainability Assessment of Electricity Industries In SADC Region: The Role of Renewable Energy In Regional And National Energy Diversification, 2019 IEEE 2nd international conference on renewable and power engineering REPE, Toronto Canada,2019.
- IEA, Global Energy and CO2 Status Report 2017,International Energy Agency (IEA), 2018.
- WEC, World Energy Trilemma Index 2017; Monitoring the Sustainability of National Energy Systems, World Energy Council (WEC), Available at:www.worldenergy.org (Accessed 14/03/2019)
- IPCC, Special Report on Renewable Energy Sources and Climate Change Mitigation, Summary for Policymakers, Intergovernmental Panel on Climate Change (IPCC), ISBN97-92-9169-131-9, 2012.
- P.Vithayasrichareon, Portfolio-Based Decision-Support Tool for Generation Investment and Planning in Uncertain and Low-Carbon Future Electricity Industries, PhD Thesis, The University of New South Wales, Sydney, Australia, June 2012
- IEA, The impact of the Covid-19 crisis on clean energy progress, IEA,2020a, Paris, Available at: https://www.iea.org/articles/the-impact-of-the-covid-19-crisis-on-clean-energy-progress
- IEA, Annual change in global energy-related CO2 emissions, 1900-2020, IEA,2020b, Paris, Available at: https://www.iea.org/data-and-statistics/charts/annual-change-in-global-energy-related-co2-emissions-1900-2020
- A. Brew-Hammond, Energy Access in Africa:Challenges ahead, Energy Policy, 38, 2291-2301, 2010.
- S. Karekezi, W.Kithyoma, Renewable Energy in Africa: Prospects and Limits, Renewable Energy Development, 2003.
- SADC, SADC Energy Monitor 2016; Baseline Study of the SADC Energy Sector. SADC, SARDC, Gaborone, Harare, 2016.
- SACREEE, SADC Renewable Energy and Energy Efficiency Status Report 2018, SADC Centre for Renewable Energy and Energy Efficiency(SACREEE), 2018
- WEC, Global Energy: Agenda, Challenges, Policies. presentation at 12th International Energy Forum, Cancun, Mexico, 29-31 March 2010.
- C. Aleh and J.Jessica, The concept of energy security.Beyond the four As, Energy Policy, 75, 415-421, 2014.
- N. Wamukonya,. Power sector reform in developing countries: mismatched agendas, Energy Policy 31(12), 1273-1289, 2003.
- IEA, Energy Security, International Energy Agency (IEA), (2019). Available at: https://www.iea.org/topics/energysecurity/ (Accessed 09/03/2019).
- WEC, Deciding the Future: Energy Policy Scenarios to 2050. World Energy Council. London, 2007.
- J. Bengt, Security aspects of future renewable energy systems-A short overview, Energy 61, 598-605, 2013
- CIA, The World FactBook, Central Intelligence Agency (CIA), Available at: https://www.cia.gov/library/publications/resources/the-world-factbook/geos/sf.html (Accessed 20/03/2019)
- The world Bank, The World Energy Mix for Electricity Generation; Economic Indicators for Over 200 Countries,2015 Available at :https://www.theglobaleconomy.com/rankings/Carbon_dioxide_emissions_per_capita/ (Accesssed 18/03/2019)
- Oliver J, Cassilde M, Mbeo O, et al, Powering Africa, Unlocking Opportunities for Energy development in Southern Africa, Stockholm Environment Institution (SEI), 2018.
- IRENA, Africa 2030: Roadmap for a Renewable Energy Future, IRENA, 2015a, Abu Dhabi, www.irena.org/publications
- IRENA, African Power Sector: Planning and Prospects for Renewable Energy, Synthesis Report, International Renewable Energy Agency (IRENA),2015b, Abu Dhabi.
- K. Anme, SADC Sees growth in electricity generation capacity, CREAMER MEDIA, 2017.
- Energy Regulation Board (ERB). Energy Sector Report 2017. Lusaka: Zambia). Available at: www.erb.org.zm/downloads/esr2016.pdf (Accessed in October 2018)
- IRENA, Renewable capacity statistics 2018, International Renewable Energy Agency (IRENA),2018, Abu Dhabi
- IRENA, Southern African Power Pool: Planning and Prospects for Renewable Energy. International Renewable Energy Agency, 2013,Abu Dhabi. https://www.irena.org/ DocumentDownloads/Publications/ SAPP.pdf
- The world Bank, The World Energy Mix for Electricity Generation; Economic Indicators for Over 200 Countries, 2015, Available at :https://www.theglobaleconomy.com/rankings/Carbon_dioxide_emissions_per_capita/ (Accesssed 18/03/2019)
- A.Dakpogan, E.Smit, Measuring Electricity Security Risk, University of Stellenbosch Business School, 24 September 2018. Available at: https://mpra.ub.unimuenchen.de/89295/1/MPRA_paper_89295.pdf (Accessed 20/01/2019)
- M.Andre, J.Bengit, J.N.Lars, Assessing energy security:An overview of commonly used methodologies, Energy 73, 1-14, 2014.
- OilPrice, Oil Price Chart, Available at: https://oilprice.com/oil-price-charts/45 (Accessed 23/02/2019)
- Department of Minerals and Energy, South Africa, Renewable Energy Policy of the Republic of South Africa, 2003.
- Africa-EU Energy Partnership, Power Sector Market Brief: Zambia, 2013.

