
Fuzzy Analytical Hierarchy Process and Fuzzy Comprehensive Evaluation Method Applied to Assess and Improve Human and Organizational Factors Maturity in Mining Industry
Volume 6, Issue 2, Page No 75-84, 2021
Author’s Name: Yousra Karima), Abdelghani Cherkaoui
View Affiliations
Research Team EMISYS: Energetic, Mechanic and Industrial Systems, Engineering 3S Research Center, Industrial Engineering Department, Mohammadia School of Engineers, Mohammed V University, Rabat, 10010, Morrocco
a)Author to whom correspondence should be addressed. E-mail: yousrakarim@research.emi.ac.ma
Adv. Sci. Technol. Eng. Syst. J. 6(2), 75-84 (2021); ![]() DOI: 10.25046/aj060210
DOI: 10.25046/aj060210
Keywords: Human and Organizational Factors, Safety, Maturity Model, Analytic Hierarchy Process (AHP), Fuzzy Comprehensive Evaluation Method (FCEM), Fuzzy Logic

Export Citations
The literature shows a growing interest in taking into account human and organizational factors (HOFs) to achieve safe and successful human performance by reducing the risk of errors. In this sense, the concept of maturity models aims to help companies in the integration of these factors by assessing the current level of maturity and define future areas for improvement. The HOFs maturity model shown in this article is based on the five main factors that can impact human performance and safety positively. The measurement methodology consists in applying the Fuzzy Analytic Hierarchy Process (FAHP) method to calculate the weighting of the elements of the model since they do not have the same importance. Next, the Fuzzy Comprehensive Evaluation Method (FCEM) is used to determine the maturity level in terms of HOFs among the five proposed by performing an assessment of the sub-factors using a questionnaire. The purpose of using fuzzy logic is to deal with vagueness and uncertainty of the human reasoning . The proposed model and methodologies are implemented to bring out the current situation of a Moroccan mining organization and identify the elements that require more effort to reach the next level of maturity.
Received: 16 December 2020, Accepted: 20 February 2021, Published Online: 10 March 2021
1.Introduction
High risk organizations are increasingly aware of the importance of human and organizational factors and their impact on health and safety on work. The integration of these factors allows companies to achieve safe and successful human performance, by understanding the interactions between humans and other elements of complex systems in order to predict and reduce accidents and incidents.
There are several approaches bringing together the elements that contributed to major accidents in the past, from the implementation of the Seveso I and II Directives to the integration of the Human and Organizational Factors. However, it is difficult for the company to choose the right approach and to know which specific areas of HOFs need to be prioritized. Therefore, the frequently asked questions are : Where are we and where do we want to be ?. These questions are used to define the current state of the company and the desired objective.
The maturity model concept has been developed to answer these questions, by assisting companies in the maturity assessment process and identifying the required areas for improvement. The HOFs maturity model describes the main characteristics allowing a safe human contribution and optimizing the overall performance of the system, it enables the company to determine the maturity in terms of HOFs among a set of suggested levels.
This paper is an extension of work originally presented in “2020 IEEE 6th International Conference on Optimization and Applications” [1], in which a new HOFs maturity model is described. The model is made up of the five crucial factors related to HOFs and proposed five maturity levels that reflect the degree of consideration and integration of these factors through planned procedures.
The difference between the conference paper [1] and this article is the inclusion of fuzzy logic in the weighting calculation phase, by using the Fuzzy AHP method instead of the Analytic Hierarchy Process (AHP) to take into consideration the imprecision and vagueness of human judgements , when assessing the relative importance of the hierarchy elements in order to perform the comparison matrices . Therefore, the proposed methodology consists in combining the FAHP method to determine the weights and the FCEM to assess the HOFs maturity level.
The proposed maturity model is implemented in a Moroccan organization operating in the mining industry to bring out the current situation by measuring its own HOFs maturity level, then define future targets and establish an action plan including the elements to improve.
The next sections are structured as follows: The section “Literature Review” describes the frequently cited models. In section “ HOFs Maturity Model” the elements and levels of the model are presented. While section “Methodology” explains the FAHP and FCEM used. A numeric application is given in “Case Study” section, before the “Conclusion”.
Literature Review
Research indicates a significant growth in the use of maturity models for safety culture assessment and the integration of human and organizational factors, particularly in high-risk areas such as construction and the oil and gas industry. A maturity model describes the key or essential elements that should characterize an organization at a particular maturity level either in relation to safety culture or to HOFs.
The use of maturity models as an assessment tool can be attributed to two main sources, namely, the “Quality Management Maturity Grid (QMMG)” and Westrum’s “Typology of Organisations”. The QMMG was suggested in 1979, it identified the five stages that an organization goes through to achieve the maximum quality level in all aspects of quality management these are: uncertainty, awakening, enlightenment, wisdom and certainty [2].
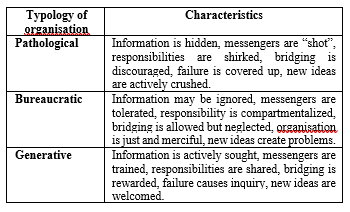
Typology of organisational cultures was proposed in 1993. Table 1 describes the characteristics of the three organisational types suggested. To allow a meticulous classification, while increasing employees’ accessibility by including familiar terms, the typology was extended to these five levels : Pathological, Reactive, Calculative, Proactive and Generative [3].
Table 1: Westrum’s Typology of Organisations
 In [4], the author used this concept of maturity to create a model named “safety culture maturity model (SCCM)” to help oil companies in the United Kingdom to assess culture maturity level and the actions needed to improve it. The five stages of the SCCM are shown in Figure 1.
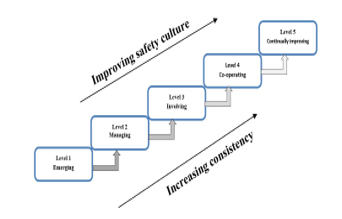 Figure 1: Safety Culture Maturity Model
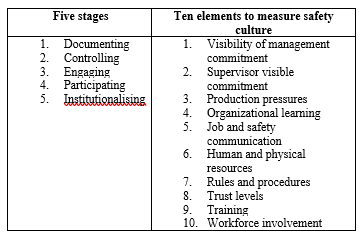
Based on the SCCM and a thorough literature review of existing models, the author developed in [5] the “Cultural Maturity Model (CMM)” for companies that have an adequate safety management system and wish to evaluate and improve it. Table 2 summarizes the ten elements of the CMM selected to measure key characteristics related to a positive safety culture, and the five developmental stages suggested.
Table 2: Cultural Maturity Model Elements and Stages
Workforce involvement
In [6, 7], the author proposed a maturity model, based on the extended Westrum’s typology, to describe the evolution of safety culture from the disease stage to a generative end stage. Figure 2 shows the development stages of the model.
From the previous model, a framework was developed to determine the stages of maturity of an organization’s safety culture by conducting in-depth interviews with 26 senior oil industry executives working in various multinational and contracting companies [8,9]. It contains 11 tangible or concrete elements related to the safety management system, and 7 less tangible or abstract elements involving perceptions of the workforce. The eighteen elements are divided as follows:
Tangible or concrete elements: 1. Benchmarking, Trends & Statistics; 2. Audits & Reviews; 3. Incident/Accident Reporting, Investigation & Analysis; 4. Hazard and Unsafe Act reports; 5. Work planning including PTW, Journey Management; 6. Contractor Management; 7. Competency/Training; 8. Work-site Job Safety Techniques; 9. Who Checks Safety on a day to day basis? 10. What is size & status of the HSE Department? 11. What are the rewards of good safety performance?
Less tangible or abstract elements: 1. Who causes accidents in the eyes of management? 2.What happens after an accident? Is the feedback Loop being closed? 3. How do safety meetings feel? 4. Balance between HSE & Profitability? 5. Is management interested in communicating HSE issues with the workforce? 6. Commitment level of the workforce and level of care for colleagues. 7. What is the purpose of procedures?
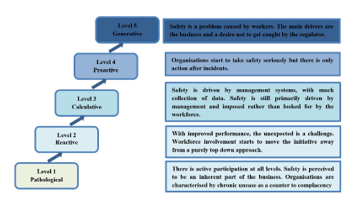 Figure 2: Safety Culture Model of Hudson
Maturity models have also been used to measure the level of integration of human factors, as they are essential to achieve safe human performance. The “ Human Factors Maturity Model (HFMM)” was designed to help companies wishing to improve their maturity level by determining which items require additional effort in the future [10]. It includes 5 levels from the first Emerging level to a final level called Leading, and 12 key elements of human factors that highlight their relevance to major accidents in the literature. For each item, a card sorting methodology is used to assess the current level of maturity by representatives of organizations, then define the requirements needed to improve maturity to the next level. The elements and levels of the HFMM are shown in Table 3.
Maturity models have been used by several industries in the literature following different measurement methods, which often require precise human judgment to choose one of the maturity levels. And since human judgment is imprecise and vague, the model proposed in this article includes fuzzy logic to remedy this issue [11].
Table 3: Human Factors Maturity Model
HFMM Levels
HFMM Elements
1. Emerging
2. Transitional
3. Planned
4. Proactive
5. Leading
1. Managing Human Failure (including maintenance)
2. Human Factors in Incident Investigation
3. Design and Development of Procedures
4. Training and Competence
5. Staffing and Workload
6. Managing Organisational Change
7. Safety-Critical Communications
8. Human Factors in Design
9. Fatigue and Shift work
10. Safety Culture and Behaviour
11. Contractor Management
12. Managing Performance under Pressure
HOFs Maturity Model
A review of the literature was carried out to select the human and organizational factors that affect human performance, in order to reduce accidents and improve the safety level of organizations. The maturity model presented in this article is developed based on the five key factors [1] cited by the Rail & Safety Standards Board (RSSB) in their guide “Understanding human factors” [12] namely:
Design F1: The consideration of HOFs in the design is a crucial step to ensure that the organization does not miss major opportunities for improving human performance at work and to eliminate the risk of accidents, loss of personnel and significant financial costs.
Training F2: Numerous studies demonstrate the effectiveness of training in business growth. The results of training are concrete and measurable both in productivity and in the professional development of the staff. Although a company may have carefully screened its employees, training within the company itself will allow them to have the same vision of things and move in the same direction.
Staffing F3: Recruiting and retaining the right people is critical to the success of every organization. Selecting the wrong skills can lead to organizational weakness.
Culture F4: Culture is essential to allow the organization to differentiate itself. In terms of image on the one hand, it has advantages both internally and externally to consumers. It is indeed a source of cohesion and motivation of employees and it limits conflicts.
Conditions F5: The improvement of working conditions to ensure the well-being of the employee must first affect health and safety. All employees wish to carry out their work in a healthy and pleasant atmosphere, in which they can feel the recognition and consideration of their efforts.
Table 4 lists the sub-factors linked to each of the five factors, which allow to determine the maturity level in terms of HOFs among the five presented in Figure 3. [1]
Table 4: HOFs Maturity Model
| Goal: Human Performance and Safety | Human and Organizational Factors | Sub-Factors |
1. Design F1 |
Equipment Design F11
Workplace Design F12 Job Design F13 |
|
2. Training F2 |
Effective Training Programme F21
Training Appraisal F22 |
|
3. Staffing F3 |
Recruitment F31
Retention F32 |
|
4. Culture F4 |
LeadershipF41
Management F42 Teamworking F43 Communication F44 Change F45 |
|
5. Conditions F5 |
Morale & Motivation F51
Stress F52 Workload F53 Shift Work F53 |
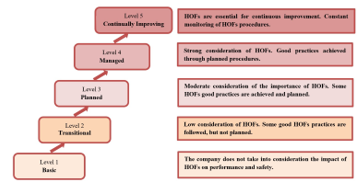 Figure 3: Maturity Levels Description
To ensure the understanding and appropriate application of the model, a set of good practices related to each sub-factor have been listed. For the retention sub-factor, as an example, the best practices relevant to employee satisfaction and retention are presented below:
Offer rewards.
Listen to your staff.
Carry out training.
Improve your team culture.
Develop career paths.
Understand why people quit.
Maintain dialogue with staff
Table 5 provides an overview of the questionnaire developed to facilitate data collection during the maturity assessment. The questions are established from the proposed model to bring out the information concerning the sub-factors.
Measurement Methodology
The methodology proposed in this work is based on the use of FAHP method instead of AHP to calculate the factors and sub-factors weightings, that reflect their impacts on human performance and safety. For the HOFs maturity level assessment, the FCEM method is utilized to consider the imprecision and uncertainty of decision-makers’ judgment.
Below are explained the FAHP and FECM methods used for the model implementation.
4.1 Fuzzy AHP
Fuzzy AHP method is an extension of the AHP introduced in 1970 [13], used to solve complex decision-making problems. This method deals with the ambiguity and vagueness of decision-makers that cannot be addressed by precise values by integrating fuzzy logic [11].
Many extensions of AHP have been proposed by several authors such as the geometric mean method [14]. In this paper, the HOFs model utilized the extent analysis approach proposed in [15] given the simplicity and ease of application using triangular fuzzy numbers (TFNs) for the pairwise comparisons.
The steps of the FAHP method are [16, 17]:
Step 1: Construct the AHP hierarchy by identifying factors and sub-factors of the model.
Step 2: Compare by pair the factors and sub-factors to calculate the local weights using the fuzzy scale [18] shown in Table 6 and Figure 4. This scale is used in Chang’s FAHP method described below.
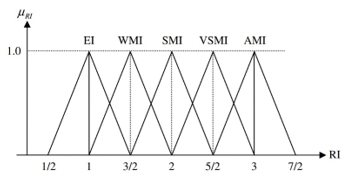 Figure 4: Linguistic Scale for Relative Importance
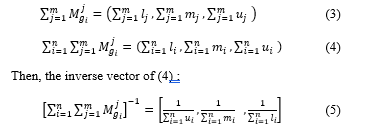
Assume that X = {x_1,x_2,… ,x_n} is an object set, and U = {u_1,u_2,… ,u_m} is a goal set. For each object, an extent analysis is performed for each goal g_i. Therefore, m values of the extent analysis are obtained for each object, as follows:
![]()
where M_(g_i)^j ( j=1, 2, … , m) are TFNs. A TFN is simply denoted (l,m,u).
The value of fuzzy synthetic Si for the i-th object is:
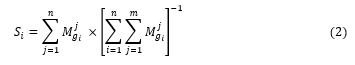
The fuzzy addition operations are performed with m values.
The degree of possibility of S_2=(l_2,m_2,u_2)≥ S_1=(l_1,m_1,u_1) is defined as:
![]()
Which can be expressed equivalently as follows:
![]() Table 5: HOFs Questionnaire Overview
Table 5: HOFs Questionnaire Overview
| Questions | Answers | Questions | Answers |
| 1. Is the design of the equipment meet user needs (visibility, workflow, constraints, environment, workload, etc.)? | 1. All equipment takes into consideration the needs of the users. 2. An important part of the equipment meets the needs of users. 3. Only critical equipment considers the needs of users. 4. Some critical equipment takes user needs into account. 5. No equipment follows user needs. |
7. How do you find the efforts made by the company to keep the people recruited?
8. How do you rate the involvement of managers and leaders in the HOFs procedures? |
1. Excellent. 2. Good. 3. Medium. 4. Basic. 5. No efforts.1. Extreme involvement. 2. Good involvement. 3. Medium involvement 4. Basic involvement. 5. No involvement. |
| 2. How do you assess the design of the workplace?3. How do you perceive the job design (job descriptions) produced by the company? |
1. Excellent design (The company is always looking for ways to improve). 2. Good design. 3. Medium design. 4. Basic. 5. Poor (The company is not aware of the impact of good design). |
10. How do you perceive the supervision of teamwork within your company?
11. How do you rate the quality of communication? |
1. Extremely supervised. 2. Good supervision. 3. Medium supervision. 4. Basic supervision 5. No supervision.1. Excellent. 2. Good. 3. Medium. 4. Basic. 5. Insufficient. |
| 4. How do you rate the effectiveness of the training programs?
5.How do you perceive the selection and recruitment process? |
1. Extremely effective. 2. Effective 3. Medium effectiveness. 4. Low effectiveness. 5. Not at all effective. |
12. How would you rate the practices put in place by the company to improve morale and motivate employees at work?
13. How do you see the strategy adopted by the company to manage stress? |
1. Excellent. 2. Good. 3. Medium. 4. Basic. 5. Insufficient. |
| 6. How do you perceive the process of assessing the trainings carried out by the company (reaction of trainees, learning objectives…)? | 1. Excellent assessment 2. Good assessment. 3. Medium assessment. 4. Baseline assessment. 5. Insufficient assessment. |
14. How do you perceive the workload?
15. How do you perceive the work shift planning ? |
1. In standards 2. Normal but disrupted on some occasions. 3. Moderately excessive. 4. Excessive . 5. Extremely excessive. |
Table 6: Linguistic Scale for Relative Importance
| Linguistic scale for relative importance | Triangular Fuzzy Scale |
| Just Equal | (1, 1, 1) |
| Equally Important (EI) | (1/2, 1, 3/2) |
| Weakly more important (WMI) | (1, 3/2, 2) |
| Strongly more important (SMI) | (3/2, 2, 5/2) |
| Very strongly more important (VSMI) | (2, 5/2, 3) |
| Absolutely more important (AMI) | (5/2, 3, 7/2) |
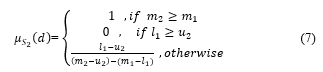
where d is the ordinate of the highest intersection point D between μ_(S_1 )and μ_(S_2 )(Figure 5).
Both the values of V(S_2≥ S_1) and V(S_1≥ S_2) are needed to compare S_1 and S_2.
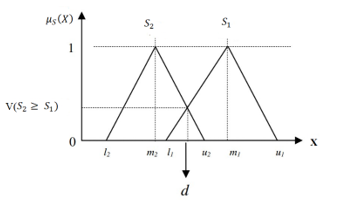 Figure 5: Intersection Between S_1 and S_2
The degree possibility for a convex fuzzy number to be greater than k convex fuzzy numbers S_i (i =1,. . . , k) can be expressed by:
V(S≥ S_1,S_2 ,…,S_k)=V[(S≥ S_1 ),…,(S≥ S_k)]=
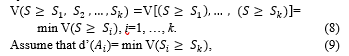
for k =1, …, n , k≠i. Then the weight vector W’ is given by:
![]()
where A_i (i=1,2,…,n) are n elements.
Finally, the normalized weight vectors are obtained:
![]()
where W is a crisp number.
Fuzzy Comprehensive Evaluation Method
The fuzzy comprehensive evaluation method is based on fuzzy logic theory developed in [11]. Unlike the system of classical logic, it aims to deal with uncertainty, subjectivity, and vagueness of human reasoning. The FCEM principles are used with the proposed model to assess the maturity level of HOFs as follows [1, 19, 20, 21, 22]:
Let V={V_1,V_2,…,V_p}, the evaluation set.
Step 1: Construct the evaluation matrix R_ij named the second-class index membership matrix.
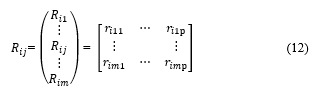 where
where
R_ij is a fuzzy relationship from F_i’s sub-factors (F_ij) to V.
Where: i=1, …, n is the number of factors to be evaluated.
j=1, …, m is the second index of i, and m is the number of sub-factors(F_ij) of a factor (F_i).
R_ij is a fuzzy relationship from F_ij to V.
![]() β =∑_(k=1)^(k=p)▒l_ijk is the experts’ number, k=1, …, p is the evaluation level.
β =∑_(k=1)^(k=p)▒l_ijk is the experts’ number, k=1, …, p is the evaluation level.
Step 2: Compute the matrix R named the first-class index membership matrix.
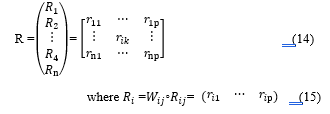
W_ij is the weight vector obtained from the FAHP method.
Step 3: Calculate the maturity vector M:
 Finally, the maturity level is determined according to the principle of maximum membership degree law as following:
If r_k = Max (■(r_1&⋯&r_p )) , the maturity level is k.
Case study
The HOFs maturity model and the methodologies developed in this paper are implemented in a Moroccan organization operating in the mining industry to define potential future steps essential to improve human performance and safety level. Therefore, a group of decision makers was selected for the acquisition of input data and the application of the FAHP and FCEM methods. The comparisons matrices were done by the representatives of managers, supervisors and operators. Unlike the assessment step, which was carried out separately, first with the Group 1 of managers, next with the Group 2 of supervisors and site operators.
Results
The representatives performed the pairwise comparisons of factors and sub-factors listed in Table 4 using the fuzzy scale illustrated in figure 6 [18], and obtained the results shown in Tables 7, 8, 9, 10, 11, 12.
Table 7: Weights and Comparison Matrix of Factors
| Goal | F1 | F2 | F3 | F4 | F5 | Weights |
| F1 | (1, 1,1) | (3/2, 2, 5/2) | (1/2, 1, 3/2) | (1/2, 2/3, 1) | (2/5, 1/2, 2/3) | 0.17 |
| F2 | (2/5,1/2,2/3) | (1, 1, 1) | (2/3, 1, 2) | (2/5,1/2,2/3) | (2/5,1/2,2/3) | 0.07 |
| F3 | (2/3, 1, 2) | (1/2, 1, 3/2) | (1, 1, 1) | (2/5,1/2,2/3) | (1/3, 2/5, 1/2) | 0.10 |
| F4 | (1, 3/2, 2) | (3/2, 2, 5/2) | (3/2, 2, 5/2) | (1, 1, 1) | (1/2, 2/3, 1) | 0.29 |
| F5 | (3/2, 2, 5/2) | (3/2, 2, 5/2) | (2, 5/2, 3) | (1, 3/2, 2) | (1, 1, 1) | 0.37 |
Factors and sub-factors weights are computed using Chang’s FAHP method [15] described above. A numerical overview of the steps is given below to calculate weights shown on the right of Table 7.
SF1= (0.10, 0.18, 0.30) ; SF2= (0.08, 0.12, 0.23) ;
SF3= (0.08, 0.14, 0.26) ; SF4= (0.15, 0.25, 0.41) ;
SF5= (0.19, 0.31, 0.50).
V (SF1 ≥ SF2) = 1; V (SF1 ≥ SF3) = 1; V (SF1 ≥SF4) = 0.69;
V (SF1 ≥ SF5) = 0.46.
V (SF2 ≥ SF1) = 0.68; V (SF2 ≥ SF3) = 0.91 ;
V (SF2 ≥ SF4) = 0.38 ; V (SF2 ≥ SF5) = 0.17.
V (SF3 ≥ SF1) = 0.77; V (SF3 ≥ SF2) = 1 ; V (SF3 ≥ SF4) = 0.49 ; V (SF3 ≥ SF5) = 0.28.
V (SF4 ≥ SF1) = 1 ; V (SF4 ≥ SF2) = 1 ; V (SF4 ≥ SF3) = 1 ;
V (SF4 ≥ SF5) =0.77.
V (SF5 ≥ SF1) = 1; V (SF5 ≥ SF2) = 1 ; V (SF5 ≥ SF3) = 1 ;
V (SF5 ≥ SF4) =1.
d’(AF1) = V (SF1 ≥ SF2, SF3, SF4, SF5) = 0.46 ;
d’(AF2) = V (SF2 ≥ SF1, SF3, SF4, SF5) = 0.17 ;
d’(AF3) = V (SF3 ≥ SF1, SF2, SF4, SF5) = 0.28 ;
d’(AF4) = V (SF4 ≥ SF1, SF2, SF3, SF5) =0.77 ;
d’(AF5) = V (SF5 ≥ SF1, SF2, SF3, SF4) =1 .
Then, the weight vector of factors is obtained:
W = (d’(AF1), …, d’(AF5))T= (0.17, 0.06, 0.10, 0.29, 0.37).
Table 8: Weights and Comparison Matrix of F1 Sub-Factors
| F1 | F11 | F12 | F13 | Weights |
| F11 | (1, 1, 1) | (1, 3/2, 2) | (1, 3/2, 2) | 0.45 |
| F12 | (1/2, 2/3, 1) | (1, 1, 1) | (3/2, 2, 5/2) | 0.40 |
| F13 | (1/2, 2/3, 1) | (2/5, 1/2, 2/3) | (1, 1, 1) | 0.15 |
Table 9: Weights and Comparison Matrix of F2 Sub-Factors
| F2 | F21 | F22 | Weights |
| F21 | (1, 1, 1) | (1, 3/2, 2) | 0.68 |
| F22 | (1/2, 2/3, 1) | (1, 1, 1) | 0.32 |
Table 10: Weights and Comparison Matrix of F3 Sub-Factors
| F3 | F31 | F32 | Weights |
| F31 | (1, 1, 1) | (1/2, 1, 3/2) | 0.50 |
| F32 | (2/3, 1, 2) | (1, 1, 1) | 0.50 |
Table 11: Weights and Comparison Matrix of F4 Sub-Factors
| F4 | F41 | F42 | F43 | F44 | F45 | Weights |
| F41 | (1, 1,1) | (1, 3/2, 2) | (1/2, 1, 3/2) | (3/2, 2, 5/2) | (2, 5/2, 3) | 0.32 |
| F42 | (1/2, 2/3, 1) | (1, 1, 1) | (2/3, 1, 2) | (1, 3/2, 2) | (3/2, 2, 5/2) | 0.25 |
| F43 | (2/3, 1, 2) | (1/2, 1, 3/2) | (1, 1, 1) | (1, 3/2, 2) | (3/2, 2, 5/2) | 0.26 |
| F44 | (2/5, 1/2, 2/3) | (1/2, 2/3, 1) | (1/2, 2/3, 1) | (1, 1, 1) | (1, 3/2, 2) | 0.14 |
| F45 | (1/3, 2/5, 1/2) | (2/5,1/2,2/3) | (2/5,1/2,2/3) | (1/2, 2/3, 1) | (1, 1, 1) | 0.03 |
Table 12: Weights and Comparison Matrix of F5 Sub-Factors
| F5 | F51 | F52 | F53 | F54 | Weights |
| F51 | (1, 1,1) | (1/2, 2/3, 1) | (2/5, 1/2, 2/3) | (2/5, 1/2, 2/3) | 0.10 |
| F52 | (1, 3/2, 2) | (1, 1, 1) | (1/2, 2/3, 1) | (1/2, 2/3, 1) | 0.23 |
| F53 | (3/2, 2, 5/2) | (1, 3/2, 2) | (1, 1, 1) | (1/2, 1, 3/2) | 0.34 |
| F54 | (3/2, 2, 5/2) | (1, 3/2, 2) | (2/3, 1, 2) | (1, 1, 1) | 0.34 |
Once the weights were calculated, an evaluation of the sub-factors was conducted by the two groups, separately, using the questionnaire and FCEM. The results obtained are shown in Tables 13, 14.
Table 13: FAHP Weights and Evaluation Results of Group1
|
Factors |
Sub-Factors |
Weights |
Evaluation results | ||||
| Basic (B) | Transitional (T) | Planned (P) | Managed (M) | Continually improving (CI) | |||
|
F1 |
F11 | 0.45 | 0.00 | 0.00 | 0.25 | 0.50 | 0.25 |
| F12 | 0.40 | 0.00 | 0.00 | 0.58 | 0.42 | 0.00 | |
| F13 | 0.15 | 0.00 | 0.00 | 0.50 | 0.33 | 0.17 | |
| F2 | F21 | 0.68 | 0.00 | 0.00 | 0.33 | 0.58 | 0.08 |
| F22 | 0.32 | 0.08 | 0.42 | 0.42 | 0.08 | 0.00 | |
| F3 | F31 | 0.50 | 0.00 | 0.00 | 0.00 | 0.58 | 0.42 |
| F32 | 0.50 | 0.00 | 0.42 | 0.42 | 0.17 | 0.00 | |
|
F4 |
F41 | 0.32 | 0.00 | 0.00 | 0.17 | 0.33 | 0.50 |
| F42 | 0.25 | 0.00 | 0.00 | 0.08 | 0.50 | 0.42 | |
| F43 | 0.26 | 0.00 | 0.00 | 0.50 | 0.50 | 0.00 | |
| F44 | 0.14 | 0.00 | 0.08 | 0.42 | 0.42 | 0.08 | |
| F45 | 0.03 | 0.00 | 0.08 | 0.33 | 0.58 | 0.00 | |
|
F5 |
F51 | 0.10 | 0.00 | 0.58 | 0.33 | 0.08 | 0.00 |
| F52 | 0.23 | 0.17 | 0.58 | 0.25 | 0.00 | 0.00 | |
| F53 | 0.34 | 0.00 | 0.00 | 0.92 | 0.08 | 0.00 | |
| F54 | 0.34 | 0.00 | 0.00 | 0.25 | 0.75 | 0.00 | |
Table 14: FAHP Weights and Evaluation Results of Group 2
|
Factors |
Sub-Factors |
Weights |
Evaluation results | ||||
| Basic (B) | Transitional (T) | Planned (P) | Managed (M) | Continually improving (CI) | |||
|
F1 |
F11 | 0.45 | 0.00 | 0.00 | 0.50 | 0.33 | 0.17 |
| F12 | 0.40 | 0.00 | 0.33 | 0.42 | 0.25 | 0.00 | |
| F13 | 0.15 | 0.00 | 0.00 | 0.67 | 0.33 | 0.00 | |
| F2 | F21 | 0.68 | 0.00 | 0.08 | 0.25 | 0.50 | 0.17 |
| F22 | 0.32 | 0.17 | 0.58 | 0.25 | 0.00 | 0.00 | |
| F3 | F31 | 0.50 | 0.00 | 0.00 | 0.17 | 0.67 | 0.17 |
| F32 | 0.50 | 0.08 | 0.42 | 0.33 | 0.17 | 0.00 | |
|
F4 |
F41 | 0.32 | 0.00 | 0.00 | 0.17 | 0.67 | 0.17 |
| F42 | 0.25 | 0.00 | 0.08 | 0.08 | 0.67 | 0.17 | |
| F43 | 0.26 | 0.00 | 0.33 | 0.58 | 0.08 | 0.00 | |
| F44 | 0.14 | 0.00 | 0.25 | 0.58 | 0.17 | 0.00 | |
| F45 | 0.03 | 0.17 | 0.50 | 0.17 | 0.17 | 0.00 | |
|
F5 |
F51 | 0.10 | 0.33 | 0.50 | 0.08 | 0.08 | 0.00 |
| F52 | 0.23 | 0.17 | 0.58 | 0.08 | 0.17 | 0.00 | |
| F53 | 0.34 | 0.00 | 0.17 | 0.67 | 0.17 | 0.00 | |
| F54 | 0.34 | 0.00 | 0.00 | 0.58 | 0.17 | 0.25 | |
The sub-factors’ weights and the assessment results are subsequently used to determine the first-index membership matrix of the two groups represented in Tables 15, 16.
Table 15: First-Class Index Membership Matrix of Group 1
|
Factors |
Weights |
Levels | ||||
| B | T | P | M | CI | ||
| F1 | 0.17 | 0.00 | 0.00 | 0.42 | 0.44 | 0.14 |
| F2 | 0.07 | 0.03 | 0.13 | 0.36 | 0.42 | 0.06 |
| F3 | 0.10 | 0.00 | 0.20 | 0.21 | 0.38 | 0.21 |
| F4 | 0.29 | 0.00 | 0.01 | 0.27 | 0.44 | 0.28 |
| F5 | 0.37 | 0.04 | 0.19 | 0.48 | 0.29 | 0.00 |
Table 16: First-Class Index Membership Matrix of Group 2
|
Factors |
Weights |
Levels | ||||
| B | T | P | M | CI | ||
| F1 | 0.17 | 0.00 | 0.13 | 0.49 | 0.30 | 0.08 |
| F2 | 0.07 | 0.05 | 0.24 | 0.25 | 0.34 | 0.12 |
| F3 | 0.10 | 0.04 | 0.21 | 0.25 | 0.42 | 0.08 |
| F4 | 0.29 | 0.00 | 0.16 | 0.31 | 0.43 | 0.10 |
| F5 | 0.37 | 0.07 | 0.24 | 0.45 | 0.16 | 0.08 |
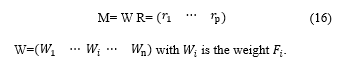
Finally, the HOFs maturity vector (HOFM) is determined using Tables 15, 16 and factors’ weights.
HOMF1(Group 1) = (0.02, 0.10, 0.37, 0.38, 0.13)
HOMF2(Group 2) = (0.03, 0.16, 0.37, 0.33, 0.11)
Discussions
According to the maximum membership degree law and maturity vectors (HOMF1, HOMF2) obtained from both groups, the maturity level of the company is “Managed” for Group 1 and “Planned” for Group 2. Therefore, the managers assume that there is a strong consideration of HOFs, and good practices are achieved through planned procedures. While supervisors and operators suppose that the impact of HOFs on safety and human performance is moderately taken into account, and some good practices related to HOFs are fulfilled in a planned manner.
The maturity levels of factors are deducted from the first-class index membership matrices (Tables 15, 16). Then, the results are presented on spider diagrams below. Figure 6 shows the factors’ maturity levels obtained from the assessment carried out with Group 1 of managers, and Figure 7 shows the levels obtained from the evaluation undertaken by Group 2 consisting of supervisors and operators.
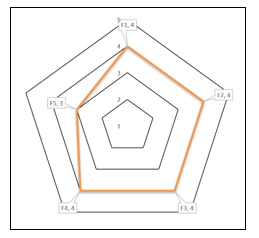 Figure 6: Spider Diagram of Group 1
The two diagrams show that no factor is judged at level 5 “Continually Improving”. The results obtained are close for both groups despite the hierarchical diversity. The three factors: “Staffing”, “Training” and “Culture” are at the same maturity level 4 “Managed”. The factor “Conditions” is also at level 3 “Planned” for the two groups. However, the “Design” factor is at level 4 “Managed” for Group 1 and level 3 “Planned” for group 2.
 Figure 7: Spider Diagram of Group 2
The purpose of this model is not only to assess maturity in terms of HOF, but also to assist the company in defining future improvement steps to reach the next level of maturity. For this mining organization, it is necessary to provide more effort regarding the “Conditions” factor since it has the highest weighting, and it is evaluated at level 3 for both groups. Then, for the factor “Design” which has such an important impact, it is recommended to take into consideration the opinions of supervisors and operators to improve the current state and satisfy their needs.
After this study, an action plan made up of some good practices essential for improvement was established based on elements weights and the assessment carried out by the groups. Table 17 shows a summary of the proposed action plan.
Conclusion
There is a remarkable growth in the use of maturity models to assess safety culture and HOFs, but also different variations in the elements of these models and measurement methodology. These models can be used for maturity assessment in any industry and as an improvement tool by identifying strengths and weaknesses related to a set of key elements.
This work introduces a maturity model related to HOFs made up of the five factors essential to human performance and safety. The model defines five stages of maturity, from the lower level where the company does not take into consideration the impact of HOFs, to the upper level characterized by continuous enhancement and permanent follow-up of HOFs procedures. The measurement methodology differs here in the first phase, which consists of using Fuzzy AHP method instead of AHP to calculate the weights. And for the second phase, a questionnaire is included to facilitate the collection of data used in the FCEM method.
The HOFs model is applied in a Moroccan mining company to determine the current maturity level and improve it through an appropriate action plan. Teams of managers, supervisors and operators who participated in implementing the model have used it successfully, and it has proven to be a useful tool for evaluation an improvement.
Future work will focus on improving the current HOFs maturity model by testing and adapting it for a wide range of companies, so that it is not limited to a particular area. Also, conducting a sensitivity analysis [23] to test the robustness of the model and better understand relationships between the elements.
Table 17: Improvement Action Plan Related to HOFs
| Element | Good practices |
|
Morale and Motivation |
· Show them the results of their efforts.
· Give them responsibilities. · Ask them what motivates them. · Give them some advantages. · Offer them training courses. |
|
Stress |
· Stress management training: Ask employees to take relaxation and time management courses and take internships or do assertiveness exercises.
· Ergonomics and design of the professional environment: Improve the equipment used at work and the physical working conditions. · Improve management: Improve the attitude of managers towards work stress, their knowledge and understanding of this problem and their ability to tackle it as effectively as possible. · Company development: Implement better work and management systems. Develop a friendlier corporate culture and a spirit of mutual aid. |
|
Workload |
· Identify your team’s workload and capacity.
· Allocate resources and manage individual workloads. · Check in with your team and adjust workloads if necessary. · Improve efficiency under over workloads. · Adopt a work management tool |
|
Workplace Design |
In order to design a workplace that allows the employee to obtain optimal working conditions, the following steps must be taken :
· A preliminary evaluation. · Employee participation. · Employee training. · A detailed report of observations. · A follow-up visit by the processionals to validate the effectiveness of the changes made to the workstations and the maintenance of the new work habits. |
|
Job Design |
For a better job desgin, several fundamental elements must be taken into account by the employer :
· The job identification includes information such as the job title and the information that characterizes it: working time, statutory conditions, or the service to which the job is attached. · The hierarchical and functional links, which position the employee in the company, define his level of responsibility and specify his hierarchical relations. · The job description lists the main and secondary activities of the job, its methods of exercise and the professional risks incurred. · The location of work tools… |
- Y. Karim, A. Cherkaoui, “Human and organizational factors maturity model development and implementation in construction industry using fuzzy comprehensive evaluation method”, in 2020 IEEE 6th International Conference on Optimization and Applications (ICOA), 1-6, IEEE, 2020, doi: 10.1109/ICOA49421.2020.9094481.
- P. Fraser, J. Moultrie, M. Gregory, “The use of maturity models/grids as a tool in assessing product development capability”, in IEEE International Engineering Management Conference, IEEE, 1, 244-249, August 2002, https://doi.org/10.1109/IEMC.2002.1038431.
- Parker, M. Lawrie, P. Hudson, “A framework for understanding the development of organisational safety culture”, Safety Science, 44, 551-562, 2006, https://doi.org/10.1016/j.ssc²i.2005.10.004
- M. Fleming, “Safety culture maturity model”, Offshore Technology Report-Health and Safety Executive OTH, 2001.
- M. Fleming, S. Meakin, “Cultural maturity model: health and safety improvement through involvement”, in SPE International Conference on Health, Safety, and Environment in Oil and Gas Exploration and Production, Society of Petroleum Engineers, 2004, https://doi.org/10.2118/86623-MS.
- P. T. W. Hudson, F. C. Willekes, “The hearts and minds project in an operating company: developing tools to measure cultural factors”, in SPE International Conference on Health, Safety and Environment in Oil and Gas Exploration and Production, Society of Petroleum Engineers, 2000, https://doi.org/10.2118/61228-MS.
- P. T. W. Hudson, “Implementing a safety culture in a major multi-national”, Safety science, 45(6), 697-722, 2007, https://doi.org/10.1016/j.ssci.2007.04.005.
- P. T. W. Hudson, D. Parker, R. Lawton, W.L.G. Verschuur, G.C.Van der Graaf, J. Kalff, “The hearts and minds project: creating intrinsic motivation for HSE”, in Proceeding of the SPE International Conference on Health, Safety, and the Environment in Oil and Gas Exploration and Production Stavanger, 2000, https://doi.org/10.2118/61095-MS.
- M. Lawrie, D. Parker, , P. T. W. Hudson, “Investigating employee perceptions of a framework of safety culture maturity”, Safety Science, 44(3), 259-276, 2006, https://doi.org/10.1016/j.ssci.2005.10.003.
- J. Edmonds, K. Gray, “Assessing Human Factors Maturity”, Chemical Engineering Transactions, 77, 481-486, 2019, https://doi.org/10.3303/CET1977081.
- L. A. Zadeh, “Fuzzy logic”, Computer, 21(4), 83-93, 1988, 10.1109/2.53.
- RSSB, “Understanding human factors, a guide for the railway industry”, 2008.
- T. L. Saaty, “How to make a decision: the analytic hierarchy process”, Interfaces, 24, 19-43, 1994, https://doi.org/10.1287/inte.24.6.19.
- C. H. Chou, G. S. Liang, H. C. Chang, “A fuzzy AHP approach based on the concept of possibility extent”, Quality & Quantity, 47(1), 1-14, 2013, https://doi.org/10.1007/s11135-011-9473-6.
- D. Y. Chang, “Applications of the extent analysis method on fuzzy AHP”, European journal of operational research, 95(3), 649-655, 1996.
- M. Dağdeviren, İ. Yüksel, “Developing a fuzzy analytic hierarchy process (AHP) model for behavior-based safety management”, Information sciences, 178(6), 1717-1733, https://doi.org/10.1016/j.ins.2007.10.016
- E. K. Zavadskas, Z. Turskis, Ž. Stević, A. Mardani, “Modelling procedure for the selection of steel pipes supplier by applying fuzzy AHP method”, Operational Research in Engineering Sciences: Theory and Applications, 3(2), 39-53, 2020.
- C. Kahraman, T. Ertay, G. Büyüközkan, G, “A fuzzy optimization model for QFD planning process using analytic network approach”, European journal of operational research, 171(2), 390-411, 2006.
- T. J. Zhang, J. H. Ren, S. H. Yu, W. Cui, “Entropy weight-fuzzy comprehensive evaluation method of the safety evaluation of water inrush”, Advanced Materials Research, 868, 300-305, 2014.https://doi.org/10.4028/www.scientific.net/AMR.868.300
- H. Huang, “The application of fuzzy comprehensive evaluation to risk assessment of coal floor water irruption”, in International Conference on Advances in Energy, Environment and Chemical Science, Atlantis Press, 2016, https://dx.doi.org/10.2991/aeecs-16.2016.4.
- H. Gu, , X. Fu, Y. Zhu, Y. Chen, L. Huang, “Analysis of social and environmental impact of earth-rock dam breaks based on a fuzzy comprehensive evaluation method. Sustainability”, 12(15), 6239, 2020, https://doi.org/10.3390/su12156239.
- X. Wu, F. Hu, “Analysis of ecological carrying capacity using a fuzzy comprehensive evaluation method”, Ecological Indicators, 113, 106243, 2020, https://doi.org/10.1016/j.ecolind.2020.106243.
- X. Lai, S. Wang, S. Ma, J. Xie, Y. Zheng, “Parameter sensitivity analysis and simplification of equivalent circuit model for the state of charge of lithium-ion batteries”, Electrochimica Acta, 330, 135239, 2020, https://doi.org/10.1016/j.electacta.2019.135239.