
Method of Technological Forecasting of Market Behaviour of R&D Products
Volume 6, Issue 1, Page No 886-897, 2021
Author’s Name: Vasyl Kozyk1, Oleksandra Mrykhina1, Lidiya Lisovska2,a), Anna Panchenko1, Mykhailo Honchar3
View Affiliations
1Department of Business Economics and Investment, Lviv Polytechnic National University, Lviv, 79013, Ukraine
2Management of Organizations Department, Lviv Polytechnic National University, Lviv, 79013, Ukraine
3Department of Management and International Business, Lviv Polytechnic National University, Lviv, 79013, Ukraine
a)Author to whom correspondence should be addressed. E-mail: lida_lissovcka@ukr.net
Adv. Sci. Technol. Eng. Syst. J. 6(1), 886-897 (2021); ![]() DOI: 10.25046/aj060198
DOI: 10.25046/aj060198
Keywords: R & D product, Commercialization, Technological forecasting, Market behaviour, Technological readiness, Strategy

Export Citations
The current concept of open innovation corresponds to the R&D products transfer model – “role changes”. One of the fundamental provisions of the model is that R&D products are considered for commercialization not only at the final stage of technological readiness, but at any of them. In today’s changing market environment, special attention is paid to the transfer and commercialization of R&D products at the early stages of readiness, but this process is characterized by significant problems from the point of view of technological forecasting. To solve the problems, the article substantiates the method of technological forecasting of market behaviour of R&D products at the early stages of technological readiness, which is based on taking into account the strengths and weaknesses, development factors and limiting factors of R&D product. The method allows you to predict indicators of product behaviour relative to the market where its commercialization is planned.
As a component of the above method and in order to increase the level of reliability of calculations and validity of results, a method for determining the correction factor of indicators of market behaviour of R&D product has been developed. The method was developed on the basis of fuzzy set theory algorithms using the fuzzy logic toolbox (MATLAB), which made it possible to integrate a set of different types of forecast data on the market behaviour of an R&D product, taking into account the relationships and interdependencies between them, into one correction factor. This coefficient contains the characteristics of signs of the impact of R&D product on the market (in particular, market effects, types of market changes) and the impact of market effects on R&D product (effects generated by R&D products, organizational and technological changes in R&D products). To justify the correction factor, a knowledge base of responses from subject area experts has been formed. In order to further select a commercialization strategy for R&D product, a system with normative indicators has been developed that interpret the following types of strategies: zero-level commercialization of R&D product; first-level commercialization of R&D product; commercialization of the second level of R&D product.
The author’s method of technological forecasting of market behaviour of R&D products and choosing a commercialization strategy for a product is universal, can be applied to R&D product of any type of economic activity, transfer method, etc. Testing of the method on the example of a number of R&D products presented by the developers of the Lviv Polytechnic National University (Lviv, Ukraine) showed the validity of the author’s method and its relevance in modern conditions of market singularity.
Received: 09 December 2020, Accepted: 24 January 2021, Published Online: 12 February 2021
1. Introduction
1.1. Framework of theme relevance
This work is a continuation of a number of our scientific papers in the framework of research on the transfer of R&D products, in particular, presented at the 14th International Scientific and Technical Conference on Computer Sciences and Information Technologies (2019) [1].
In recent years, there has been a change in a number of models of R&D products transfer, due to changes in the models of the innovation process, globalization and digitalization. The current concept of open innovation corresponds to the R&D products transfer model – “role changes”. One of the fundamental provisions of the model is that R&D products are considered for commercialization not only at the final stage of technological readiness, but at any of them. This position is important from several positions. First, depending on the stage of R&D product readiness for commercialization, both its original purpose and the level of consumer value may change (for example, when R&D products converge at the stage of idea justification).
Secondly, in the context of the spread of digitalization, the commercialization of R&D product is much faster, compared to the similar situation that was inherent in the global economy several decades ago.
In general, the level of technological readiness of an R&D product indicates its presence at a certain stage (research, development, etc.), which is compared with the planned (or final) stage, and, taking into account the features of R&D product development, predict the duration, cost and nature of market behaviour of the product. In other words, the market behaviour of a commercialized R&D product, which is evaluated at different stages of its technological readiness, will be different.
The above actualizes the need to pay attention to the study of approaches, methods and models of technological forecasting of market behaviour of R&D products. The success of implementing the R&D products commercialization strategy will depend on the reasonable choice of methodological tools for technological forecasting. The development of such methodological tools is relevant both from the point of view of the needs of the modern economy, and from the point of view of predicting the market behaviour of R&D products in the conditions of a market singularity.
1.2. Statistical Background
The relevance of the above problem is confirmed by numerous statistical data. In particular, among the problems that will befall R&D products in the form of startups, there is insufficient funding in the early stages of product development – 29 %, which is the second significant reason in the list of their failures (the first reason is the lack of market demand – 42 %) [2]. At the same time, startups are characterized by a growth trend. For example, for two dozen top universities in the United States, the number of startups has more than tripled in 20 years-from 306 units in 1998, up to 1098 units in 2018 [3], which explain the focus of universities to generate R&D products in the early stages with the help of startups. At the same time, 20 % of startups fail in the first year, 50% of startups fail in the first five years [4].
Traditionally, among small business owners, about 77 % of early-stage product financing is done by raising their own funds [4], which requires careful technological forecasting of the development and payback of R&D products. However, only 2 – 3 % of development funding belongs to alternative sources (Venture Investors, Business Angels, crowd funding, etc. [4]).
The importance of paying attention to technological forecasting of market behaviour of R&D products in the early stages of technological readiness is confirmed by the results of the NanoCom Consortium study [5], in which 214 people were interviewed about barriers to commercialization of R&D products in the field of nanotechnology. Among them, 63 people noted significant barriers at 3 – 5 levels of TRL (technology readiness level), where R&D is conducted. Other significant barriers included commercially available at TRL levels 8 – 9 (93 responses). The participants of this organization also argue that the most significant impact of barriers occurs in the early stages of TRL – domain technological, and in subsequent stages TRL gives way to marketing and strategic domain.
R&D is one of the defining components of the structure of a number of global country competitiveness indices (Bloomberg Innovation Index, Global Competitiveness Index, Creativity Index, etc.), so technological forecasting of market behaviour of R&D products can be a strong argument for explaining other components of such indices (market perception, productivity, added value, etc.).
1.3. Formulation of the problem
Without a sound approach to technological forecasting of market behaviour of R&D products, there is a high probability that they will not forget or partially acquire the utility function that turns the product into a market innovation.
To develop a method of technological forecasting of market behaviour of R&D product in modern economic conditions, and, based on this, to justify the commercialization strategy for it, it is necessary to conduct a comprehensive study of both the product and the market. We should learn trends and patterns of the market, the readiness of R&D product for commercialization, and so on.
In this paper, we consider R&D product from the point of view of customer-oriented marketing, that is, the focus is on the consumer value of the product. Product R&D marketing is directly related to the consumer’s consciousness. Therefore, in order to assess the level of technological readiness of an R&D product, it is necessary to keep in mind the readiness of the consumer (or market) to accept this technology. Starting from the first stage of evaluating the technological readiness of an R&D product it is necessary to formulate evaluation tasks in such a way that in the end we reach such technological, economic and other indicators that will best satisfy the business structures to which this technology will be transferred.
2. Theoretical Background
2.1. Approaches to substantiating R&D product development strategies
The development and commercialization of an R&D product requires considerable effort and resources from all participants in innovation activities. At the same time, one of the most important tasks is technological forecasting of changes that can occur with an R&D product and affect its commercialization and market distribution.
In modern scientific works on the problems of technological forecasting of R&D product development, various approaches, methods and models of research of R&D product and their market development are presented. In particular, to truly manifest innovation and reap its benefits, one must recognize that innovation is three different things: innovation is an outcome, innovation is a process, and innovation is a mindset [6].
A number of models of market development of R&D product have been developed. The new technological innovations are changing the ways businesses are being operated. The sharing economy – based new business models (SEBMs) using technology have many benefits, it is paramount to understand these SEBMs models and the behaviour of the market, particularly on how to influence the market’s attitude [7] this approach actualizes the importance of tasks to justify and choose a strategy for market development of R&D products.
The formation of a market development strategy should include forecasting factors and the dynamics of their impact on the market success of R&D products, sources of change and inertia that issue from the introduction of innovations in the market [8], business logic as consequence of far-reaching technological developments [9] using technological forecasting methods. Such factors should be systemic and complex, because focusing solely on the effectiveness of the technological innovation is detrimental to long-term operational benefits [10].
The above-mentioned problem is quite complex, since, as scientists note, chain reactions from one innovation can have effects so significant that the entire world alters its way of life to incorporate the new technology. Often times, the effects of a new type of technology build upon existing technology with future innovations building on the inventions of today. This constant evolution and growth forces businesses to adapt or expire [11].
In addition, scientists distinguish the interdependence between the introduction of different types of innovations, which determine the market prospects for each other’s development, as in the case of the introduction of technological and organizational innovations [12]. Sustainability, adoption of various types of innovation [13], accounting for the environment in the agenda of companies [14]. The success of innovations depends in part on the business models used to distribute them [15]. Also important is the impact of specific types of information on commercialization rates of technologies [16].
Scientific papers note that the innovation adoption is a process, rather than a dichotomic choice [17]. Therefore, for a rational and effective process of adapting R&D products to the market, it is necessary to develop and implement strategic solutions.
For the formation of innovation development strategies, many approaches justify strategic management decisions from different positions. Marketing strategies and particularly brand associations with brand awareness, perceived quality, and brand loyalty [18], co-branding strategies become important [19].
In addition, market opportunities for innovation are associated with the implementation of competitive strategies and market-based assets (customer orientation, competitor orientation, and marketing creativity) were assessed for their ability to help an innovating firm deal with dysfunctional competition and improve the returns from innovation [20].
In connection with the development of the open innovation model, the following factors are becoming important: intellectual property strategy, the shaping of complementary and substitute appropriability regimes is central when strategizing in dynamic and systemic innovation contexts [21].
2.2. Tools for justifying R&D product development strategies
The study of tools for the formation of strategies for the development of technological innovations has led to a revision of methods of technological forecasting, that can be useful for bringing a new perspective to explain and generalize properties of the evolution of technology and predict which innovations are likely to evolve rapidly in society [22]. The tasks of modern technological forecasting are strategic foresight, sustainability, technology transfer, entrepreneurship, and absorptive capacity can be explored further [23].
When justifying the R&D products development strategy, scientists highlight two generative cognitive processes- analogical reasoning and conceptual computation [24].
More and more scientists are using matrix approach to technological innovations based on design science research, entrepreneurship, and innovation theories, especially in digital innovation [25].
Combined methods of forming strategic decisions based on MULTIMOORA (Multi-Objective Optimization on the basis of Ratio Analysis plus full multiplicative form) is a somewhat new multi criteria decision-making (MCDM) method which provides high efficiency and effectiveness in problem solving [26].
In order to avoid the subjectivism of expert assessments, the authors suggest novel approach for forecasting method selection and a recommendation-based ensemble forecasting approach [27].
Determination of the weighting coefficients of factors influencing the development of technological innovations can be carried out based on exponential smoothing; autoregressive integrated moving average and neural network are chosen to form the combined approach [28].
2.3. Theoretical generalization
The considered approaches to development strategies allow us to approach the justification of strategic decisions on the market development of R&D products from the standpoint of priority of a specific factor. However, according to successful practices, the market perception of R&D products is interdisciplinary in nature. In addition, the scientific and practical developments discussed above are based on the consideration of mostly completed innovations as objects, that is, the results of the completed innovation process. However, the object of this research is the intermediate result of the innovation process, namely, R&D product at the early stages of technological readiness.
These objects have different parameters of technological readiness [29] and features of market application. Therefore, it is necessary to take a differentiated approach to the development of methods for technological forecasting of market development of R&D products, choosing a strategy for their commercialization, and so on.
The author’s method must be defined:
- the ability to differentiate in the projected period of market development of R&D products their functional advantages and weaknesses, factors that will restrain or stimulate the development of the product;
- the ability to take into account the features and characteristics of R&D product of various types of economic activity and business areas;
- with the ability to objectively predict market drivers and anti-drivers of R&D product development;
- it is an opportunity to take into account the dynamic nature of the market development of R&D product in relation to the satisfaction of consumer needs;
- flexibility in changing input data, managerial maneuverability, and so on.
-
Research design
3.1. Methodology approach
The aim of the work is to develop a method for technological forecasting of market behaviour of R&D products at the early stages of their technological readiness.
The basis for conducting such a study is a number of hypotheses.
Hypothesis 1. The method of technological forecasting of market behaviour of R&D products is universal and can be applied to products of any type of economic activity, business sector, etc.
Hypothesis 2. Fuzzy set theory algorithms allow us to take into account changes in the market behaviour of R&D products in the short, medium and long term.
Hypothesis 3. Justification of the R&D product market behaviour indicator based on the author’s method should correlate with the early stages of technological readiness of the product.
To prove / refute hypotheses and develop this method, it is advisable to conduct a study of the problems of technological forecasting of R&D products development at the empirical, theoretical and applied levels.
3.2. Methodology
3.2.1. Fundamentals of technological forecasting of market behaviour R&D product
When evaluating an R&D product for the purpose of market launch and developing strategies for its commercialization, analysts mainly use methods and models of technological forecasting of product market development.
Most of the known methodological tools for technological forecasting of market development of R&D products are based on the justification of its strengths and weaknesses, risks and chances, etc. [30–32]. However, the category “market development” is a general concept that implies a process that results in a change in the quality of a product, its transition from one qualitative state to another (higher). In the situation with technological forecasting of R&D product development, the category “market behaviour” will give a more accurate description of the above change. Within the framework of neobehaviourism, behaviour is considered visible manifestations that can be observed, internal states associated with external manifestations. Moreover, market behaviour is a set of states (characteristics) of an R&D product that a product reveals under the influence of certain environmental factors (market). However, the market behaviour of R&D products is not often taken into account by analysts in the context of technological forecasting. Therefore, traditional approaches to technological forecasting for R&D products do not always allow us to justify effective strategies for their commercialization.
If an R&D product is in the early stages of technological readiness, it is not always correct to assess the chances and risks of a product. Odds are the probability of such market behaviour of an R&D product that will contribute to its success in the market. Risks are a combination of the probability and consequences of adverse events based on the market behaviour of an R&D product. To determine the chances and risks, first of all, it is necessary to assess the future consumer value of an R&D product. However, when an R&D product is only in the process of development, significant errors may occur when determining the level of its consumer value. The assessment of chances and risks can be more reliable when evaluating R&D products at the stages of appropriability high technological readiness – then it is possible to predict the market behaviour of R&D product and its perception by the market environment with a significant degree of reliability. Therefore, in the case of evaluating an R&D product at the early stages of readiness, it is advisable to clarify the categories “chances” and “risks” in a meaningful way. It is proposed to replace them with “development factors” and “limiting factors“. These factors determine the probability of events occurring in the R&D product market (events that will determine the chances or risks of R&D product spreading in the market).
When making technological forecasting of the market behaviour of R&D product, it is advisable to pay attention, on the one hand, to the stage of technological readiness of R&D product on the other – to the perception of R&D product by the market environment.
To determine the early stages of technological readiness of R&D products, we will use the NASA approach [33]:
- basic principles observed and reported;
- technology concept and / or application formulated;
- analytical and experimental critical function and / or characteristic proof-of-concept;
- component and / or breadboard validation in laboratory environment;
- component and / or breadboard validation in relevant environment.
In the early stages of R&D product readiness, it is advisable to conceptually determine the level of compatibility of the current market data set with the corresponding set of knowledge about the technological readiness of R&D product.
The set of data (characteristics) obtained based on studying the technological readiness and market perception of R&D product can be systematized into stimulants and destimulants of R&D product, highlighting from them – strengths and weaknesses, development factors or limitations of R&D product. To organize the characteristics of an R&D product, you can use the following list.
Strengths / weaknesses of R&D product
- stage of technological readiness;
- functional indicators of the main and additional purpose of R&D product;
- indicators of the value of technical / analytical / marketing support from the developer;
- the level of environmental safety of the product;
- the level of economic efficiency of investment in R&D product (commercialization);
- the level of costs for the use and disposal of R&D product;
- R&D product patent protection level;
- the level of uniqueness / standardization of the R&D product;
- the level of complexity of implementing an R&D product;
- the time level of expected use of the R&D product before replacement or improvement;
- the level of novelty / improvement of the main functional characteristics of the R&D product;
- scale of implementation and use of R&D products, etc.
Development factors / limitations for R&D product
- the nature and number of direct / indirect competitors of the R&D product;
- nature and number of substitutes R&D product;
- market capacity;
- stage of the R&D product lifecycle;
- dependence on R&D product participants / developers;
- the level of access to resources for using the R&D product;
- the level of availability of R&D product information, etc.
These characteristics can be adjusted according to the scope of R&D product, market specifics, comparison with market analogues, and so on.
In order to substantiate the method of technological forecasting of market behaviour of R&D product, we have proposed the following sequence of actions:
- systematize the evaluation basis (reference matrix) of technological forecasting of market behaviour of R&D product;
- develop a methodological approach to correcting indicators of market behaviour of R&D product;
- substantiate the method of evaluating the results of technological forecasting of market behaviour of R&D product;
- develop a system for selecting strategies for commercializing an R&D product based on technological forecasting of its market behaviour.
Systematization of existing methodological approaches to technological forecasting and the application of development factors and limitations of R&D product allowed us to develop a reference matrix for technological forecasting of market behaviour of R&D product – table 1.
Table 1: Reference matrix for technological forecasting of market behaviour of R&D product
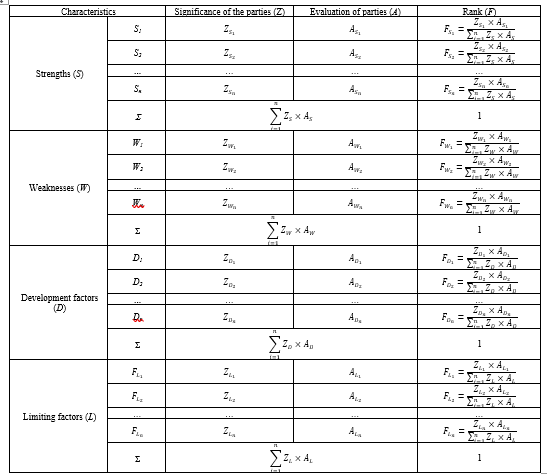 Table 2: Correlation matrix of strengths, weaknesses, development / limiting factors and indicators of R&D product market behaviour
 In order to assess the strengths and weaknesses, development factors and limitations of an R&D product, it is necessary to involve experts in the relevant subject area and skill level. Experts determine the significance of the parties to the R&D product (Z) and evaluate them (A) according to the expressions in table. 1.
Significance is a non – repeating indicator for each of the characteristics (according to the principle: highest value-highest significance). A rating can be assigned, for example, from the interval 1…10, where 1 is the weakest manifestation of the characteristic, and 10 is the strongest. After that, the rank of ratings is determining. It is the specific weight of the impact of each characteristic on their entire group.
When making calculations, the priority should be the value of the R&D product for the consumer, its market competitiveness, as well as the expected efficiency of commercialization.
After establishing the ranks, we determine the pairwise correlation coefficients (C) of factors influencing the R&D product and calculate the indicator of its market behaviour (P). The matrix of relationships between indicators is shown in table 2.
Therefore, K [x; y], where x and y are in the range 0…1, is the correlation coefficient of strengths and weaknesses, development factors, and limitations of the R&D product. The sum of “x + y” placed in the corresponding cells will reflect the strength of the influence of a particular pair of factors: SD, SL, WD and WL, respectively, on the indicator of market behaviour.
The market behaviour indicator shows the strength of the manifestation of R&D product characteristics, due to the corresponding development factors or restrictions on it. This indicator is relative and is measured in fractions of units. Calculating the market behaviours indicator helps determine the level of R&D ability of a product in relation to market development.
To determine the indicator of market behaviours of an R&D product, it is advisable to follow the following systematic procedure:
- summarize the correlation coefficients (K) separately for the strengths, weaknesses, development factors, and limitations of the R&D product. Use expressions to determine the indicator of market behaviour of an R&D product to set its value. For this purpose, expressions (1) – (2):
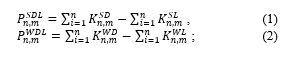 interpret the obtained values of market behaviour indicators. In particular, shows how much the strengths of an R&D product supported by development factors can withstand limiting factors, reflects how much the weaknesses of an R&D product supported by developmental factors can overcome limiting factors. The “–” and “+” signs of the indicators indicate the dominance of the influence of factors of restriction or development, respectively. In general, the level of the indicator indicates the strength of influence of the characteristics used in the assessment.
In practice, when evaluating an R&D product, such important indicators of technological forecasting as trends and features of market development that will affect the market behaviour of an R&D product often fall out of sight. In particular: technology diffusion, convergence of products and markets, synergy of R&D products, multiplier and spillover effect of R&D product, etc. Such indicators are practically not taken into account by modern appraisers, which is due to the complexity of their determination. It is even more difficult to identify interdisciplinary factors influencing R&D products and their relationships. However, you cannot ignore them either. Market effects can determine the market behaviour of an R&D product and the choice of its commercialization strategy.
To take into account these aspects, it is advisable to introduce a correction factor for indicators of market behaviour of R&D product. In our opinion, the correction factor should consist of two interrelated components: I (the impact of R&D product on the market) and II (the impact of market effects on R&D product). In order to justify such a correction factor, it is advisable to apply an economic and mathematical apparatus that would be based on not only quantitative estimates, but also take into account qualitative assessments of the market behaviour of R&D product. To do this, you can apply the algorithms of fuzzy set theory.
The criterion for the effectiveness of correcting indicators of market behaviour of an R&D product based on fuzzy set theory algorithms can be expressed by maximizing the degree of suitability of the result in each specific case of technological forecasting.
The correction factor (M) of R&D product market behaviour indicators can be described by the function (3):
![]() which is a next-level system of functions (see table 3).
which is a next-level system of functions (see table 3).
Table 3: Signs of adjustment of indicators of market behaviour of R&D products and their linguistic terms
| Signs of adjustment of R&D products market behaviour indicators | Characteristics of signs of adjustment of indicators of market behaviour of R&D product | Meaning of linguistic terms of signs of adjustment of market behaviour indicators R&D product |
| I – Market impact of R&D product | a) market effects: market convergence, spillover effect, Diffusion, synergy, crowd effect, etc. | Low [- 100; – 80; – 60], L; Admissible [- 59; – 29.5; 0], A; Middle [0; 29.5; 59], M; High [60; 80; 100], H |
| b) types of market changes: the level of market renewal; the number and types of market participants affected by R&D product; the level and depth of market changes that accompany the introduction of R&D product; barriers to market entry, etc. | Low [- 100; – 80; – 60], L; Admissible [- 59; – 29.5; 0], A; Middle [0; 29.5; 59], M; High [60; 80; 100], H | |
| II – Impact of market effects on R&D product | a) effects generated by R&D products: convergence of R&D products; multiplier effect, etc. | Low [- 100; – 80; – 60], L; Admissible [- 59; – 29.5; 0], A; Middle [0; 29.5; 59], M; High [60; 80; 100], H |
| b) organizational and technological changes of R&D products: flexibility (adaptation) of individual parameters of R&D product; the level of novelty of R&D product; the number and access to marginal resources that need to be attracted for the market development of R&D product and the level of costs for them; environmental friendliness of R&D product; scale of R&D product monetization; level of intellectual property protection, etc. | Low [- 100; – 80; – 60], L; Admissible [- 59; – 29.5; 0], A; Middle [0; 29.5; 59], M; High [60; 80; 100], H |
To output the desired correction factor, use the Fuzzy Logic Toolbox (MATLAB). Within the framework of fuzzy set theory algorithms (based on the Mamdani model), the characteristics of signs of correction of market behaviour of R&D product are systematized by types (a, b, c, d), which are assigned the value of linguistic terms – table 3.
The correction factor of market behaviour is within the same limits as the characteristics of its features.
We have formed a knowledge base – a set of ratios of linguistic terms of adjustment features, taking into account their impact on the indicator of market behaviour of R&D product. In figure 1 shows a fragment of this knowledge base using the fuzzy logic toolbox (MATLAB).
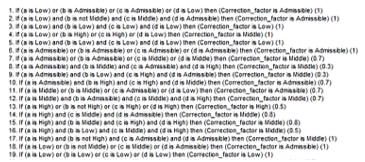 Figure 1: Knowledge base of relations of linguistic terms of adjustment features, considering their impact on the indicator of market behaviour of R&D product (fragment)
Visualization of the ratio of signs of adjustment of indicators of market behaviour of R&D product is shown in figure 2 – 3.
Implementing the described sequence, we obtain a relative correction factor, by the value of which we specify the indicators of market behaviour R&D product and .
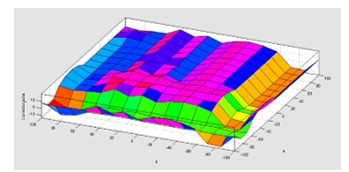 Figure 2: Visualization of the ratio of a and b signs of adjustment of R&D product market behaviour indicators
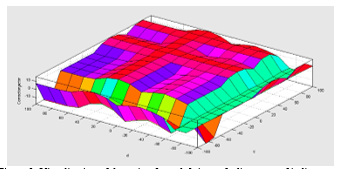 Figure 3: Visualization of the ratio of c and d signs of adjustment of indicators of market behaviour of R&D product
3.2.2. Evaluating results
There are many approaches to choosing an R&D product commercialization strategy, but none of the current ones takes into account technological forecasting of R&D product market behaviour. Taking into account the best practices of scientists [34 – 39], we have formed a system for choosing the strategy of commercialization of R&D product, based on three methods of commercialization:
- zero-level commercialization of R&D product;
- commercialization of the first level of R&D product;
- commercialization of the second level of R&D product.
If an R&D product is at the first or second stages of technological readiness (basic principles observed and reported; technology concept and / or application formulated), it is obvious that a zero-level commercialization strategy will be suitable for it. This strategy is the most efficient way to make a profit, since its object is the idea of an R&D product.
The object of the first – level commercialization strategy is an R&D product that is at the third or fourth stages of technological readiness: analytical and experimental critical function and / or characteristic proof-of-concept; component and / or breadboard validation in the laboratory environment.
The second – level commercialization strategy is possible for an R&D product at the fifth stage of technological readiness-component and / or breadboard validation in a relevant environment.
Calculated and adjusted values of market behaviour indicators (clause 3.2.1) should be noted in the system developed for this purpose (figure 4).
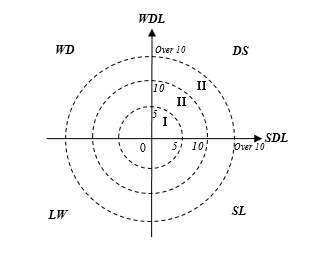 Figure 4: A system for selecting an R&D product commercialization strategy based on technological forecasting of market behaviour indicators*
* Symbols: I-zero-level commercialization strategy, II-first-level commercialization strategy; III-second-level commercialization strategy
The system is based on a Cartesian coordinate system (on the abscissa – SDL axis, on the ordinate – WDL axis), described by three circles – the boundaries of the choice of a particular strategy for commercialization of an R&D product, according to technological forecasting of its market behaviour.
The explanation of the choice of this form of representation of the system is justified by us in [38]. All circles have a centre at the zero point. The radius of the smallest circle is 5 units, average – 10 units. For the largest circle of Radius, it is established that its radius must be more than 10 units.
According to Figure 4, the division of scenarios within certain commercialization strategies is as follows: DS sector – measures that are necessary to use the strengths of R&D product for its development; WD sector – measures that need to be carried out, overcoming the shortcomings of R&D product and using development factors in relation to it; LW sector – measures that minimize the shortcomings and take into account the limiting factors of R&D product; SL sector – measures that use the strengths of R&D product and take into account the limiting factors in relation to it.
3.3. Data analysis
The author’s method has been tested on a number of developments of Ukrainian business entities. Here is an example of technological forecasting of market behaviour of R&D product – OSL dosimetry of ionizing radiation (IR) based on Yap:Mn crystals. The main purpose of R&D product is individual passive (cumulative) IR dosimetry of people working with IR sources or may be exposed to radiation from such sources. The technology was developed by scientists of the Department of semiconductor electronics of the Lviv Polytechnic National University (Ukraine) [40, 41]. The R&D product includes a dosimeter with several detectors in a cassette; detectors (based on single crystals of yttrium-aluminum oxide activated with manganese); a device for determining the radiation dose absorbed by the cassette with detectors (reader); a method for performing measurements that provides determination of dosimetric values with a given degree of accuracy and reliability.
Research of the global market of OSL dosimetry of IR in the field of security and defense and the study of this R&D product allowed us to form strengths and weaknesses, development factors and limitations in relation to it (table 4).
Table 4: Evaluation of the characteristics of OSL dosimetry of IR technology for technological forecasting of their market behaviour
| Characteristics | Z | A | F | ||
| S | Increased level of product functionality for rescuers | 8 | 10 | 80 | 0.229 |
| Tissue equivalence of the dosimetric detector material and localization of dose measurements | 6 | 9 | 54 | 0.154 | |
| Ability to record the dose of different types of IR in a wide range of values | 7 | 9 | 63 | 0.180 | |
| Ability to identify the IR source type | 3 | 8 | 24 | 0.068 | |
| Dosimetric material with extremely high sensitivity | 4 | 7 | 28 | 0.080 | |
| The material of the dosimetric detector allows you to measure the absorbed dose of IR in a wide range (from units of micrograms to several tens of kg), is a more stable and stable material, compared to analogues | 5 | 7 | 35 | 0.100 | |
| Ability to perform a rapid assessment of radiation energy and determine the type of unknown source | 2 | 6 | 12 | 0.034 | |
| The ability to quickly determine the radiation dose (important for portable readers, allows you to save the dosimeter with the accumulated dose after its partial reading, makes it possible to re-read multiple times) | 9 | 5 | 45 | 0.128 | |
| Synthesizer of OSL dosimetry of IR technology. Package patenting | 1 | 8 | 8 | 0.022 | |
| S | 349 | 1 | |||
| W | Inflation, currency instability in the global IR dosimetry market | 1 | 9 | 9 | 0.073 |
| Capital and knowledge intensity of product production | 3 | 6 | 18 | 0.146 | |
| Difficulty in finding a qualified workforce to start product production | 5 | 10 | 50 | 0.406 | |
| Significant need for investment to start production | 4 | 8 | 32 | 0.260 | |
| Undeveloped sales channels in the country of origin (Ukraine) [42] | 2 | 7 | 14 | 0.113 | |
| S | 123 | 1 | |||
| D | The North American region is promising from the point of view of the market launch (it is characterized by the largest global market share of manufacturers of IR dosimetry equipment and technology of 93.32 %, but the region’s market is not saturated with these products) [38] | 9 | 9 | 81 | 0.231 |
| Significant opportunities for product differentiation by Application Area | 6 | 10 | 60 | 0.171 | |
| In the country of producer (Ukraine), competitive products are presented in fragments; they are significantly more expensive than the analyzed product. The market of individual IR dosimetry in Ukraine is unsaturated today: up to 23,000 units. / year, or about $1.1 million (15.33 %) [43] | 1 | 5 | 5 | 0.014 | |
| Zoom effect | 3 | 4 | 12 | 0.034 | |
| The global dosimeters market will grow at a CAGR of 6.8% with a base value of $2.92 billion in 2020 to $4.36 billion in 2026 during the forecast period of 2020 – 2026 [44] | 4 | 7 | 28 | 0.080 | |
| There is a tendency to increase demand for IR dosimetry products and technology in the medical field (the radiotherapy market is projected to grow from an estimated $5.6 billion in 2018 to $6.8 billion by 2023, at a CAGR of 4.1% during the forecast period) [45] | 8 | 8 | 64 | 0.182 | |
| The market of manufacturers and consumers of IP dosimetry equipment is characterized by an increase in demand for OSL dosimetry of IR and a tendency to replace TLD dosimetry with OSL dosimetry, due to the expanded list of opportunities that OSL dosimetry provides | 5 | 5 | 25 | 0.071 | |
| The OSL dosimetry of IR market is 25% of the world market | 2 | 6 | 12 | 0.034 | |
| The OSL dosimetry of IR market is characterized by the expansion of the personal dosimetry segment, due to the improvement of the “performance / cost” ratio and wider application opportunities | 7 | 9 | 63 | 0.180 | |
| S | 350 | 1 | |||
| L | Low demand elasticity | 1 | 4 | 4 | 0.024 |
| Insufficient communication between consumers and the manufacturer | 3 | 5 | 15 | 0.093 | |
| High level of specialization of competitive analogues presented in the markets | 2 | 7 | 14 | 0.086 | |
| Dependence on strategic relationships | 4 | 7 | 28 | 0.173 | |
| Product complexity, production | 5 | 8 | 40 | 0.248 | |
| The OSL dosimetry of IR market is monopolistic (the main market operator is LANDAUER, Inc. (USA)), which is due to the scale of production of this enterprise and legal barriers to other market participants (patent protection of technology, etc.) | 6 | 10 | 60 | 0.372 | |
| S | 161 | 1 | |||
Table 5: Indicators of market behaviour of OSL dosimetry of IR technology
| D | L |
P S1–S2 |
|||||||||||||||||
| 0.231 | 0.171 | 0.014 | 0.034 | 0.080 | 0.182 | 0.071 | 0.034 | 0.180 | S1 | 0.024 | 0.093 | 0.086 | 0.173 | 0.248 | 0.372 | S2 | |||
| S | 0.229 | 0.46 | 0.4 | 0.243 | 0.263 | 0.309 | 0.411 | 0.3 | 0.263 | 0.409 | 3.058 | 0.253 | 0.322 | 0.315 | 0.402 | 0.477 | 0.601 | 2.37 | 0.688 |
| 0.154 | 0.385 | 0.325 | 0.168 | 0.188 | 0.234 | 0.336 | 0.225 | 0.188 | 0.334 | 2.383 | 0.178 | 0.247 | 0.24 | 0.327 | 0.402 | 0.526 | 1.920 | 0.463 | |
| 0.180 | 0.411 | 0.351 | 0.194 | 0.214 | 0.260 | 0.362 | 0.251 | 0.214 | 0.36 | 2.617 | 0.204 | 0.273 | 0.266 | 0.353 | 0.428 | 0.552 | 2.076 | 0.541 | |
| 0.068 | 0.299 | 0.239 | 0.082 | 0.102 | 0.118 | 0.250 | 0.139 | 0.102 | 0.248 | 1.579 | 0.092 | 0.161 | 0.154 | 0.241 | 0.316 | 0.440 | 1.404 | 0.175 | |
| 0.080 | 0.311 | 0.251 | 0.094 | 0.114 | 0.130 | 0.262 | 0.151 | 0.114 | 0.260 | 1.687 | 0.104 | 0.173 | 0.166 | 0.253 | 0.328 | 0.452 | 1.470 | 0.211 | |
| 0.100 | 0.331 | 0.271 | 0.114 | 0.134 | 0.150 | 0.282 | 0.171 | 0.134 | 0.280 | 1.867 | 0.124 | 0.193 | 0.186 | 0.273 | 0.348 | 0.472 | 1.596 | 0.271 | |
| 0.034 | 0.265 | 0.205 | 0.048 | 0.068 | 0.084 | 0.216 | 0.105 | 0.068 | 0.214 | 1.273 | 0.058 | 0.127 | 0.120 | 0.207 | 0.282 | 0.406 | 1.200 | 0.073 | |
| 0.128 | 0.359 | 0.299 | 0.142 | 0.162 | 0.178 | 0.31 | 0.199 | 0.162 | 0.308 | 2.119 | 0.158 | 0.221 | 0.214 | 0.301 | 0.376 | 0.500 | 1.320 | 0.799 | |
| 0.022 | 0.253 | 0.193 | 0.036 | 0.056 | 0.072 | 0.204 | 0.093 | 0.056 | 0.202 | 1.165 | 0.046 | 0.115 | 0.108 | 0.195 | 0.270 | 0.394 | 1.128 | 0.037 | |
| S | 3.258 | ||||||||||||||||||
| W | 0.073 | 0.304 | 0.244 | 0.087 | 0.107 | 0.153 | 0.255 | 0.144 | 0.107 | 0.253 | 1.654 | 0.097 | 0.166 | 0.159 | 0.246 | 0.321 | 0.445 | 1.434 | 0.220 |
| 0.146 | 0.377 | 0.317 | 0.160 | 0.179 | 0.226 | 0.326 | 0.217 | 0.180 | 0.326 | 2.308 | 0.170 | 0.239 | 0.232 | 0.319 | 0.394 | 0.518 | 1.872 | 0.436 | |
| 0.406 | 0.637 | 0.577 | 0.520 | 0.440 | 0.486 | 0.588 | 0.477 | 0.440 | 0.586 | 4.751 | 0.430 | 0.499 | 0.492 | 0.479 | 0.654 | 0.778 | 3.332 | 1.419 | |
| 0.260 | 0.491 | 0.431 | 0.274 | 0.294 | 0.340 | 0.442 | 0.331 | 0.294 | 0.440 | 3.337 | 0.284 | 0.353 | 0.346 | 0.433 | 0.508 | 0.632 | 2.556 | 0.781 | |
| 0.113 | 0.144 | 0.284 | 0.127 | 0.147 | 0.193 | 0.295 | 0.184 | 0.147 | 0.293 | 1.814 | 0.137 | 0.206 | 0.199 | 0.286 | 0.361 | 0.485 | 1.674 | 0.166 | |
| S | 3.022 | ||||||||||||||||||
The results obtained are used to determine pairwise correlation coefficients of factors influencing the R&D product, based on which indicators of its market behaviour (table 5) are calculated.
Using the author’s method for determining the corrective coefficient of market behaviour of an R&D product, with the involvement of a group of expert appraisers from the subject area and based on the fuzzy logic toolbox (MATLAB), the desired coefficient is determined for the OSL dosimetry of IR technology (figure 5).
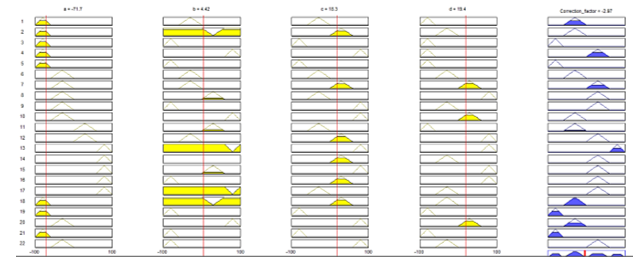 Figure 5: Results of determining the correction factor of indicators of market behaviour of OSL dosimetry of IR technology
The correction factor M for OSL dosimetry of IR technology will be – 2.97 %. The coordinates of the market behaviour indicator of this product, taking into account the correction factor, will be:
WDL: 3.258 * (- 2.97 %) = – 3.161;
SDL: 3.022 * (- 2.97 %) = – 2.93.
So, an indicator of the market behaviour of OSL dosimetry of IR technology in the R&D product commercialization strategy selection system (see figure 4) will have the coordinates – K [- 3.161; – 2.93], that is, it falls into the second matrix circle. In this case, a zero-level commercialization strategy is proposed for the product.
Since the product is located in the LW sector, as part of the chosen commercialization strategy for it, it is advisable to consider in detail for which positions of the correction factor the market development of the product may slow down. Based on this, appropriate corrective measures can be developed.
The result obtained correlates with the stage of technological readiness of OSL dosimetry of IR technology – technology concept and / or application formulated (second stage).
Testing of a reasonable method of technological forecasting of market behaviour of R&D product and the choice of commercialization strategy based on this, carried out on the example of a number of R&D products presented by the development teams of the Lviv Polytechnic National University (Lviv, Ukraine), showed the following results (table. 6).
So, in the case of technological forecasting of market behaviour for the 1st and 4th R&D products, a zero-level commercialization strategy is defined, for the 2nd, 6th and 7th – a first-level commercialization strategy, for the 3rd, 5th – a second-level commercialization strategy.
Table 6: Results of technological forecasting of market behaviour of OSL dosimetry of IR technology using the author’s method
| № | R&D products | Technological readiness stage of R&D product [1…5]* | Value of the correction factor, % | Coordinates (K) in the strategy system | Type of commercialization strategy |
| 1 | Technology of optically-stimulated luminescent dosimetry | 2 | – 2.97 | [- 3.161; – 2.93] | Zero-level commercialization strategy |
| 2 | Continuation of the life of machine parts by the method of surfacing under a layer of flux | 3 | 4,48 | [5.45; 6.89] | First-level commercialization strategy |
| 3 | Autonomous smoke and leak detection system carbon monoscope | 5 | 7.14 | [10.38; 14.91] | Second-level commercialization strategy |
| 4 | Forecasting and providing a given value of the initial resistance of dissimilar and homogeneous materials of small thicknesses and cross sections during point capacitor contact micro welding | 2 | – 1.6 | [- 2.85; – 4.03] | Zero-level commercialization strategy |
| 5 |
Contact point capacitor micro welding equipment |
5 | 6.31 | [10.03; 11.82] | Second-level commercialization strategy |
| 6 | Technology of surface friction strengthening of working surfaces of machine parts | 4 | 3.56 | [7.21; 8.025] | First-level commercialization strategy |
| 7 | Technology of surface friction displacement of working surfaces of machine parts | 4 | – 1.56 | [- 5.01; – 5.87] | First-level commercialization strategy |
* Stages are defined according to the NASA approach [33].
Based on the R&D products that were taken to test the method, it can be applied to products of any type of economic activity, transfer method, etc. However, the use of the author’s method is characterized by reservations:
1) in a situation where the chosen strategy has a marginal value (it is on the edge of the circles that determine the choice of strategies for commercialization of R&D product), decisions should be made based on the current market situation, the overall strategy of the business entity and the objective vision of the analyst;
2) to obtain reliable results when applying the correction factor of market behaviour based on the fuzzy logic toolbox (MATLAB), it is advisable to review and, if necessary, correct the set of data involved in the assessment in each evaluation situation.
- Conclusions
The method of technological forecasting of market behaviour of R&D products at the early stages of their technological readiness is substantiated. The method is based on taking into account the strengths and weaknesses, development factors and limiting factors of the product R&D, which allows you to predict indicators of market behaviour of the product relative to the market where its commercialization is planned.
The market is characterized by an array of different types of factors that in one way or another influence the market behaviour of R&D products. Therefore, within the framework of the method of technological forecasting of market behaviour of R&D products and in order to increase the level of reliability of calculations and validity of results, a method for determining the correction factor of indicators of market behaviour of R&D product has been developed. The method is developed on the basis of fuzzy set theory algorithms using the fuzzy logic toolbox (MATLAB). This made it possible to integrate a set of data on the market behaviour of an R&D product, taking into account their relationships and interdependencies, into one correction factor. This coefficient contains the characteristics of signs of the impact of R&D product on the market (in particular, market effects, types of market changes) and the impact of market effects on R&D product (effects generated by R&D products, organizational and technological changes in R&D products). To justify the correction factor, a knowledge base was formed based on the answers of experts who have knowledge of trends, patterns and features of market development in the subject area.
To select the R&D product commercialization strategy, a system with normative indicators that interpret the types of strategies has been developed. In particular, this allowed us to offer the following types of strategies: commercialization of the zero level of R&D product; commercialization of the first level of R&D product; commercialization of the second level of R&D product.
Due to the clarification of content categories (development factors and limitations) and the introduction of a correction factor for market behaviour indicators, the results of choosing an R&D product commercialization strategy are more accurate and reliable.
The hypothesis 1 put forward in this paper is justified. The method of justifying the indicator of market behaviour of R&D products for the purpose of technological forecasting is universal, can be applied to products of any type of economic activity, transfer method, etc.
The method of justifying the indicator of market behaviour of R&D products for the purpose of technological forecasting can only give errors if S, W, D, and L are poorly defined, compared, and weighed. Therefore, experts are recommended to pay thorough attention to studying the features of the product and market in each evaluation situation.
Hypothesis 2 is not fully justified. The proposed correction factor for indicators of market behaviour of R&D products based on fuzzy set theory algorithms makes it possible to take into account changes in the market behaviour of products only in the short term. The characteristics of the features that this coefficient is based on can only be relevant at the time of technological forecasting. To apply such methods in the medium and long term, it is necessary to take into account the volatility and singularity of the market.
Hypothesis 3 is true. Justification of the indicator of market behaviour of R&D product based on the principles of the author’s method correlates with the early stages of technological readiness of the product, since: 1) the economic content of the stages of technological readiness of R&D products was laid in the author’s method of technological forecasting of market behaviour of R&D products; 2) the characteristics of the signs of the correction factor of market behaviour indicators are based on phenomena, market effects, etc., which are characteristic of R&D product at a specific stage of technological readiness.
The economic interpretation of the obtained indicators of market behaviour of R&D products and the commercialization strategies selected based on this showed the validity of the author’s method and its relevance in the changing conditions of the modern market. The study of the characteristics of the features of the correction factor of market behaviour indicators is the subject of the following scientific work.
Conflict of Interest
The authors declare no conflict of interest.
Acknowledgment
We thank the developers of R&D products and scientists of Lviv Polytechnic National University (Ukraine), who shared the pearls of their knowledge and experience, which made it possible to conduct research and justify the results.
- N. Chukhray, N. Shakhovska, O. Mrykhina, M. Bublyk, L. Lisovska, “Consumer Aspects In Assessing The Suitability of Technologies for the Transfer”, in 2019 IEEE 14th International Scientific and Technical Conference on Computer Sciences and Information Technologies, 142-147, 2019, https://doi:10.1109/STC-CSIT.2019.8929879
- N. McCarthy, “The Top Reasons Startups Fail”, 2017
- D. Nag, A. Gupta, A. Turo, “The Evolution of University Technology Transfer: By the Numbers”, 2020
- T. Tetreault, “10 Surprising Startup Statistics”, 2019
- NanoCom Consortium, Best Practices to Lower the Barriers for Commercialisation of Nanotechnology Research. NanoCom Lowering Barriers for Nanotechnology Commercialisation. Barriers and Success Factors; Commercialisation Readiness Scale
- ”, Business Horizons, 61(3), 453-460, 2018, https://doi.org/10.1016/j.bushor.2018.01.011
- S. S. Dadwal, A. Jamal, T. Harris, G. Brown, S. Raudhah, “Technology and Sharing Economy-Based Business Models for Marketing to Connected Consumers”, in Handbook of Research on Innovations in Technology and Marketing for the Connected Consumer, IGI Global, 62-93, 2020.
- S. Sarasini, M. Linder, “Integrating A Business Model Perspective into Transition Theory: The Example of New Mobility Services”, Environmental Innovation and Societal Transitions, 27, 16-31, 2018, https://doi.org/10.1016/j.eist.2017.09.004
- K. E. Bosbach, J. F. Tesch, U. C. M. Kirschner, “A Business Model Perspective on Innovation Susceptibility”, in: Tesch J. (eds) Business Model Innovation in the Era of the Internet of Things. Progress in IS. Springer, Cham, 2019, https://doi.org/10.1007/978-3-319-98723-1_6
- R. Santa, M. Ferrer, L. M. Jørsfeldt, A. Scavarda, “The Impact of the Quality of the Service From IS/IT Departments on the Improvement of Operational Performance: the Point of View of Users of Technological Innovations”, International Journal of Business Information Systems, 28(2), 125-146, 2018, https://doi.org/10.1504/IJBIS.2018.10012923
- S. T. McKnight, B. Maniam, J. Robertson, “Effects of Technology Innovations on Business”, Journal of Business and Behavioral Sciences, 31(1), 84-101, 2019.
- G. Azar, F. Ciabuschi, “Organizational Innovation, Technological Innovation, and Export Performance: the Effects of Innovation Radicalness and Extensiveness”, International Business Review, 26(2), 324-336, 2017, https://doi.org/10.1016/j.ibusrev.2016.09.002
- T. Rantala, J. Ukko, M. Saunila, J. Havukainen, “The Effect of Sustainability in the Adoption of Technological, Service, and Business Model Innovations”, Journal of Cleaner Production, 172, 46-55, 2018, https://doi.org/10.1016/j.jclepro.2017.10.009
- E. Martínez-Ros, “Revisiting Product and Process Innovations”, International Journal of Business Environment, 10(3), 270-280, 2019, https://doi.org/10.1504/IJBE.2019.097983
- T. B. Long, V. Blok, K. Poldner, “Business Models for Maximising the Diffusion of Technological Innovations for Climate-smart Agriculture”, International Food and Agribusiness Management Review, 20(1030-2017-2134), 5-23, 2016, https://doi.org/10.22434/IFAMR2016.0081
- J. T. Eckhardt, M. P. Ciuchta, M. Carpenter, “Open Innovation, Information, and Entrepreneurship Within Platform Ecosystems”, Strategic Entrepreneurship Journal, 12(3), 369-391, 2018, https://doi.org/10.1002/sej.1298
- F. Damanpour, F. Sanchez-Henriquez, H. H. Chiu, “Internal and External Sources and the Adoption of Innovations in Organizations”, British Journal of Management, 29(4), 712-730, 2018, https://doi.org/10.1111/1467-8551.12296
- D. S. de Oliveira, M. Caetano, “Market Strategy Development and Innovation to Strengthen Consumer-based Equity: The case of Brazilian airlines”, Journal of Air Transport Management, 75, 103-110, 2019. https://doi.org/10.1016/j.jairtraman.2018.12.006
- M. Grębosz-Krawczyk, J. Pointet, “Co-branding Strategy as a Source of Innovation on International Market”, Journal of Intercultural Management, 9(3), 63-77, 2017, https://doi.org/10.1515/joim-2017-0014
- W. Liu, K. Atuahene-Gima, “Enhancing Product Innovation Performance in a Dysfunctional Competitive Environment: the Roles of Competitive Strategies and Market-based Assets”, Industrial Marketing Management, 73, 7-20, 2018, https://doi.org/10.1016/j.indmarman.2018.01.006
- M. Holgersson, O. Granstrand, M. Bogers, “The Evolution of Intellectual Property Strategy in Innovation Ecosystems: Uncovering Complementary and Substitute Appropriability Regimes”, Long Range Planning, 51(2), 303-319, 2018, https://doi.org/10.1016/j.lrp.2017.08.007
- M. Coccia, “The Theory of Technological Parasitism for the Measurement of the Evolution of Technology and Technological Forecasting”, Technological Forecasting and Social Change, 141, 289-304, 2019, https://doi.org/10.1016/j.techfore.2018.12.012
- S. Singh, S. Dhir, V. M. Das, A. Sharma, “Bibliometric Overview of the Technological Forecasting and Social Change journal: Analysis from 1970 to 2018”, Technological Forecasting and Social Change, 154, 119963, 2020, https://doi.org/10.1016/j.techfore.2020.119963
- R. Amit, C. Zott, Business Model Innovation Strategy: Transformational Concepts and Tools for Entrepreneurial Leaders, John Wiley & Sons, 2020.
- A. Hevner, S. Gregor, “Envisioning Entrepreneurship and Digital Innovation Through a Design Science Research Lens: A Matrix Approach”, Information & Management, 103350, 2020, https://doi.org/10.1016/j.im.2020.103350
- J. H. Dahooie, E. K. Zavadskas, H. R. Firoozfar, A. S. Vanaki, N. Mohammadi, W. K. M. Brauers, “An Improved Fuzzy MULTIMOORA Approach for Multi-criteria Decision Making Based on Objective Weighting Method (CCSD) and its Application to Technological Forecasting Method Selection”, Engineering Applications of Artificial Intelligence, 79, 114-128, 2019, https://doi.org/10.1016/j.engappai.2018.12.008
- M. Züfle, A. Bauer, V. Lesch, C. Krupitzer, N. Herbst, S. Kounev, V. Curtef, “Autonomic Forecasting Method Selection: Examination and Ways Ahead”, in 2019 IEEE International Conference on Autonomic Computing (ICAC), 167-176, 2019, https://doi.org/10.1109/ICAC.2019.00028
- L. Zhou, “Prediction of a Service Demand Using Combined Forecasting Approach”, Journal of Physics: Conference Series, 887(1), 012075), 2017, https://doi.org/10.1088/1742-6596/887/1/012075
- N. I. Chukhrai, L. S. Lisovska, “Formation of Innovation’s Consumer Utility”, Actual Problems of Economics, 149(11), 27–34, 2013.
- R. Puyt, F. B. Lie, F. J. De Graaf, C. P. M. Wilderom, Origins of SWOT Analysis. Academy of Management Proceedings (Ed: Atinc G.), 2020 [online] Available at: https://doi.org/10.5465/AMBPP.2020.132
- NASA, “Technology Readiness Levels (TRLs)”, 2020
- H. Pylypenko, V. Prokhorova, O. Mrykhina, O. Koleshchuk, S. Mushnykova, “Cost Evaluation Models of R&D Products of Industrial Enterprises”, Naukovyi Visnyk Natsionalnoho Hirnychoho Universytetu, 5, 163–170, 2020, https://doi.org/10.33271/nvngu/2020-5/163
- V. Dimitrova, “Commercialization of the Academic Scientific Product in Bulgaria, Economic Science, Education and the Real Economy: Development and Interactions in the Digital Age”, Publishing House Science and Economics Varna, 1, 343–356, 2020
- S. K. Daneshjoovash, P. Jafari, A. Khamseh, “Effective Commercialization of High-technology Entrepreneurial Ideas: a Meta-synthetic Exploration of the Literature”, Journal of Small Business & Entrepreneurship. 2020
- W. Sutopo, R. W. Astuti, R. T. Suryandari, “Accelerating a Technology Commercialization; with a Discussion on the Relation Between Technology Transfer Efficiency and Open Innovation”, Journal of Open Innovation: Technology, Market, and Complexity, 5, 95, 2019, https://doi.org/10.3390/joitmc5040095
- O. Mrykhina, Technology Transfer from Universities to the Business Environment: Paradigm, Concept and Tools of Evaluation, Lviv Polytechnic Publishing House, 440, 2018.
- L. Halkiv, O. Karyy, I. Kulyniak, S. Ohinok, “Modeling and Forecasting Of Innovative, Scientific and Technical Activity Indicators under Unstable Economic Situation in the Country: Case Of Ukraine”, Communications in Computer and Information Science, 1158, 79-97, 2020. https://doi:10.1007/978-3-030-61656-4_5
- S. Ubizskii, D. Afanassyev, Y. Zhydachevskii, A. Luchechko, V. Rabyk, “Technique and Apparatus for Pulsed OSL Readout of YAP:Mn Dosimetric Detectors with Enhanced Dynamic Range,” in 2019 International Conference on Information and Telecommunication Technologies and Radio Electronics (UkrMiCo), Odessa, Ukraine, 1–6, 2019, https://doi.org/10.1109/UkrMiCo47782.2019.9165365
- D. Afanassyev, S. Ubizskii, Ya. Zhydachevskyy, A. Luchechko, A. I. Popov, A. Suchocki, “Time-resolved Pulsed OSL of Ceramic YAP:Mn phosphors”, Integrated Ferroelectrics, 196:1, 24–31, 2019, https://doi.org/10.1080/10584587.2019.1591980
- L. Halkiv, O. Karyy, I. Kulyniak, S. Ohinok, “Innovative, Scientific and Technical Activities in Ukraine: Modern Trends and Forecasts” in 2020 IEEE 3rd International Conference on Data Stream Mining and Processing, 9204148, 321-324, DSMP 2020. https://doi:10.1109/DSMP47368.2020.9204148
- Ministry of Defense of Ukraine, 2020
- Global Dosimeter Market Forecast to 2026 by Technology, End User, Device and Geography. Dublin, Aug. 25, 2020 (GLOBE NEWSWIRE), 2020
- Radiotherapy Market by Type (External (IGRT, IMRT, 3D-CRT, Stereotactic), Brachytherapy (LDR, HDR)), Product (LINAC, CyberKnife, Gamma Knife, Tomotherapy, Particle Therapy, Cyclotron), Application (Prostate, Breast), End User (Hospital) – Forecasts to 2023, 2020