
Multi-Layered Machine Learning Model For Mining Learners Academic Performance
Volume 6, Issue 1, Page No 850-861, 2021
Author’s Name: Ossama Embaraka)
View Affiliations
Computer Information Science, Higher Colleges of Technology, Abu Dhabi, 51133 UAE
a)Author to whom correspondence should be addressed. E-mail: oembarak@hct.ac.ae
Adv. Sci. Technol. Eng. Syst. J. 6(1), 850-861 (2021); ![]() DOI: 10.25046/aj060194
DOI: 10.25046/aj060194
Keywords: Mining students academic performance, Machine learning, Academic Layered Factors Model, At-risk Students, Recommendation systems for education, Personalized Learning

Export Citations
Different colleges and universities have different approaches to dealing with low-performance learners. However, in most cases, analgesics do not deal with root problems. This research suggests a model of three layers of variables sequentially adaptable to a deep-root issue. The suggested model can identify early pupils who could be at risk because of inaccurate or lack of match sequences and suggest rehabilitation. The approach proposed was implemented at three levels. First, we examined the personality type for 180 learners from different majors: Security and Forensics, Networking, and Application Development, using the MBTI test. Second, we build a knowledge matrix for courses by dividing each learning outcome into its knowledge segments. Then, we build the skills matrix for courses by decomposing each learning outcome into its skills segments. We then use machine learning (SVM, DT and association rules) algorithms to mine student performance on a smaller scale of knowledge and skills, taking into account their personality types instead of measuring an entire course’s holistic performance. Finally, we developed a system of recommendations to detect performance deviations in knowledge and skills and provide adaptive learning materials that fit the examined students’ personality. The proposed approach demonstrates its validity and effectiveness. However, it needs regular updates on learners’ performance, which could be automated and linked to evaluation tools. The framework also has a minor impact on learners’ privacy since it exposes individual personalities to their advisors.
Received: 19 December 2020, Accepted: 24 January 2021, Published Online: 05 February 2021
1. Introduction
This paper is an extension of work initially presented in 2018 Fifth HCT Information Technology Trends (ITT), IEEE [1]. On average, students have different talents, distinct attitudes, and different levels of enthusiasm in their educational programs. Although various students may share a major, it is, however, important to analyze students in many aspects, including the knowledge and skills they have learned. The students have a wide range of learning styles that reflect how they can analyze, plan, and respond to the learning environment [2]. Some students may be comfortable thinking of hypotheses and abstract ideas, while others feel better being a little more concrete with data. Some of the student body prefers active learning, interaction by taking notes and seeing the material presented [3]. It shows how different the students are to each other even within the same major. There are three learners of the course. One learner who has begun to learn by auditory means, another who has begun with tactile activities and finally another learner who is visually dominated [4]. The challenge of the day is to equip our students with the information and skills they will need to accomplish their goals into their future professional careers, regardless of their personal preference. There are many majors in computing that require different knowledge and essential skills than those required for their future careers. To memorize everything here is not exactly effective; i.e., memorization is inefficient. An inability to memorize is a type of learning disorder. Students with such a condition do not expend much effort in studying or preparing for exams. There are two different behaviours that those students might do. Some students might adopt a more in-depth approach when understanding the meaning, whereas the others might make a more strategic approach to understand such type of knowledge, get the best knowledge of their peers and gain related skills [5,6]. As it should be, learners often have their own personal values that affect their own personal ability to absorb new knowledge and learn new functional skills [7].
Knowing students’ personality patterns is extremely valuable in finding out their skills; the Myers-Briggs Type Indicator (MBTI) is very much in use. as a means to do just that. Neural dynamics testing techniques, as used in MBTI, helps with understanding the form of human personality. The four main personality traits are eye contact, emotional perception of facial expressions, sensitivity to language, and sensitivity to others’ physical appearance [8].
The first pattern is the orientation of energy: Extroversion (E) is preferable to those who prefer to be energized for situations, people and things (that is, for the external world) compared with their complement, preferring to direct their energy towards information, beliefs, ideas and explications (that is, the internal world) (I).
The second pattern is the information and things an individual wants to deal with; Those who prefer to deal with facts and describe clearly situations are sensitive (S). They prefer to deal with ideas, expectations and unknown factors that are not obvious, rather than their additions dependent on intuition. (N).
The third pattern is the sort of decision-making, People would rather make decisions based on objective logic and analysis- Thinking (T) than those who prefer to make decisions based on the values they believe important — feelings Feelings (F).
Fourth, how people make their planning, Those who prefer well-designed and planned lifestyles judge (J) against those who like flexibility, flow and react to things, i.e. perception (P) [9].
- Extraversion(E) vs Introversion (I)
- Sensing (S) vs Intuition(N)
- Thinking(T) vs Feeling(F)
- Judging vs Perceiving(P)
A person may be more inclined to be extroverted than an introvert. Likewise, a person could be more sensing than intuitive, more thoughtful than feeling and judging than perceived. The table below decipher examples of detected personalities.
Table 1: Sample types of personality
| Personality Type | ISTJ | ISFJ | ESFP | INTP | ENTJ |
| Extraversion(E) | ˟ | ˟ | √ | ˟ | √ |
| Introversion (I) | √ | √ | ˟ | √ | ˟ |
| Sensing (S) | √ | √ | √ | ˟ | ˟ |
| Intuition(N) | ˟ | ˟ | ˟ | √ | √ |
| Thinking(T) | √ | ˟ | ˟ | √ | √ |
| Feeling(F) | ˟ | √ | √ | ˟ | ˟ |
| Judging(J) | √ | √ | ˟ | ˟ | √ |
| Perceiving(P) | ˟ | ˟ | √ | √ | ˟ |
Each personality fits more than the others to a particular career; for example, the ISTJ personality type could fit more into the Systems administrator.
I: Propensity to think about things in the mind
S: Prefer ideas with practical applications
T: Take decisions on an impersonal basis, using a logical reasoning
J: Prefer detailed step-by-step instructions
Combining these four couples generates 16 alternative personality types that enable scientists to understand individuals and advance in a specific area through measurement (s). Students with a preference for introversion, probably doing a lot of thorough work or considering a problem, can find it difficult to live in a noisy or interactive environment [10]. Consequently, they can tend to pick less active and interrupted concentrations. The measurement of computer skills in vital terms and concepts, which are understandable and learning for students during their studies. We have to measure skills such as troubleshooting, network setup, audit protection framework, etc. In addition, it is possible to develop applications, systems, networks, etc.
Maintaining a system to ensure students’ personality types is extremely important for understanding their emotions, thinking, and behaviour. For example, understand if a student prefers to work alone or prefers to work with others. Prefers an extremely organized and fixed career, or someone who would like a flexible, open schedule, which allows him or her to be spontaneous. This information helps to determine which career(s) are appropriate for the preferences of students. There are no special advantages or disadvantages over these patterns as they complement each other. If a student has been detected as an Extroversion with a specific percentage, it is an Introversion of the supplement percentage; therefore, each pair is valid for each person but with different strength. The networking employee is expected to be self-driven to deal with network issues and not wait for outside directions. Extraverts tend to be more active when learning, while introverts tend to be more reflective when learning.
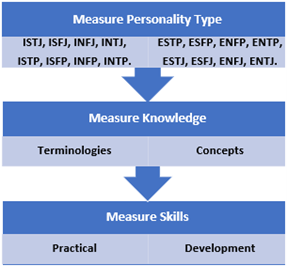
Figure 1: Learner comprehension layers
2. Literature Review
We cannot think of a single method of teaching suitable for all pupils of the same major. Most academic institutions follow the same method, which relies on the delivery of lectures, where students have to absorb the material and then repeat it in the review. This approach does not solve the gaps in student skills, expertise and competencies. Different learning styles define students they prefer to interpret knowledge in different ways [11]. Several models were developed to classify the way people learn; Jung’s psychological theory, also known as the Myers-Briggs Type Indicator, is the most famous model (MBTI) [12]. This test provides ample information about a person’s personality and the consequences of his or her education. The engineering department of the University of Western Ontario has demonstrated that in the first year of engineering courses men introverts, intuition, thinkers and judges are more likely to excel than extraverts, felt, sensed, and interpreted people at the lower end of their range [13]. They used an MBTI test and performance test on 119 students to determine whether that particular group of seniors would perform very well later in a class like that. The type of personality that is more likely to drop out of the curriculum is recommended to be one that is not overly concerned with grades.
Sensors personality ratings were significantly lower than Intuitors in courses with few high abstractions, an especially important practical question posed by the tests. Introverts may be well-suited for team activities, but extraverts will enjoy working together. Persons who score highly in the Intuitive cluster score higher on creativity and problem-solving skills than those with a Sensing personality [14]. For example, in understanding academic success, another model created in recent years is the Felder and Silverman [15]. Its purpose is to answer four questions, which are as follows.
On the student’s preferred topic, what information do they preferentially perceive? For the student who has a sensory personality, they prefer to be focusing on interacting with what they see, hearing the sounds, and using their physical sensations as a way of experiencing. Those who think more specifically are more comfortable with their abstracts (theories, math, memories, thoughts, and are more likely to solve the problems faster and innovative. What kind of information are our senses perceived most effectively? That is visual personality (exhibited in the eyes) or verbal personality (expressed through speech). What process is the student used to incorporate this information into their outside learning? Actively through participation in physical activity, or through meditation. How does the student characteristically get from “not understanding” to “understanding?” The classroom needs to be set up with logical steps in place, with students thinking linearly and being able to only work with a partial understanding (logic step), or where students think globally and applying their knowledge until they fully understand the picture and have a holistic perspective (global system step) [16]. The Kolb Model assumes that every class possibly includes students of every category. This leads to the belief that these learners are often more likely to become better learners, leading them to perform better [17].
The key issue is how to find an appropriate method of learning for new students when the knowledge is lacking. There are numerous approaches that solutions tend to be used in solving a new state: a cold start problem, [18] Develop the algorithm that finds the closed likeminded learner, and so it generates its recommendations accordingly. [19] Researchers found that students with characteristics that esteem the parental world among students in technology majors were more likely to be of an ESFJ, ISFJ, ESFP, INTJ, and ISTP. On the other hand, students majoring in management information systems tend to be more ESTJ and ISTJ. In an article by [20]ISTJ, INTJ, and ISFJ are the most common personality types found in the computing industry. A study that was done by [21] shows that the relationship between the students’ personality and their academic performance depends on the correspondence between the students’ personality and the chosen major. Researchers have found, first of all, that system analysts are more extroverted than other thought-provoked people, that computer designers are more introverted and less extroverted than other thought-provoked people, and that programmers are more introverted and less extroverted than other thought-provoked people.
3. The Proposed Approach
The details of the proposed approach are to be applied in four phases. In the first phase, we build the courses’ knowledge and skills matrix by decomposing the course’s learning outcomes into its knowledge and skills segments. This will help apply machine learning algorithms to mine learners’ performance on a smaller scale of concept segments rather than on the entire course’s performance or an entire block of concepts. In the second phase, we collected the personalities of students using the MBTI test. In the third level, we assess learners’ success (Knowledge & Skills) considering their personality and concentration. Finally, apply a recommendation framework to enhance the performance of learners using machine learning.
3.1. Construct a matrix of knowledge and skills
Analyze courses in terms of skill and knowledge. The starting point was to decompose the courses into their relevant knowledge and skills, representing all the concepts used in each CLO course and laid out in the PLO curriculum, as seen in the following analysis for CIS1403, fundamental to the programming course.
Table 2: Fundamental of programming knowledge & Skills
| CLO Number | Description | knowledge | Skills |
| CLO1 | Apply basic programming concepts to write simple programs that use data types, variables, constants, expressions, and statements, focusing on these constructs in Java. |
Just remember data types. Recognize the appropriate parameters and values. Please, understand expressions. |
Apply the data types. Read through the used data types Create a fully working application in which all variables are properly typed.
|
| CLO2 | Write programs that take control flow decisions by means of conditional statements and iterative decisions. |
Understand how expressions work. Learn to understand Iteration statements.
|
Make use of iterations to accomplish control flow. Use conditionals to control the flow of a program.
|
| CLO3 | Write programs using unidimensional arrays for initialization, access, transversal, and searching for different data types. | Understand one-dimensional array |
Write programs using single-dimensional arrays Write programs that access, update, and search one-dimensional arrays. |
| CLO4 | Develop programs using built-in and user-defined functions with parameter lists. | Understand different user-defined functions {void and return} |
Analyze user-defined functions Write functions with parameters |
| CLO5 | Organize and document the program’s source code in line with industry standards and best practices. |
Recognize coding standers Recognize coding best practices |
Apply coding best practices Analyze a programming problem Write a fully working program with function calls |
The method retains four key components: intelligence, abilities, attitude and soft skills of the learner. The developed machine learning model used by these components to assess learners of the greatest importance, learners’ key causes of At-risk, and we strive to calculate their employability ratio in the light of these core components.
3.2. Evaluation of student personalities
Understanding the personality type will help clarify the preferences, and how or why students may be different. Personality types are useful for understanding how a person can learn, manage, monitor, communicate, collaborate, compromise and cope with stress. Understanding the behaviours of learners helps prepare students to improve their knowledge and skills. This helps to apply a self-awareness tool to recognize strengths, consider and manage growth needs, and establish a career and personal development strategies.
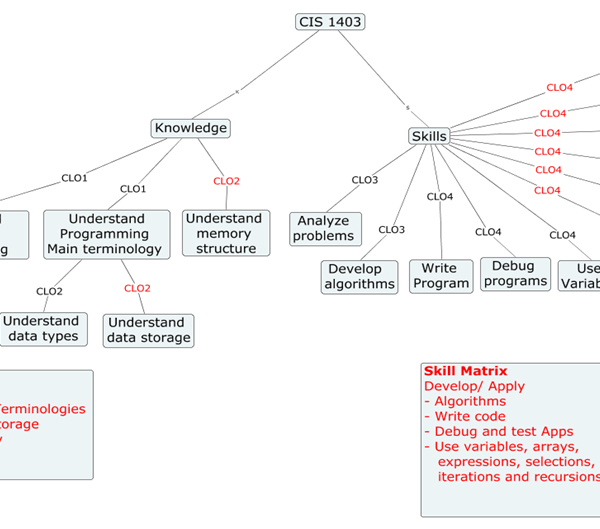
Figure 2: Course knowledge and skills decomposition
We collected data about students’ personality using https://www.16personalities.com/, where students’ future profession can be categorized into MBTI Sixteen Personality Types shown below [22].
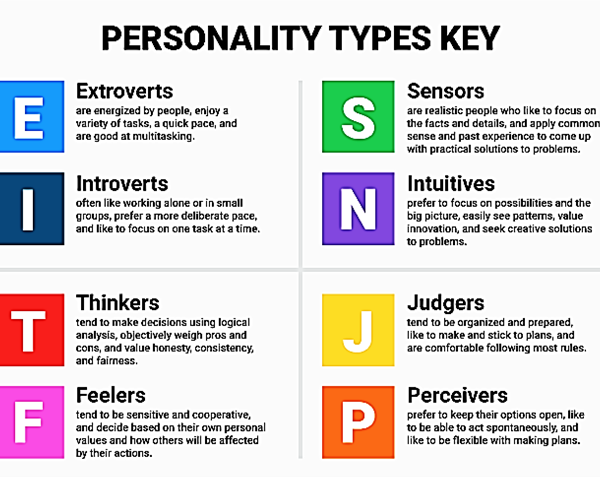
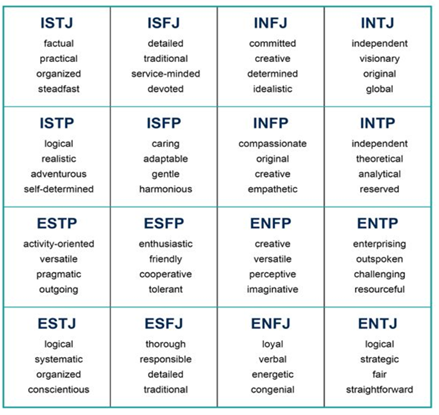
Figure 3: Personality types main features
4.3.Build a recommendation system
Build a recommendation framework that considers learners’ personalities from on the one hand and the knowledge and skills they have from the other, as shown in the figure below.
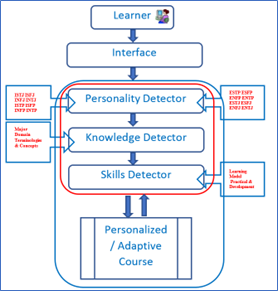
Figure 4: Three-layered course personalization model.
4. Research Procedures
For this research, 180 students were asked twice to use different platforms to take the Myers-Briggs Style Test. Eliminating all irregularities, only correct and clean data for treatment has been processed. Data collection incorporates the Type of Personality and the Personality Code; Extraversion (E), Introversion (I), Sensing (S), and Intuition (N) (P).
Variables
Three factors influence the development of students and thus their academic status in this research. First, we will consider the personality type created through a four-letter combination, each of which represents a set of independent characteristics. : extroverted versus introduced, sensing versus intuitive, thought versus feeling and judging versus prospecting. The second factor is the students’ knowledge based on each class: the third factor is the students’ skills that meet their concentration needs. We can determine if a student is in good academic standing by considering their first-year grades, time in school, etc.
4.1. Create Learners profiles
We have developed student profiles that incorporate their personality style and academic knowledge and skills. The figure below shows the types of students, which is used to analyze whether the student’s personality affects their achievements in the three majors of computer networking.
Table 3: Learners measured personality
| Catalog |
Academic Standing |
Cgpa | Major | Emsat English Overall Score | Emsat Math | High School Average | Personality Type | Extraverted | Introverted | Intuitive | Observant | Thinking | Feeling | Judging | Prospecting | Assertive | Turbulent |
| 201810 | Very Good | 3.12 | CSF | 1175 | 1225 | 86.24 | ESTP-T | 56 | 44 | 45 | 55 | 60 | 40 | 44 | 56 | 39 | 61 |
| 201620 | Near At-Risk | 2.29 | CSF | 1175 | 0 | 84.8 | INFJ-T | 12 | 88 | 55 | 45 | 43 | 57 | 61 | 39 | 42 | 58 |
| 201910 | Near At-Risk | 2.08 | COM | 1300 | 300 | 87.7 | ISFJ-A | 39 | 61 | 47 | 53 | 43 | 57 | 57 | 43 | 51 | 49 |
| 201910 | Distinctive | 3.81 | COM | 1050 | 850 | 88.57 | INFJ-T | 15 | 85 | 64 | 36 | 19 | 81 | 60 | 40 | 26 | 74 |
| 201920 | Good Standing | 2.6 | COM | 1075 | 725 | 89.59 | ENFP-T | 54 | 46 | 52 | 48 | 44 | 56 | 49 | 51 | 47 | 53 |
| 201810 | At-Risk | 1.8 | CIN | 1025 | 425 | 87.2 | ENTJ-T | 61 | 39 | 52 | 48 | 58 | 42 | 56 | 44 | 44 | 56 |
| 201520 | Near At-Risk | 2.34 | FJM | 0 | 0 | 81.5 | ISFP-T | 47 | 53 | 41 | 59 | 44 | 56 | 46 | 54 | 37 | 63 |
| 201820 | Very Good | 3.13 | COM | 1125 | 550 | 82.31 | ESTJ-A | 83 | 17 | 42 | 58 | 51 | 49 | 67 | 33 | 69 | 31 |
| 201810 | Distinctive | 3.67 | CSF | 1025 | 850 | 93.96 | INFJ-T | 43 | 57 | 53 | 47 | 43 | 57 | 56 | 44 | 46 | 54 |
| 201810 | At-Risk | 1.82 | CIA | 1150 | 375 | 87.6 | INTJ-T | 37 | 63 | 51 | 49 | 64 | 36 | 67 | 33 | 49 | 51 |
| 201810 | Good Standing | 2.66 | CIN | 1125 | 450 | 88.3 | INFJ-T | 39 | 61 | 74 | 26 | 56 | 44 | 56 | 44 | 42 | 58 |
| 201910 | Good Standing | 2.71 | COM | 1100 | 0 | 91.3 | ESTP-T | 56 | 44 | 45 | 55 | 28 | 72 | 71 | 29 | 56 | 44 |
| 201910 | Near At-Risk | 2.44 | COM | 0 | 0 | 78.6 | ISFJ-T | 32 | 68 | 30 | 70 | 49 | 51 | 69 | 31 | 42 | 58 |
| 201810 | Good Standing | 2.65 | CSF | 1150 | 300 | 87.3 | ISFP-A | 39 | 61 | 37 | 63 | 47 | 53 | 49 | 51 | 56 | 44 |
| 201810 | Good Standing | 2.79 | CSF | 1250 | 1050 | 88.85 | INTP-T | 39 | 61 | 55 | 45 | 56 | 44 | 42 | 58 | 49 | 51 |
| 201720 | Near At-Risk | 2.45 | CIN | 700 | 300 | 90.5 | INTP-T | 49 | 51 | 53 | 47 | 53 | 47 | 49 | 51 | 46 | 54 |
| 201820 | At-Risk | 1.84 | COM | 1100 | 325 | 76.92 | ESFP-A | 29 | 71 | 46 | 54 | 53 | 47 | 64 | 36 | 43 | 57 |
| 201810 | At-Risk | 1.78 | FJW | 1100 | 300 | 89.5 | ESFJ-T | 56 | 44 | 45 | 55 | 43 | 57 | 53 | 47 | 44 | 56 |
| 201910 | Very Good | 3.11 | COM | 1075 | 850 | 89.78 | INFP-T | 54 | 46 | 32 | 68 | 18 | 82 | 60 | 40 | 36 | 64 |
| 201810 | Good Standing | 2.76 | CIA | 1100 | 300 | 93.6 | ISFJ-T | 57 | 43 | 49 | 51 | 44 | 56 | 63 | 37 | 43 | 57 |
The following two tables show a sample of students’ knowledge and skills performance in the programming course.
Table 4: Learners knowledge performance
| Catalog | Academic Standing |
Cgpa | Major | Remember Data Types | Understand Variables, Constants | Understand Expressions | Understand Selection Statements | Understand Iteration Statements | Understand One Dimensional Array | Understand Different User Defined Functions {Void And Return} | Knowledge Perforamnce |
| 201810 | Very Good | 3.12 | CSF | 0.9 | 1.8 | 1.8 | 2 | 2 | 1.91 | 1.91 | 1.76 |
| 201620 | Near At-Risk | 2.29 | CSF | 0.925 | 1.85 | 1.85 | 1.775 | 1.775 | 1.89 | 1.89 | 1.71 |
| 201910 | Near At-Risk | 2.08 | COM | 0.9125 | 1.825 | 1.825 | 1.85 | 1.85 | 1.74 | 1.74 | 1.68 |
| 201910 | Distinctive | 3.81 | COM | 0.92 | 1.84 | 1.84 | 1.755 | 1.755 | 1.8 | 1.8 | 1.67 |
| 201920 | Good Standing | 2.6 | COM | 0.925 | 1.85 | 1.85 | 1.72 | 1.72 | 1.53 | 1.53 | 1.59 |
| 201810 | At-Risk | 1.8 | CIN | 0.725 | 1.45 | 1.45 | 1.6 | 1.6 | 1.9 | 1.9 | 1.52 |
| 201520 | Near At-Risk | 2.34 | FJM | 0.975 | 1.95 | 1.95 | 1.075 | 1.075 | 1.734 | 1.734 | 1.50 |
| 201820 | Very Good | 3.13 | COM | 0.87 | 1.74 | 1.74 | 1.24 | 1.24 | 1.83 | 1.83 | 1.50 |
| 201810 | Distinctive | 3.67 | CSF | 0.7275 | 1.455 | 1.455 | 1.46 | 1.46 | 1.89 | 1.89 | 1.48 |
| 201810 | At-Risk | 1.82 | CIA | 0.7275 | 1.455 | 1.455 | 1.46 | 1.46 | 1.89 | 1.89 | 1.48 |
| 201810 | Good Standing | 2.66 | CIN | 0.9375 | 1.875 | 1.875 | 1.12 | 1.12 | 1.7 | 1.7 | 1.48 |
| 201910 | Good Standing | 2.71 | COM | 0.8225 | 1.645 | 1.645 | 1.185 | 1.185 | 1.89 | 1.89 | 1.47 |
| 201910 | Near At-Risk | 2.44 | COM | 0.8225 | 1.645 | 1.645 | 1.185 | 1.185 | 1.89 | 1.89 | 1.47 |
| 201810 | Good Standing | 2.65 | CSF | 0.7875 | 1.575 | 1.575 | 1.72 | 1.72 | 1.442 | 1.442 | 1.47 |
| 201810 | Good Standing | 2.79 | CSF | 0.8625 | 1.725 | 1.725 | 1.32 | 1.32 | 1.63 | 1.63 | 1.46 |
| 201720 | Near At-Risk | 2.45 | CIN | 0.8 | 1.6 | 1.6 | 1.28 | 1.28 | 1.8 | 1.8 | 1.45 |
| 201820 | At-Risk | 1.84 | COM | 0.7625 | 1.525 | 1.525 | 1.52 | 1.52 | 1.46 | 1.46 | 1.40 |
| 201810 | At-Risk | 1.78 | FJW | 0.6 | 1.2 | 1.2 | 1.68 | 1.68 | 1.7 | 1.7 | 1.39 |
| 201910 | Very Good | 3.11 | COM | 0.7 | 1.4 | 1.4 | 1.44 | 1.44 | 1.6838 | 1.6838 | 1.39 |
| 201810 | Good Standing | 2.76 | CIA | 0.75 | 1.5 | 1.5 | 1.56 | 1.56 | 1.43 | 1.43 | 1.39 |
| 201820 | Near At-Risk | 2.16 | COM | 0.8 | 1.6 | 1.6 | 1.005 | 1.005 | 1.81 | 1.81 | 1.38 |
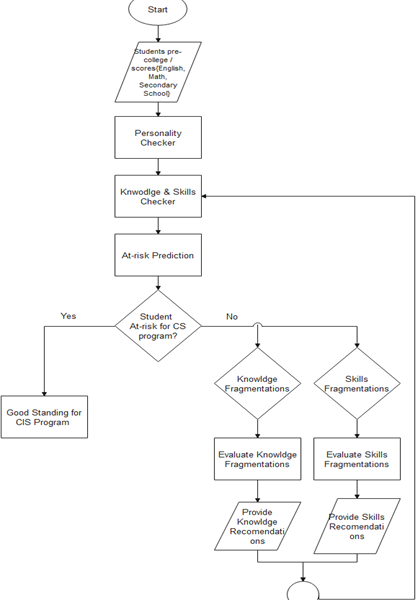
Figure 5: Flow chart for detecting the best program
Table 5: Learners skills performance
| Catalog | Academic Standing |
Cgpa | Major | Apply Coding Best Practices | Analyse User Defined Functions | Analyse A Programming Problem | Apply Data Types | Evaluate The Used Data Types | Create A Fully Working Application Using Proper Variables Data Types | Apply Control Flow Via Conditional Statements | Apply Control Flow Via Iterations | Write A Program Using Selection And Iteration Statements | Write Programs That Employ One-Dimensional Arrays Initialization | Write Programs That Employ One-Dimensional Arrays Accessing, Traversing, And Searching. | Write Functions With Parameters | Write A Fully Working Program With Function Calling | Skills Perforamnce |
| 201810 | Very Good | 3.12 | CSF | 2.01 | 3.82 | 3.82 | 2.865 | 4.775 | 2.865 | 3 | 3 | 5.73 | 6 | 5.73 | 4.02 | 4.02 | 3.97 |
| 201620 | Near At-Risk | 2.29 | CSF | 2.67 | 3.78 | 3.78 | 2.835 | 4.725 | 2.835 | 2.663 | 2.663 | 5.67 | 5.325 | 5.67 | 5.34 | 5.34 | 4.10 |
| 201910 | Near At-Risk | 2.08 | COM | 2.664 | 3.48 | 3.48 | 2.61 | 4.35 | 2.61 | 2.775 | 2.775 | 5.22 | 5.55 | 5.22 | 5.328 | 5.328 | 3.95 |
| 201910 | Distinctive | 3.81 | COM | 2.673 | 3.6 | 3.6 | 2.7 | 4.5 | 2.7 | 2.633 | 2.633 | 5.4 | 5.265 | 5.4 | 5.346 | 5.346 | 3.98 |
| 201920 | Good Standing | 2.6 | COM | 2.175 | 3.06 | 3.06 | 2.295 | 3.825 | 2.295 | 2.58 | 2.58 | 4.59 | 5.16 | 4.59 | 4.35 | 4.35 | 3.45 |
| 201810 | At-Risk | 1.8 | CIN | 2.588 | 3.8 | 3.8 | 2.85 | 4.75 | 2.85 | 2.4 | 2.4 | 5.7 | 4.8 | 5.7 | 5.175 | 5.175 | 4.00 |
| 201520 | Near At-Risk | 2.34 | FJM | 0.981 | 3.468 | 3.468 | 2.601 | 4.335 | 2.601 | 1.613 | 1.613 | 5.202 | 3.225 | 5.202 | 1.962 | 1.962 | 2.94 |
| 201820 | Very Good | 3.13 | COM | 2.481 | 3.66 | 3.66 | 2.745 | 4.575 | 2.745 | 1.86 | 1.86 | 5.49 | 3.72 | 5.49 | 4.962 | 4.962 | 3.71 |
| 201810 | Distinctive | 3.67 | CSF | 1.806 | 3.78 | 3.78 | 2.835 | 4.725 | 2.835 | 2.19 | 2.19 | 5.67 | 4.38 | 5.67 | 3.612 | 3.612 | 3.62 |
| 201810 | At-Risk | 1.82 | CIA | 1.806 | 3.78 | 3.78 | 2.835 | 4.725 | 2.835 | 2.19 | 2.19 | 5.67 | 4.38 | 5.67 | 3.612 | 3.612 | 3.62 |
| 201810 | Good Standing | 2.66 | CIN | 2.265 | 3.4 | 3.4 | 2.55 | 4.25 | 2.55 | 1.68 | 1.68 | 5.1 | 3.36 | 5.1 | 4.53 | 4.53 | 3.42 |
| 201910 | Good Standing | 2.71 | COM | 2.358 | 3.78 | 3.78 | 2.835 | 4.725 | 2.835 | 1.778 | 1.778 | 5.67 | 3.555 | 5.67 | 4.716 | 4.716 | 3.71 |
| 201910 | Near At-Risk | 2.44 | COM | 2.358 | 3.78 | 3.78 | 2.835 | 4.725 | 2.835 | 1.778 | 1.778 | 5.67 | 3.555 | 5.67 | 4.716 | 4.716 | 3.71 |
| 201810 | Good Standing | 2.65 | CSF | 1.8 | 2.884 | 2.884 | 2.163 | 3.605 | 2.163 | 2.58 | 2.58 | 4.326 | 5.16 | 4.326 | 3.6 | 3.6 | 3.21 |
| 201810 | Good Standing | 2.79 | CSF | 1.695 | 3.26 | 3.26 | 2.445 | 4.075 | 2.445 | 1.98 | 1.98 | 4.89 | 3.96 | 4.89 | 3.39 | 3.39 | 3.20 |
| 201720 | Near At-Risk | 2.45 | CIN | 2.454 | 3.6 | 3.6 | 2.7 | 4.5 | 2.7 | 1.92 | 1.92 | 5.4 | 3.84 | 5.4 | 4.908 | 4.908 | 3.68 |
| 201820 | At-Risk | 1.84 | COM | 1.845 | 2.92 | 2.92 | 2.19 | 3.65 | 2.19 | 2.28 | 2.28 | 4.38 | 4.56 | 4.38 | 3.69 | 3.69 | 3.15 |
| 201810 | At-Risk | 1.78 | FJW | 1.665 | 3.4 | 3.4 | 2.55 | 4.25 | 2.55 | 2.52 | 2.52 | 5.1 | 5.04 | 5.1 | 3.33 | 3.33 | 3.44 |
| 201910 | Very Good | 3.11 | COM | 2.19 | 3.368 | 3.368 | 2.526 | 4.21 | 2.526 | 2.16 | 2.16 | 5.051 | 4.32 | 5.0514 | 4.38 | 4.38 | 3.51 |
| 201810 | Good Standing | 2.76 | CIA | 1.86 | 2.86 | 2.86 | 2.145 | 3.575 | 2.145 | 2.34 | 2.34 | 4.29 | 4.68 | 4.29 | 3.72 | 3.72 | 3.14 |
| 201820 | Near At-Risk | 2.16 | COM | 2.538 | 3.62 | 3.62 | 2.715 | 4.525 | 2.715 | 1.508 | 1.508 | 5.43 | 3.015 | 5.43 | 5.076 | 5.076 | 3.60 |
| 201810 | Near At-Risk | 2.42 | CSF | 2.055 | 3.02 | 3.02 | 2.265 | 3.775 | 2.265 | 2.34 | 2.34 | 4.53 | 4.68 | 4.53 | 4.11 | 4.11 | 3.31 |


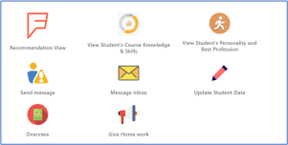
Figure 6: Recommendation Education system for At-risk learners
In order to find the best predictor for student performance, we have used different machine learning algorithms (Decision Tree, Random Forest, SVM and Association rules); then we evaluated and refined the used algorithm. The main aim is to develop a primitive platform that can be used to develop an education recommendation system to support At-risk learners 24/7 and teachers to coach students with poor knowledge, skills, and to provide them with the right advice.
Applying online coaching to at-risk students needs to build a recommendation framework that predicts at-risk students considering their knowledge and skills performance in segments of concepts rather than an entire course, considering their personality style. This helps to give coaching in the form of advice crumbs, as shown in the implementation figure 9 below, which may be tutorials, segment coding, exercises, peer discussions, etc.
The association rules are used to created recommendations considering student knowledge and skills performance.
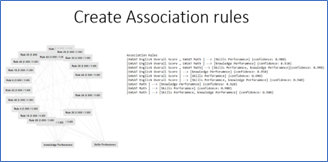
Figure 7: Applied Association rules for creating recommendations
4.2. Explore profiles of students
First, we purified information from all NA instances, measured the mean and variance and the range for each pattern. As shown in the table below, we measured the mean and variance and the three majors’ GPA quartile.
Table 6: Descriptive statistical of the GPA – CIS three-concentrations
| Major | count | mean | std | min | 25% | 50% | 75% | max |
| Applications Development | 32.00 | 3.10 | 0.40 | 2.15 | 3.00 | 3.20 | 3.25 | 3.90 |
| Networking | 56.00 | 2.69 | 0.61 | 1.40 | 2.27 | 2.56 | 3.20 | 3.74 |
| Security and Forensics | 126.00 | 2.69 | 0.54 | 1.30 | 2.40 | 2.68 | 3.00 | 3.68 |
In the application development department, the students typically have the highest average GPA, the Security and Forensics students have the second-highest average GPA, and the Networking students have the lowest average GPA. In the three conditions, we have been able to identify different personalities. Security and forensic students share the introverted sensing function type, which means they are more likely to feel, and judge – ISFJ.
It should be clear that, as demonstrated below, we have security students with various types of personalities, however, the GPA scores declined slightly accordingly.
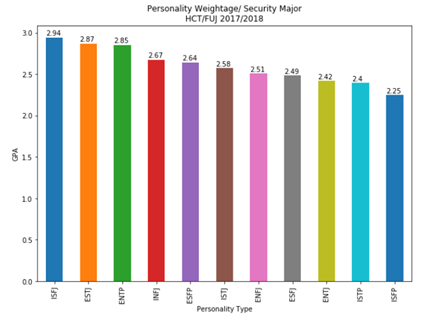
Figure 8: Personality type’s weight-Security and Forensics Major.
Students form Networking Major are more ISTJs, which means more Introduction (I), Sensing (S), Thinking (T), and Judging (J). As shown in the below figures, major students in the App development are more ISTJ.
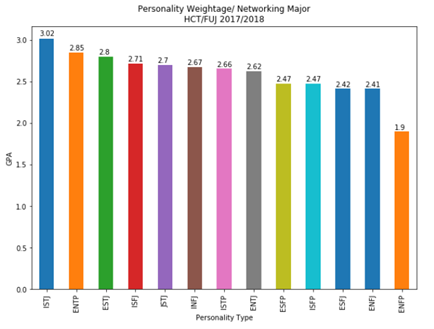
Figure 9: Personality type-Networking major.
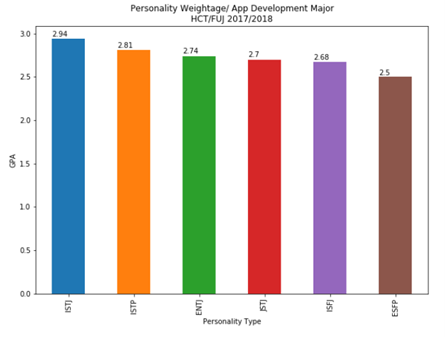
Figure 10: Personality type – App Development major.
5. Experimental Results
In the following tables, we summarized the statistics on student success.
Table 7: Four courses performance statistics for personality types – Security and Forensics major
| GPA | CIS 1403 | CIS 2403 | CIN 2003 | CSF 3103 | Extraverted | Introverted | Sensing | Intuitive | Thinking | Feeling | Judging | Prospecting | |
| count | 9.00 | 9.00 | 9.00 | 9.00 | 9.00 | 9.00 | 9.00 | 9.00 | 9.00 | 9.00 | 9.00 | 9.00 | 9.00 |
| mean | 2.44 | 1.84 | 1.92 | 2.18 | 2.81 | 42.78 | 57.22 | 56.96 | 43.04 | 52.70 | 47.30 | 59.08 | 40.92 |
| std | 0.30 | 0.47 | 0.50 | 0.51 | 0.48 | 20.61 | 20.61 | 8.62 | 8.62 | 10.82 | 10.82 | 16.78 | 16.78 |
| min | 1.87 | 1.33 | 1.52 | 1.00 | 2.00 | 7.00 | 30.25 | 40.50 | 34.00 | 36.00 | 35.50 | 32.00 | 24.50 |
| 25% | 2.30 | 1.53 | 1.68 | 2.05 | 2.80 | 30.58 | 39.00 | 56.00 | 38.67 | 44.00 | 39.41 | 42.00 | 29.75 |
| 50% | 2.50 | 1.73 | 1.75 | 2.33 | 2.84 | 34.71 | 65.29 | 60.00 | 40.00 | 57.67 | 42.33 | 67.19 | 32.81 |
| 75% | 2.53 | 2.03 | 2.00 | 2.38 | 3.06 | 61.00 | 69.42 | 61.33 | 44.00 | 60.59 | 56.00 | 70.25 | 58.00 |
| max | 2.92 | 2.92 | 3.20 | 2.85 | 3.57 | 69.75 | 93.00 | 66.00 | 59.50 | 64.50 | 64.00 | 75.50 | 68.00 |
Table 8: Four courses performance statistics for personality types- Networking major
| GPA | CIS 1403 | CIS 2403 | CIN 2003 | CSF 3103 | Extraverted | Introverted | Sensing | Intuitive | Thinking | Feeling | Judging | Prospecting | |
| count | 13.00 | 13.00 | 13.00 | 13.00 | 13.00 | 13.00 | 13.00 | 13.00 | 13.00 | 13.00 | 13.00 | 13.00 | 13.00 |
| mean | 2.50 | 1.80 | 1.79 | 2.56 | 2.71 | 51.81 | 48.19 | 53.47 | 46.53 | 49.63 | 50.37 | 50.01 | 49.99 |
| std | 0.40 | 0.53 | 0.49 | 0.56 | 0.53 | 21.06 | 21.06 | 7.47 | 7.47 | 11.28 | 11.28 | 18.07 | 18.07 |
| min | 1.90 | 1.00 | 1.30 | 1.71 | 1.90 | 25.33 | 19.00 | 41.10 | 38.00 | 34.10 | 33.95 | 24.25 | 24.50 |
| 25% | 2.24 | 1.57 | 1.60 | 2.29 | 2.26 | 31.78 | 30.25 | 46.00 | 40.25 | 39.00 | 40.54 | 36.00 | 31.38 |
| 50% | 2.50 | 1.71 | 1.68 | 2.40 | 2.88 | 55.57 | 44.43 | 56.38 | 43.62 | 51.00 | 49.00 | 46.00 | 54.00 |
| 75% | 2.79 | 2.00 | 1.94 | 2.70 | 3.06 | 69.75 | 68.22 | 59.75 | 54.00 | 59.46 | 61.00 | 68.62 | 64.00 |
| max | 3.13 | 3.18 | 3.22 | 4.00 | 3.43 | 81.00 | 74.67 | 62.00 | 58.90 | 66.05 | 65.90 | 75.50 | 75.75 |
Table 9: Four courses performance statistics of personality types-App Development major.
| GPA | CIS 1403 | CIS 2403 | CIN 2003 | CSF 3103 | Extraverted | Introverted | Sensing | Intuitive | Thinking | Feeling | Judging | Prospecting | |
| count | 4.00 | 4.00 | 4.00 | 4.00 | 4.00 | 4.00 | 4.00 | 4.00 | 4.00 | 4.00 | 4.00 | 4.00 | 4.00 |
| mean | 2.96 | 3.07 | 2.98 | 2.14 | 1.88 | 29.68 | 70.32 | 43.94 | 56.06 | 44.54 | 55.46 | 37.97 | 62.03 |
| std | 0.34 | 0.15 | 0.21 | 0.45 | 0.14 | 8.85 | 8.85 | 12.80 | 12.80 | 10.81 | 10.81 | 13.60 | 13.60 |
| min | 2.52 | 2.90 | 2.74 | 1.60 | 1.74 | 20.33 | 60.14 | 30.57 | 40.00 | 30.88 | 43.71 | 26.60 | 43.00 |
| 25% | 2.79 | 2.98 | 2.86 | 1.86 | 1.78 | 23.53 | 64.58 | 35.79 | 49.25 | 39.22 | 49.18 | 29.15 | 57.04 |
| 50% | 3.02 | 3.07 | 2.98 | 2.17 | 1.90 | 29.27 | 70.73 | 42.60 | 57.40 | 45.50 | 54.50 | 34.14 | 65.86 |
| 75% | 3.19 | 3.16 | 3.10 | 2.45 | 2.00 | 35.42 | 76.47 | 50.75 | 64.21 | 50.82 | 60.78 | 42.96 | 70.85 |
| max | 3.27 | 3.23 | 3.22 | 2.60 | 2.00 | 39.86 | 79.67 | 60.00 | 69.43 | 56.29 | 69.12 | 57.00 | 73.40 |
The count feature shown in the above table should be clear, referring to each major’s personality styles. In addition, the mean, minimum and standard deviation of GPA values from each course is calculated, and the four courses and personalities are also calculated. Apart from CSF 3103, the course for the security major, the App development students did not receive the results of NaN but took the networking course CIN-2003. We evaluated students’ performance with their personalities in the four classes. In every course, according to the college grading system, we determined the GPA value of students.
Table 10: College GPA grades conversion values
| Score | F | D | D+ | C- | C | C+ | B- | B | B+ | A- | A |
| GPA | 0 | 1 | 1.3 | 1.7 | 2 | 2.3 | 2.7 | 3 | 3.3 | 3.7 | 4 |
- The personalities patterns in the four courses for Security and Forensics major.
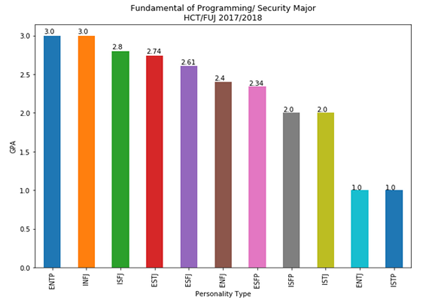
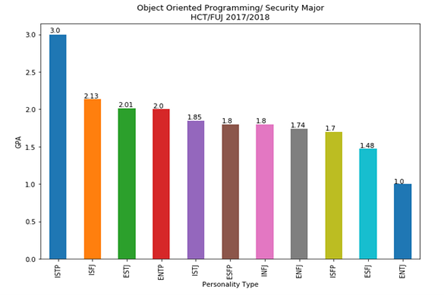
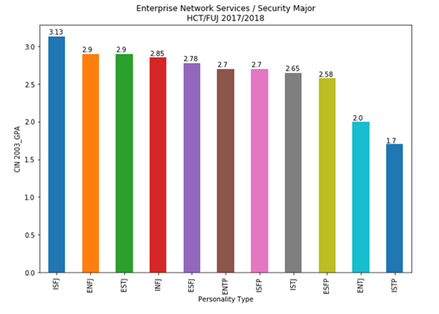
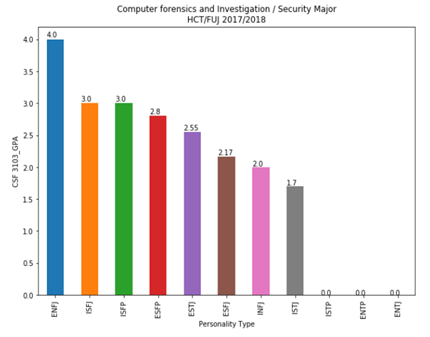
Figure 11: The impact of personality as a measure for four courses on security and forensics major.
- The personalities patterns in the four courses for Networking major.
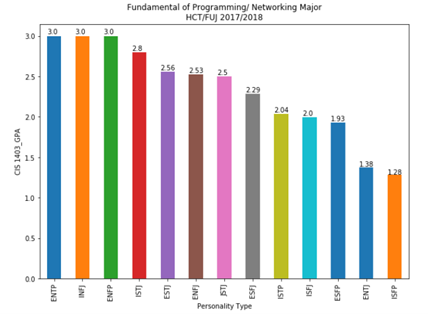
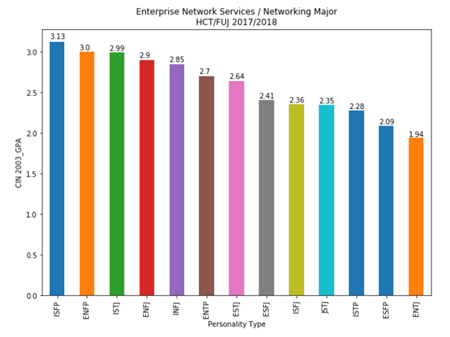
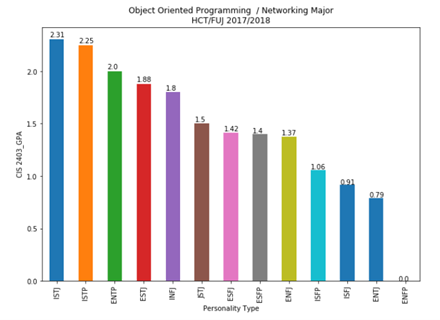
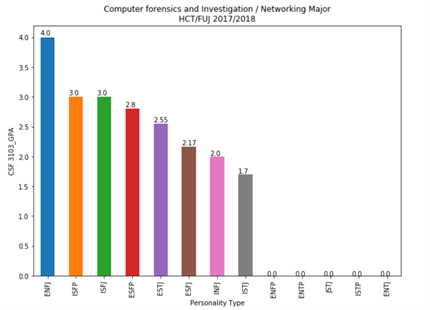
Figure 12: Impact of personality for Networking major as a measure on the four courses
- The personalities patterns in the four courses for App Development major
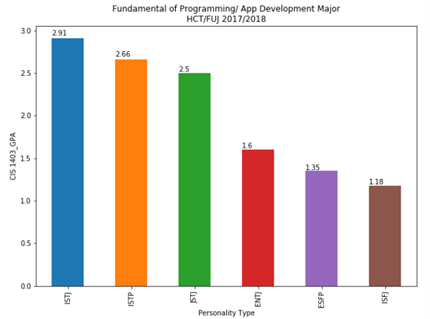
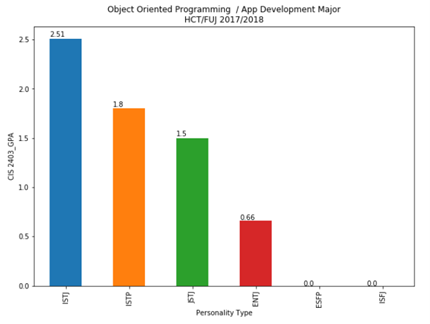
Figure 13: The personality impact on App Development as measured on the four courses.
In each major and different course, the following table summarizes the results of the best personalities.
Table 11: Personality performances in the four courses.
| GPA | Fundamentals of Programming |
Object-Oriented Programming
|
Enterprise Network Services | Computer Forensics and Investigation | |
| Security and Forensics | >=3.0 | ENTP, INFJ | ISTP | ISFJ | ENFJ, ISFJ, ISFP |
| >=2.5 | ISFJ, ESTJ, ESFJ | ENFJ, ESTJ, INFJ, ESFJ, ENTP, ISFP, ISTJ, ESFP | ESFP, ESTJ | ||
| >=2.0 | ENFJ, ENFP, ISTJ, ISFP | ISFJ, ESTJ, ENTP | ENTJ | ESFJ, INFJ | |
| Networking | >=3.0 | ENTP, INFJ, ENFP | ISFP, ENFP | ENFJ, ISFP, ISFJ | |
| >=2.5 | ISTJ, ESTJ, ENFJ, ISTJ | ISTJ, ENFJ, INFJ, ENTP, ESTJ | ESFP, ESTJ | ||
| >=2.0 | ESFJ, ISTP, ISFJ | ISTJ, ISTP, ENTP | ESFJ, ISFJ, ISTJ, ISTP, ESFP | ESFJ, INFJ | |
| App Development | >=3.0 | ||||
| >=2.5 | ISTJ, ISTP, ISTJ | ISTJ | ISTJ, ISTP | ||
| >=2.0 | ISTJ |
Based on their personality, we may describe the conditions for a major choice to be made, or we have the ability to predict a student’s GPA (grade point average). Take an example such as this study by the hospital and try to analyze it with the below algorithm.
If “ISFJ” or “ESTJ”
- The best major is Security & Forensics
ELSE IF “ISTJ” or “ENTP”
- The best major is Networking
ELSE IF “ISTJ” or “ISTP”
- The best major is App Development.
In the case of teaching computers to “understand” the best major, we can also rely on specific patterns, the systematic way, in the algorithm below.
If “S” and “J”
- choose Security & Forensics
ELSE IF (“S” or ‘N’) AND “T”
- The best major is Networking
ELSE IF “S” AND “T”
- The best major is App Development.
It is important to have measured students’ knowledge and skills to recognize getting into trouble students’ academic status and their needs. Students are given an assessment in four courses that cover OOP, Enterprise Networks and Services. A breakdown of students’ knowledge from various academic majors was compiled, and the numbers are listed below.
The factors that we looked at were the students’ different academic performance, as well as the skills they demonstrated in the OOP course.
Table 12: The knowledge of OOP course over the three majors.
| Knowledge | Object-Oriented Programming | |||||
| GPA | Concepts of object-oriented programming | Terminology of methods | Terminology of functions | Terminology of inheritance | Terminology of encapsulation | |
| Security and Forensics | >=3.0 | 82% | 77% | 76% | 81% | 83% |
| >=2.5 | 0% | 0% | 0% | 0% | 0% | |
| >=2.0 | 74% | 71% | 71% | 76% | 75% | |
| Networking | >=3.0 | 0% | 0% | 0% | 0% | 0% |
| >=2.5 | 0% | 0% | 0% | 0% | 0% | |
| >=2.0 | 77% | 68% | 74% | 69% | 67% | |
| App Development | >=3.0 | 0% | 0% | 0% | 0% | 0% |
| >=2.5 | 77% | 72% | 76% | 68% | 81% | |
| >=2.0 | 0% | 0% | 0% | 0% | 0% | |
Table 13: OOP skills performance in the three major categories.
| Skills | Object-Oriented Programming | |||||
| GPA | Implement OOP tools | Use advanced features | Develop programs | Use Collections Framework | Test and evaluate a program | |
| Security and Forensics | >=3.0 | 87% | 79% | 77% | 76% | 79% |
| >=2.5 | 0% | 0% | 0% | 0% | 0% | |
| >=2.0 | 77% | 65% | 68% | 72% | 81% | |
| Networking | >=3.0 | 0% | 0% | 0% | 0% | 0% |
| >=2.5 | 0% | 0% | 0% | 0% | 0% | |
| >=2.0 | 80% | 66% | 71% | 73% | 72% | |
| App Development | >=3.0 | 0% | 0% | 0% | 0% | 0% |
| >=2.5 | 79% | 69% | 77% | 80% | 83% | |
| >=2.0 | 0% | 0% | 0% | 0% | 0% | |
6. Discussion and Conclusions
This study proposes a model for evaluating university students’ academic status and GPA performance ambitions. Faculty and staff call upon these three factors in decisions: personality preferences, perceived knowledge and skills as well as what they expect from each student. In their attitudes, knowledge and skills, computing students are not identical. We see the disparities between students’ grades because the universities lack an understanding of these disparities between learners’ abilities and a special opportunity for creating a truly unique learning method that matches their individuality. This makes it difficult to apply the same philosophy and expects all students to be highly qualified.
This system allows for specific algorithms to be included, in the students’ guidance, academic major choice or even the selection process. In a class on security, when we use sections for personality types, we can use an algorithm to predict the student’s ranking automatically.
IF “Security & Forensics major.”
IF “ENFJ” or ‘ISFP’ or ISFJ’
- Expected high grade
ELSE IF ‘ENTJ’ or ‘ENPT’
- Expected fail case
ELSE
- Expected low grade
We did not look at all scenarios, only example algorithms.
IF “OBJECT-ORIENTED COURSE”
IF “ISTP” or “ISTJ”
- Expected high grade
ELSE
- Expected low grade
In general, consider how OOP awareness is summarized in Table 9. Security students have the ability to implement higher object-oriented concepts than those with a non-security background. Again, we want to emphasize the personality that makes these differences, not the selected major. This clarifies that major security students could perform well than other major students because of the difference in a student’s personality that corresponds to the offered programming course. See the algorithm below that demonstrates it.
For a Major
If Personality ‘ISTJ’ & ‘FUNDAMENTAL OF PROGRAMMING’
- Expect GPA >=2.0
In view of the basics, the students in App developers major with the ‘ISTJ’ personality achieve round 2.91 GPA, while networking students are expected to achieve 2.8 GPA and security and forensics students 2.0 GPA. The differences are seen in the second and third levels as a result of other factors: knowledge and skills.
In the following sections, the benefits of implementing the three-layer model are listed.
- Maintain high-quality graduates with an appropriate level in their technical knowledge and skills.
- Minimize cases at risk.
- Keep an eye on signs of inattentiveness and poor academic performance.
- A decrease in the number of delayed graduate students.
- Avoid the disproportionate dropout from prospective students in response to dismissal or academic warnings.
- Make sure to have a high level of student retention.
- Provide tools to assist individuals to become more effective in selecting courses and getting the right major.
- Keep clear knowledge of each student’s academic progress in case of a student falling behind.
7. The Conclusion & Future Work
Educational institutions have a tremendous burden of handling students with low academic performance (At-risk students). Many approaches support this group of pupils, such as psychological therapy, a proper timetable for vulnerable pupils, recall, personal training, mock-tests, direct private education, or success centres. However, these methods are not enough to solve the issue, since other factors could also influence the learner’s success, which could be their family difficulties, cognitive style, prior academic performance, and the foundation of the college level. Learners personalities are the most important factor that needs a great deal of attention to understand students’ individuality and natural abilities. This greatly helps to adapt the materials supplied to their perceptions and offers solid support during the study programme. This paper proposes a recommendation system based on three key angles: personalities of the learner, skills of the learner and academic knowledge of the learner. The proposed layered model helps predict at-risk students, provide better advising, enhance learners’ performance and skills, discover their employability competencies, and support learners with a recommendation in terms of tutorials, exercises, etc. during their study period. Based on the association rule, the proposed recommendation framework is structured to predict student success in different college programs and predict their academic status based on their personality analysis and academic performance. It is highly recommended that the admission and consultancy framework be maintained at the university level to fill the fragmentation of students’ knowledge and skills. This improves student success and clearly identifies the study program’s weaknesses and encourages students to address any observed fragmentations.
This pilot study offers further insight as to the strengths and weaknesses of the three specific majors who receive the most job postings, “Application Development, Networking and Security and Forensics.” In addition to measuring a student’s actual academic performance, the system also distributes personalized advice based on the student’s digital profile. Collecting data from multiple learners from different programs allows us to understand what the program is trying to accomplish and what students need to know. The data completed throughout the learning process helps guide and get the learners to further levels of understanding. Future research will continue to create more trust in this advice through the study’s continuation to include students from various other programs, like Business Solutions, Applied Media and Engineering. The proposed and implemented solution is very successful and leads to quick results, but it does not offer as much information because it does not account for the students’ learning progress. Advisors constantly have access to learners’ information about their personalities which affect their privacy.
Conflict of Interest
The authors declare no conflict of interest.
Acknowledgements
This work was supported by H.C.T. Research Grants (H.R.G.) [Fund No: 113108]. We want to express our gratitude to the Higher Colleges of Technology for the financial grant.
- O.H. Embarak, “Three Layered Factors Model for Mining Students Academic Performance,” in 2018 Fifth HCT Information Technology Trends (ITT), IEEE: 219–226, 2018. https://doi.org/10.1109/CTIT.2018.8649491
- F. Martin, D.U. J O.L. Bolliger, “Engagement matters: Student perceptions on the importance of engagement strategies in the online learning environment,” ERIC, 22(1), 205–222, 2018.
- M. Salam, N. Ibrahim, M. J I.J. of I. Sukardjo, “Effects of Instructional Models and Spatial Intelligence on the Mathematics Learning Outcomes after Controlling for Students’ Initial Competency,” ERIC, 12(3), 699–716, 2019.
- R.A. J O.J. of S.S. Faisal, “Influence of Personality and Learning Styles in English Language Achievement,” 7(8), 304–324, 2019.
- C.Y.R. Loh, T.C. J J. of E. Teo, S. Policy, “Understanding Asian students learning styles, cultural influence and learning strategies,” 7(1), 194–210, 2017.
- E. Care, H. Kim, A. Vista, K. J C. for U.E. at T.B.I. Anderson, “Education System Alignment for 21st Century Skills: Focus on Assessment,” 2018.
- J. Halberstadt, J.-M. Timm, S. Kraus, K. J J. of K.M. Gundolf, “Skills and knowledge management in higher education: how service learning can contribute to social entrepreneurial competence development,” 2019.
- M. Gerlach, B. Farb, W. Revelle, L.A.N. J N. human behaviour Amaral, “A robust data-driven approach identifies four personality types across four large data sets,” 2(10), 735–742, 2018.
- A. Baumert, M. Schmitt, M. Perugini, W. Johnson, G. Blum, P. Borkenau, G. Costantini, J.J.A. Denissen, W. Fleeson, B. J E.J. of P. Grafton, “Integrating personality structure, personality process, and personality development,” 31(5), 503–528, 2017.
- A. Kamal, S. J E. Radhakrishnan, I. Technologies, “Individual learning preferences based on personality traits in an E-learning scenario,” 24(1), 407–435, 2019.
- H.T.-C. in human behavior, undefined 2016, “Integrating learning styles and adaptive e-learning system: Current developments, problems and opportunities,” Elsevier,.
- R. Stein, A.B. %J S. Swan, P.P. Compass, “Evaluating the validity of Myers‐Briggs Type Indicator theory: A teaching tool and window into intuitive psychology,” 13(2), e12434, 2019.
- Z.T. Ardakani, L. Samadi, “The Relationship between Introversion as Personality Trait and Job Satisfaction among EFL Teachers.”
- L.S. Byrd, A study of an arts integration curriculum and its impact on academic achievement, University of South Alabama, 2019.
- S. J E.L.T. Alnujaidi, “The Difference between EFL Students’ Preferred Learning Styles and EFL Teachers’ Preferred Teaching Styles in Saudi Arabia,” 12(1), 90–97, 2019.
- H. J D.S. Demirkan, “An inquiry into the learning-style and knowledge-building preferences of interior architecture students,” 44, 28–51, 2016.
- G. J C. Falloon, Education, “Using simulations to teach young students science concepts: An Experiential Learning theoretical analysis,” 135, 138–159, 2019.
- O. Embarak, M. Khaleifah, A. Ali, “An Approach to Discover Malicious Online Users in Collaborative Systems,” in International Conference on Emerging Internetworking, Data & Web Technologies, Springer: 374–382, 2019.
- J. Reynolds, D.R. Adams, R. Ferguson, P. Leidig, “The personality of a computing major: It makes a difference,” in 2016 Proceedings of the EDSIG Conference. ISSN, 2473–3857, 2016.
- M.Z. Tunio, H. Luo, W. Cong, Z. Fang, A.R. Gilal, A. Abro, S. %J I.A. Wenhua, “Impact of personality on task selection in crowdsourcing software development: A sorting approach,” 5, 18287–18294, 2017.
- S.J.L. Foster, M.R. %J I.J. of E.S. Huml, “The relationship between athletic identity and academic major chosen by student-athletes,” 10(6), 915, 2017.
- Myers Briggs Assessment – Learn the Power of Personality Preferences.