Diagnosis of Tobacco Addiction using Medical Signal: An EEG-based Time-Frequency Domain Analysis Using Machine Learning
 , Nafiul Hasan 2, Mohammed Saud A Alsubaie 3, Md Mostafizur Rahman Komol 1
Adv. Sci. Technol. Eng. Syst. J. 6(1), 842–849 (2021);
 DOI: 10.25046/aj060193
Addiction such as tobacco smoking affects the human brain and thus causes significant changes in the brainwaves. The changes in brain wave due to smoking can be identified by focusing on changes in electroencephalogram pattern, extracting different time-frequency domain features. In this aspect, a laboratory-based study has been presented in this paper, for assessing the brain signal changes due to the tobacco addiction. Four classifier models, namely, Logistic Regression (LR), K- Nearest Neighbor (KNN), Support Vector Machine (SVM) and Random Forest Classifier (RFC) were trained and tested for assessing the performance of the time domain, frequency domain and fusion of time-frequency domain features, with a five-fold cross-validation. Four different performance measures (sensitivity, specificity, accuracy, and area under the receiver operating characteristic curve) were used to measure the overall performance, and the results suggested that the classifiers based on time-frequency domain features perform the best while using combinedly. Using the utilized fusion of the time-frequency domain features, the classification models can identify the smoker group with an accuracy ranged from (86.5-91.3%), where the RFC shows the best accuracy of 91.3%, which is higher than the three other classifiers models.
1.Introduction
This paper is an extension of work originally presented in International Conference on Computer, Communication, Chemical, Materials and Electronic Engineering (IC4ME2) [1]. The presented paper [1] utilized electroencephalogram (EEG) for the diagnosis of tobacco smoking based on only one machine learning model (artificial neural network), where the current article is expanded further to validate the EEG based diagnosis using multiple machine learning models. Also, this paper examines the utility of the time domain and frequency domain, individually and their combination on the EEG based tobacco addiction diagnosis.
In this modern era of life science, research in the field of neuroscience and cognitive engineering is flourishing with technological evolution. Electroencephalogram (EEG) is being used in this sector to understand sophisticated conditions of the brain as this is sensitive and susceptible to any action, especially for drug addiction, for example, alcohol, morphine, heroin or Cannabis addictions. Different stages of drug addiction can be determined only through EEG analysis, and this is very much necessary in the treatment of drug addiction. Some drug elements, such as nicotine is found in nature (from Nicotiana tabacum and Nicotiana rustica). They also have good effects on health; for example, nicotine is being used in the treatment of cognitive disorder and depression. Its impact on the body depends on the way of its metabolism and absorption, such as P-450 pathway degrades several body parts. At a level, it strengthens/weaken other taken drugs. A review work has done to analyze the pros and cons of nicotine, where limitation they noted are the analysis of the complex way of changing cognitive function and host inflammatory response [2]. By analyzing the EEG response, the changing pattern can be determined easily. Drug elements like tobacco, tar and nicotine affect on mood and behavior, which is controlled by human brain consisting of neurons [3].
2. Literature Review
A significant amount of public awareness against tobacco addiction have been conducted to date, but not all the public announcements were effective. To know the degree of effectiveness of public service announcement against smoking, a pilot study was conducted in Rome by collecting EEG, heart rate and galvanic skin response. Based on approach withdrawal, effort and emotional indexes, it was found that these parameters that show notable differences between effective and ineffective perception [4].
In addition to the public awareness, several studies have been conducted on identifying the physical and mental changes due to the smoking habit and potential treatments. An analysis was performed by [5], who had experimented on 21 male smokers. The authors had analyzed the EEG wave of the participants before and after the horizontal rotation treatment. They found that the treatment is beneficial in improving the EEG Alpha band, which reduces the smoking effect. An increment in alpha rhythm denotes higher relaxation and concentration ability of subjects [5]. Another study was conducted on 19 smoker participants. The functional magnetic resonance imaging (fMRI) and EEG analysis represented the effect of nicotine on the brain while doing oddball tasks, which is a response time task [6]. The study suggested that the integrated EEG-fMRI system is better identifying the brainwave changes due to smoking.
Though most of the studies has investigated the effect of tobacco smoking on the brain using the EEG, very few studies had done the differentiation of EEG characteristics using machine learning algorithms. In a study [7], the authors have done an experiment on 20 participants having 10 smokers and 10 non-smokers, to observe the changes in the EEG signal due to the smoking effect. The authors had used a Support Vector Machine (SVM) classifier based on Radial Basis Function (RBF) kernel and found that the the power spectral density (PSD) features performed better than the Fast Fourier Transform (FFT) features. Another study developed an EEG-based architecture to determine the effect of tobacco in the brainwaves, using 3 participants in a laboratory-based work [1].
The authors extracted time, frequency domain features from the EEG and showed that the frequency domain features, especially the power spectral density (PSD) and the Fast Fourier Transform (FFT) are most sensitive to the smoking condition than the time domain features for the smoker detection. The study showed promising results but utilized only one classifier (ANN) for the classification approach and only one performance measure (mean square error) for the assessment of the system [1]. However, considering the sensitivity and specificity metrics are most important for an EEG based detection system. As higher sensitivity with lower specificity leads to the higher false detection and the opposite trend causes the missing of a lot of positive states (in this case, smokers), a compromise between the two metrics is crucial.
This paper embodies a methodology for the diagnosis of tobacco smoking, based on the time-frequency analysis of the EEG signal. Also, the analysis was conducted to find efficient analyzing model and feature. BIOPAC® system was used for data collection, and Acknowledge-4.1® package [8] was used for extracting features. Later, python 3.6.9 version was used in Google Colab platform for data analysis. Most importantly, four supervised classification models, namely, Logistic Regression, K- Nearest Neighbor (KNN), Support Vector Machine (SVM) and Random Forest Classifier (RFC) were trained and tested for evaluating the performance of each of the EEG rhythm, with a five-fold cross-validation. Moreover, four different performance measures (sensitivity, specificity, accuracy and area under the receiver operating characteristic curve) were utilized to examine the performance of the diagnosis system. The following part of this paper is organized as follows- a brief methodology, including experimental design and tools, then the result section with the findings. Last, the paper was concluded, followed by a short discussion on the outcomes.
3. Methodology
3.1. Experimental Design
The methodology for building an electroencephalogram based tobacco addiction diagnosis system is shown in Figure 1. After selecting three participants, EEG were obtained by the BIOPAC® system. After that the removal of noise and artifacts were considered.
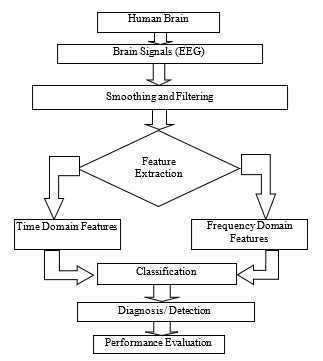 Figure 1: Block diagram for the proposed EEG based smokier / nonsmoker detection system
Afterwards, eight features were extracted for each domain, and the selected features were supplied towards the machine learning tools. Four different classification models, namely K-nearest neighbours (KNN), support vector machines (SVM), logistic regression (LR) and random forest classifier (RFC) models were developed in python 3.6.9 platform. The evaluation of the best classifier and domain was done by comparing their performance.
3.2. Experimental Equipment
3.2.1. Hardware tool
BIOPAC® MP 36 device was used at Biomedical Engineering lab, KUET for the experimentation purpose. The experimental setup is shown in Figure 2 [8].
3.2.2. Pre-processing and feature extraction software tool
Feature extraction was an important step in this study, which was done using the BIOPAC® student Lab Pro and Acqknowledge 4.1® software Google Colab research platform with the python 3.6.9 for developing the Machine learning-based classification models [9].
3.3. Participants
In total, three subjects participated in this experimental study, who were male, healthy and not suffering from psychological illness. The subjects were instructed to close their eyes while solving some simple arithmetic questions for 20 minutes. An interpreter used to ask the arithmetic question to the participants. In that respect, the brain response (EEG signal) is a result of cognitive event-related potential (ERP) type. A total of ten trials were taken for each subject. The cognitive event was selected because in that case, the participants can easily concentrate and in eye closed condition, there are no eye blinking/ EOG artefacts [9].
Electrodes placement was configured on the right central (C4), and the right occipital (O2) position as the regions are responsible for problem solving and cognitive function, respectively. It is to note that, the authors have selected the cognitive task from their experience from previous pilot studies where the cognitive task gives clear signals with less noise [10, 11].
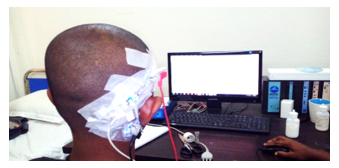 Figure 2: Representational view while conducting the experiment in BME lab, KUET
3.4. Experimental Procedure
3.4.1. Signal Preprocessing
The primarily obtained EEG signals could have contained noise due to muscle movement, eye blinking and hand movement. Along with line frequency was 50 Hz. To pre-process raw EEG was gone through bandpass finite impulse response (FIR) filter with a range of 0.5 to 44 Hz, as it removes the non-linear trends of the signals. Later the signal was further smoothed, taking a moving average over a short period of the signal.
3.4.2. Feature Extraction
Various features were extracted in time and frequency domain, including standard deviation (STDDEV), maximum value (Emax), skew (sk), kurtosis (k), power spectrum density (PSD) mean, PSD max, Fast Fourier Transform (FFT) mean, FFT max (total eight feature) were extracted for each subject using the Acknowledge 4.1® software. For feature extraction was done using a 5-second epoch length.
3.4.3. Feature Scaling
The time and frequency domain features, which were extracted from the EEG signal, have different range in their magnitude. As the machine learning models work with various features putting them in the same matrix, it is essential to put all the features in a same range, which is referred to as feature scaling. Two common types of feature scaling is done in preliminary data: standardization and normalization [12, 13]. MinMaxScaling was done in this study in python 3.6.9 platform, as a part of the normalization process. MinMaxscaler() function from sklearn library was used fo this purpose. Here the data is shrunk within a range between [-1,1].
![]() The formula of min-max scaling can be given by equation (1). Here, is the normalized value of a feature point x, within a range and [14].
The formula of min-max scaling can be given by equation (1). Here, is the normalized value of a feature point x, within a range and [14].
3.5. Classification
For the diagnosis of tobacco smoking, classification is the main and last step, which is done through machine learning. Machine learning is the application of artificial intelligence, which provides a system capable of learning nature from a given data. There are three categories of Machine Learning models and applications, supervised learning, unsupervised learning, and reinforcement learning. Supervised learning is extensively used for the classification and regression problem [15]. Previous studies worked with EEG have used supervised learnings, especially K-Nearest Neighbour [16], Support Vector Machine [17], Random Forest Classifier [18] and Logistic Regression [19]. Based on the previous studies, these four classifiers were chosen for the data classification in this research.
3.5.1. Logistic Regression (LR)
Logistic regression is a supervised learning model, which works based on the linear method, and the predictions are made using a logistic or sigmoid function σ(t). The sigmoid function is ‘S’ patterned curve that takes a real number and maps within a range between 0 and 1. Equation (2) represents the sigmoid function.
![]() Considering two types of variables, dependent and independent, Logistic regression predicts the dependant variable based on the independent variable. The ‘C parameter’ was tuned here in the Logistic regression model to reduce overfitting [20,21].
Considering two types of variables, dependent and independent, Logistic regression predicts the dependant variable based on the independent variable. The ‘C parameter’ was tuned here in the Logistic regression model to reduce overfitting [20,21].
3.5.2. K-nearest neighbours (KNN)
KNN is a supervised learning algorithm, and a non-parametric method where k nearest training examples in the feature space is taken as input and neighbours vote do the classification generally used for classification and regression. At the very starting point, KNN read the value of K, type of distance D and test data; then it finds the K nearest neighbours D to the test data and thus sets the maximum label class of K to test data. The same process is gone through an iterative process named looping. In details, its algorithm initializes the value of K from 1 (setting as initial iteration value). After loading data, iteration from initial K =1 (generally) to the total number of training data point while distances specifically Euclidean distance between test data and each row of training data is measured and sorted in ascending order to get topmost k rows from the sorted array and the most frequent class is returned as the predicted class [22]. The value of K was tuned, and the k for best efficiency was chosen in the classifier model in this research to reduce overfitting.
3.5.3. Random Forest Classifier (RFC)
Ensemble learning models, such as Random forests are made of individual decision trees with a logic of group of weak learners to finally make a strong learner while the decision trees operate as divided or conquer. A class is predicted from every decision tree and a final class is predicted by model depending on their vote [22]. Two parameters were tuned in the RFC models in this study, namely, ‘n_estimate’, which implies the number of trees in the forest and ‘max-depth’ which signifies the depth of each tree.
3.5.4. Support Vector Machines (SVM)
An SVM is a supervised learning algorithm, which aims to obtain a hyperplane classifying the data point (data points can be at any side of hyperplane) in feature dimensional space while depending on both linear and non-linear regression. Data points distance across to hyperplane are called support vector whose detection can exchange hyper plane’s location [22]. The model used a Gaussian kernel for SVM classifier in this research due to the non-linear trend of the dataset. Two parameters- ‘C’ and ‘gamma’ was adjusted within a set of values using the grid search algorithm to reduce overfitting.
3.6. Performance Measures
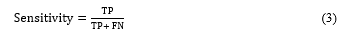
3.6.1. Sensitivity or True Positive Rate (TPR)
True positive rate or Sensitivity is the proportion of the true positives (desired factor), which is correctly identified from the given test set [23]. The definition of sensitivity can be provided by equation (3), where TP = True Positive and FN = False Negative. In this study, sensitivity is the measure of the proportion of successfully identifying a smoker.
 3.6.2. Specificity or True Negative Rate (TNR)
True negative rate Specificity is the proportion of true negative (undesired factor) in which was correctly excluded from the given test sets [23]. The definition of specificity can be provided by equation (4), where TN = True Negative and FP = False Positive. In the case of this study, specificity is the measure correctly identifying a non-smoker. In this study, accuracy is the proportion of successful identification, either smoker or non-smoker.
![]() 3.6.3. Accuracy
3.6.3. Accuracy
The overall accuracy is the proportion of true results (either true positive or true negative) in an experiment [23,24]. The definition of accuracy can be provided by equation (5), given that TP = True positive, TN= True Negative, FP= False Positive and FN = False Negative. In this study, accuracy is the proportion of the successful identification, either a specific person or not being that person.
![]() 3.6.4. Area under the receiver operating characteristic (ROC) curve (AUC)
3.6.4. Area under the receiver operating characteristic (ROC) curve (AUC)
ROC is the plot of the sensitivity (true positive rate) against the (1- specificity) or false positive rate, where all the possible combination of TPR and FPR are plotted, showing the trade-off between them [23–25]. As sensitivity and specificity are two major parameters of performance measures, AUC under ROC always provides a compromise between them. Though there are few methods for validation, five-fold cross-validation was done in this study while evaluating the performance measures. The mean value and the standard deviation (SD) were noted, considering the five experimental validations. Thus, the mean sensitivity, specificity and AUC was calculated from the obtained confusion matrix.
4. Results
4.1. Data visualization (Box plot and violine plots)
Data visualization is an important part to observe the data arrangement. Given data points found from the selected features were plotted in box and violin plots to observe the range of each of the features. The following Figure 3 and Figure 4 shows that the time and frequency domain features are having a versatile variation in the range. Range of the difference features varies among themselves either in the time domain or in the frequency domain, and therefore, the feature scaling was performed.
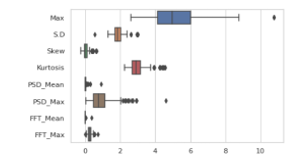 Figure 3: Box Plot of part EEG data showing varying magnitude of differnt features
4.2. Classification Performance
All the features were scaled and were supplied towards the machine learning models after necessary parameter tuning. Four different performance measures were evaluated, namely, sensitivity or true positive rate (TPR), specificity or True negative rate (TNR), accuracy and area under the receiver operating characteristic (ROC) curve (AUC). The obtained results are listed in the Table 1.
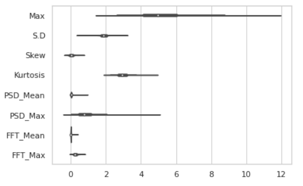 Figure 4: Violine Plot of part EEG data showing varying magnitude of differnt features
Table 1: Performance measures (mean value) for EEG based smoker detection using four different classifiers, five-fold cross-validation
| Domain | Performance Measures | LR | KNN | RFC | SVM |
| Time Domain | Sensitivity | 58.9 | 56.07 | 63.6 | 53.1 |
| Specificity | 55.2 | 57.54 | 61.3 | 55.3 | |
| Accuracy | 57.4 | 55.53 | 62.4 | 59 | |
| AUC | 53.7 | 54.04 | 65 | 60.1 | |
| Frequency Domain | Sensitivity | 70.7 | 77.14 | 81.2 | 70.9 |
| Specificity | 70.7 | 71.35 | 83.7 | 76.3 | |
| Accuracy | 76.1 | 73.75 | 82.9 | 72.9 | |
| AUC | 71.4 | 77.59 | 83.2 | 77.1 | |
| Time-Frequency Domain | Sensitivity | 89.2 | 83.75 | 94.3 | 85 |
| Specificity | 86.3 | 91.25 | 92.1 | 87.2 | |
| Accuracy | 87.2 | 87.5 | 91.3 | 86.5 | |
| AUC | 78.3 | 80.7 | 92 | 88.2 |
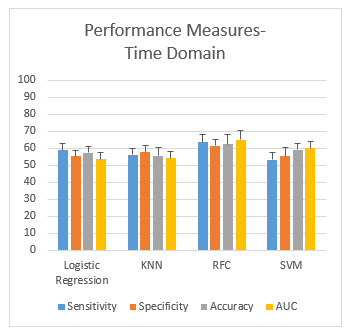 Figure 5: Performance measurement of time domain
4.2.1. Scenario-1: Classification using Time Domain Features
The following Figure 5 shows the plots of the performance measures (mean ± SD) obtained from the classification of smokers and non-smokers using the time domain features from four different classifiers, LR, KNN, SVM and RFC, respectively. The plots show that the gap between sensitivity and specificity is highest in LR (3.68%) and lowest in the case of KNN (1.44%). Overall, RFC gives an accuracy of 62.4%, which performs the best.
4.2.2. Scenario-2: Classification using Frequency Domain Features Domain
The following Figure 6 shows the plots of the performance measures (mean ± SD) obtained from the classification of subjects addicted to smoking using the frequency domain features from four different classifiers, LR, KNN, SVM and RFC, respectively. The plots show that the gap between sensitivity and specificity is higher in KNN (5.8%) and SVM (5.4%) and lowest in the case of LR (0.05%). Overall, RFC gives an accuracy of 82.9%, which performs the best.
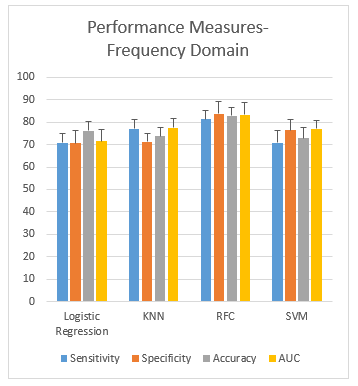 Figure 6: Performance measurement of frequency domain
4.2.3. Scenario-3: Classification using the Time-Frequency Domain Features Domain Features
The following Figure 7 shows the plots of the performance measures (mean ± SD) obtained from the classification of subjects addicted to smoking using the time domain features from four different classifiers, LR, KNN, SVM and RFC, respectively. The plots show that the gap between sensitivity and specificity is the highest in the case of SVM (7.5%) and lowest in the case of RFC (2.2%) and ANN (2.2%). Overall, RFC gives an accuracy of 91.3%, which performs the best.
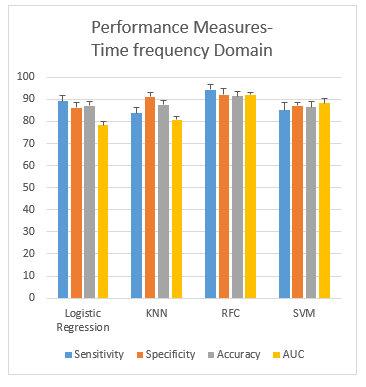 Figure 7: Performance measurement of the time-frequency domain
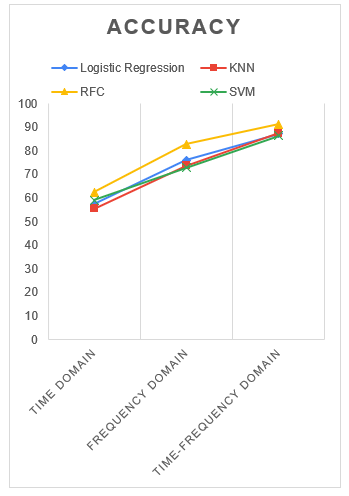 Figure 8: Comparison of accuracy metrics for four different classifiers
4.3. Choosing the best Scenario
The overall accuracy was considered as the reference metrics while finding out the best scenario, as it is difficult to compare different classifiers using several measures. The plots of the accuracy for four different classifiers corresponding to different domain are shown in the Figure 8 below. From the given figure, it is evident that the accuracy for random forest classifier is better than any other domains for all the four classifiers.
The accuracy plots also reveal the relative comparison among the time domain features, frequency domain features and the effect of the fusion of both time and frequency domain. It is evident that the frequency domain features perform better than the time domain features for all of the classifiers. Again, the time-frequency fusion outperforms the previous scenarios when the time or frequency domain feature were used individually. So, in the rest of the paper, the combined-time frequency domain features will be considered for further analysis.
4.4. Choosing the best classifier
The plots for the area under the ROC curve for the classifiers built using the time-frequency domain of EEG features are shown in the Figure 9 below. The figure illustrates that the RFC classifiers show the best compromise between sensitivity and specificity, with covering the highest area under the ROC curve (AUC= 0.92%).
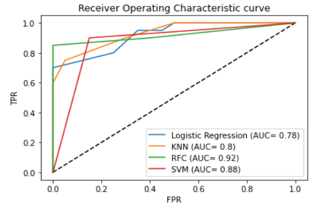 Figure 9: Comparison of AUC for four different classifiers for time-frequency domain
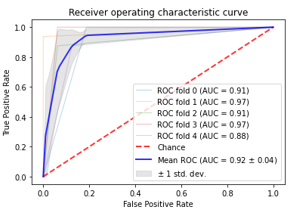 Figure 10: ROC Plots for time-frequency domain-based RFC model with 5-fold CV
Area under the AUC curve plots for 5 different experiments in 5-fold cross-validation with time frequency domain features using RFC classifier is shown in Figure 10. The AUC ranged from (0.78-0.92) for all the models with the time-frequency domain features, with a mean of 0.92 and 0.04 standard deviation. This signifies that the time-frequency domain shows an excellent performance than the other domains of EEG signal in tobacco smoking diagnosis.
5. Discussion
Four different classifiers were used in this study for assessing the performance of the EEG domains for the diagnosis of tobacco smoking. The results revealed that the time-frequency domain performs the best among the other domains. It also revealed that the maximum performance was obtained using the RFC Classifier, with a sensitivity, specificity and accuracy of 94.3%, 92.1% and 91.3%, respectively. Moreover, RFC based model time-frequency domain-based dataset shows promising AUC (0.92), which is a good compromise between sensitivity and specificity.
The finding of this study is consistent with some of the previous studies [1,7]. The study [7] achieved an accuracy ranged from 97.33-97.50%, while using the frequency domain features, such as, PSD and FFT features of EEG signal, which also supports the finding of the current study. Though the study of [7] used only RBF kernel based SVM, the current study validated the other classifiers which support the findings. In another study [1], where authors found the time-frequency domain as the best performing domain, though they have used only one classifier (ANN), and one performance metrics (Accuracy). Contrarily, the time domain performed the worst (RFC accuracy= 62.4%) in their study, while using a holdout approach for validation. The current study used a five-fold cross-validation and validated the outcome of the previous research with multiple classifiers.
Based on the results and analysis in the study, the following research implications and recommendations can be provided. First, using the frequency domain features is always recommended to diagnose tobacco smoking using the EEG signals. However, using time-frequency fusion is highly recommended as this combination provides a higher classification performance. Second, the given outcomes could be correlated with the drug-related impairment in the human brain, which could provide further insight into the correlation between the two addiction.
There are some feasibility issues with the study. First, using EEG sensors to detect the smoking habit could be a cumbersome procedure. However, the research could add value to observe the effect of different cigarettes depending upon their nicotine levels and their impact on the human brain. Second, the use of EEG as ground truth in tobacco-related experiments. If the setup is available in the lab, the EEG measurement could be used as ground truth when observing the effect of Tobaccos smoking on other factors. Third, the impact of drug addiction is more severe in the human brain than smoking. This experiment can add value to the relative comparison of the drug and tobacco addiction. However, the scope of the paper is not out of limitations. Inter-individual difference among participants is another factor, which is needed to be considered. As the paper represented a novel methodology of EEG based diagnosis of tobacco smoking, more research is required to find out the feasibility in real-world conditions as well.
6. Conclusion
To develop an EEG based diagnosis of tobacco addiction, an analysis was done in this study to find out the feasibility of the time and frequency domain features using this proposed model. Here, ultimate results were obtained after applying several steps- feature scaling, tuning of classifiers, and finally with five-fold cross-validation of the developed models. The research investigation found that the combination of the time-frequency domain features with RFC classifier showed the best accuracy while the time domain features showed the lowest accuracy. This analysis shows that time-frequency domain shows the best Accuracy with SVM (86.5 %), LR (87.2%), KNN (87.5%) and RFC (91.3%), Time-domain shows the lowest accuracy with all classifiers while the ffrequency domain shows higher accuracy than time domain, but still, this is less than the combined time-frequency domain performance. Among all the classifiers, RFC showed the best Accuracy and SVM showed the lowest accuracy. However, the experiment could be done on more number of participants to validate the model based on lave one participant out approach. Also, efficiency will increase with the addition of more EEG channels which could be considered for future implications.
Conflict of Interest
The authors declare no conflict of interest.
Acknowledgment
The authors want to thank the faculties, staff, and HDRs for providing the signal recording facilities at Biomedical Engineering Laboratory, KUET.
- M.M. Hasan, N. Hasan, A. Rahman, M.M. Rahman, “Effect of Smoking in EEG Pattern and Time-Frequency Domain Analysis for Smoker and Non-Smoker,” in 2019 International Conference on Computer, Communication, Chemical, Materials and Electronic Engineering (IC4ME2), IEEE: 1–4, 2019.
- C.N. Metz, P.K. Gregersen, A.K. Malhotra, “Metabolism and biochemical effects of nicotine for primary care providers,” Medical Clinics, 88(6), 1399–1413, 2004.
- R.C. O’reilly, Y. Munakata, Computational explorations in cognitive neuroscience: Understanding the mind by simulating the brain, MIT press, 2000.
- G. Cartocci, E. Modica, D. Rossi, A.G. Maglione, I. Venuti, G. Rossi, E. Corsi, F. Babiloni, “A pilot study on the neurometric evaluation of ‘effective’ and ‘ineffective’ antismoking public service announcements,” in 2016 38th Annual International Conference of the IEEE Engineering in Medicine and Biology Society (EMBC), IEEE: 4597–4600, 2016.
- Z.M. Hanafiah, K.F.M. Yunos, Z.H. Murat, M.N. Taib, S. Lias, “EEG brainwave pattern for smoking behaviour after horizontal rotation treatment,” in 2009 IEEE Student Conference on Research and Development (SCOReD), IEEE: 559–561, 2009.
- T. Warbrick, A. Mobascher, J. Brinkmeyer, F. Musso, T. Stoecker, N.J. Shah, G.R. Fink, G. Winterer, “Nicotine effects on brain function during a visual oddball task: a comparison between conventional and EEG-informed fMRI analysis,” Journal of Cognitive Neuroscience, 24(8), 1682–1694, 2012.
- L.C. Chin, A.M. Zazid, C.Y. Fook, V. Vijean, S.A. Awang, M. Affandi, L.S. Chee, “Differentiate Characteristic EEG Tobacco Smoking and Non-smoking,” in Journal of Physics: Conference Series, IOP Publishing: 12055, 2019, doi:10.1088/1742-6596/1372/1/012055.
- D. Acquisition, Analysis with BIOPAC MP Systems, AcqKnowledge 4 Software Guide. pdf, Biopac Systems, Inc. ISO 9001: 2008.
- N. Hasan, M.M. Hasan, M.A. Alim, “Design of EEG based wheel chair by using color stimuli and rhythm analysis,” in 2019 1st International Conference on Advances in Science, Engineering and Robotics Technology (ICASERT), IEEE: 1–4, 2019, doi:10.1109/ICASERT.2019.8934493.
- M.M. Hasan, M.H.A. Sohag, M.E. Ali, M. Ahmad, “Estimation of the most effective rhythm for human identification using EEG signal,” in 2016 9th International Conference on Electrical and Computer Engineering (ICECE), IEEE: 90–93, 2016, doi:10.1109/ICECE.2016.7853863.
- M.M. Hasan, M. AshfaqulIslam, S.A. Imtiyaz, M. MahbubHasan, “Presumption method for detecting and analyzing human mental behavior by employing EEG signal,” in 2018 4th International Conference on Electrical Engineering and Information & Communication Technology (iCEEiCT), IEEE: 519–523, 2018.
- M. Wester, W. McMullen, A. Macy, “Biopac Student Lab Pro, Hardware and Software Reference Manual, ver. 2.1, BioPac Systems,” Inc., Santa Barbara, CA.[Accessed on 26 April 2018], 1997.
- B.B. flow Monitor, Biopac Systems, Inc. ISO 9001: 2000.
- C. Colantuoni, G. Henry, S. Zeger, J. Pevsner, “SNOMAD (Standardization and NOrmalization of MicroArray Data): web-accessible gene expression data analysis,” Bioinformatics, 18(11), 1540–1541, 2002, doi:https://doi.org/10.1093/bioinformatics/18.11.1540.
- F. Pedregosa, G. Varoquaux, A. Gramfort, V. Michel, B. Thirion, O. Grisel, M. Blondel, P. Prettenhofer, R. Weiss, V. Dubourg, “Scikit-learn: Machine learning in Python,” The Journal of Machine Learning Research, 12, 2825–2830, 2011.
- F. Riaz, A. Hassan, S. Rehman, I.K. Niazi, K. Dremstrup, “EMD-based temporal and spectral features for the classification of EEG signals using supervised learning,” IEEE Transactions on Neural Systems and Rehabilitation Engineering, 24(1), 28–35, 2015, doi:10.1109/TNSRE.2015.2441835.
- S. Bhattacharyya, A. Khasnobish, S. Chatterjee, A. Konar, D.N. Tibarewala, “Performance analysis of LDA, QDA and KNN algorithms in left-right limb movement classification from EEG data,” in 2010 International conference on systems in medicine and biology, IEEE: 126–131, 2010.
- H. Lee, S. Choi, “Pca+ hmm+ svm for eeg pattern classification,” in Seventh International Symposium on Signal Processing and Its Applications, 2003. Proceedings., IEEE: 541–544, 2003.
- L. Fraiwan, K. Lweesy, N. Khasawneh, H. Wenz, H. Dickhaus, “Automated sleep stage identification system based on time–frequency analysis of a single EEG channel and random forest classifier,” Computer Methods and Programs in Biomedicine, 108(1), 10–19, 2012, doi:https://doi.org/10.1016/j.cmpb.2011.11.005.
- J. Kim, J. Lee, C. Lee, E. Park, J. Kim, H. Kim, J. Lee, H. Jeong, “Optimal feature selection for pedestrian detection based on logistic regression analysis,” in 2013 IEEE International Conference on Systems, Man, and Cybernetics, IEEE: 239–242, 2013.
- H. Rajaguru, S.K. Prabhakar, “Non linear ICA and logistic regression for classification of epilepsy from EEG signals,” in 2017 international conference of electronics, communication and aerospace technology (ICECA), IEEE: 577–580, 2017.
- K. AlSharabi, S. Ibrahim, R. Djemal, A. Alsuwailem, “A DWT-entropy-ANN based architecture for epilepsy diagnosis using EEG signals,” in 2016 2nd International Conference on Advanced Technologies for Signal and Image Processing (ATSIP), IEEE: 288–291, 2016, doi:10.1109/ATSIP.2016.7523093.
- W. Zhu, N. Zeng, N. Wang, “Sensitivity, specificity, accuracy, associated confidence interval and ROC analysis with practical SAS implementations,” NESUG Proceedings: Health Care and Life Sciences, Baltimore, Maryland, 19, 67, 2010.
- A.M. Šimundić, “Measures of diagnostic accuracy: basic definitions,” Medical and Biological Sciences, 22(4), 61, 2008.
- D. Justin, R.S. Concepcion, A.A. Bandala, E.P. Dadios, “Performance Comparison of Classification Algorithms for Diagnosing Chronic Kidney Disease,” in 2019 IEEE 11th International Conference on Humanoid, Nanotechnology, Information Technology, Communication and Control, Environment, and Management (HNICEM), IEEE: 1–7, doi:10.1109/HNICEM48295.2019.9073568.