Model of Fish Cannery Supply Chain Integrating Environmental Constraints (AHP and TOPSIS)
Volume 6, Issue 1, Page No 798-809, 2021
Author’s Name: Sana Elhidaoui1,2,a), Khalid Benhida1, Said Elfezazi1, Yassine Azougagh1, Abdellatif Benabdelhafid3
View Affiliations
1LAPSSII, EST of Safi, Cadi Ayyad University, 46000, Morocco
2DCS: Engineering Sciences, faculty of science and technology, Cadi Ayyad University Marrakesh, 40000, Morocco
3Universiapolis, Agadir, 80000, Morocco, & Le Havre Normandy University, France
a)Author to whom correspondence should be addressed. E-mail: sanaelhidaoui@gmail.com
Adv. Sci. Technol. Eng. Syst. J. 6(1), 798-809 (2021); ![]() DOI: 10.25046/aj060189
DOI: 10.25046/aj060189
Keywords: Environmental impacts, Green supply chain, Modeling, Fish cannery, AHP, TOPSIS

Export Citations
This paper proposes a modeling framework (analytical modeling) for the case of fish cannery supply chain (FCSC) to optimize the environmental impact of the set of its processes; indeed, for our knowledge, there were few studies attempting to address this case study as a model of green supply chain. Implementation of the proposed model is done using first MCDM methods (AHP, TOPSIS) in order to select and classify processes and the corresponding environmental impact, as well as dealing with environmental analysis. Furthermore; a flowchart is proposed as an addition to improve the other processes in terms of reducing environmental impact, and the numerical resolution is carried out using the LINDO software. The proposed framework will guide researcher both as well as practitioners in establishing an optimal model for the green fish cannery supply chain (FCSC).
Received: 14 December 2020, Accepted: 13 January 2021, Published Online: 05 February 2021
1.Introduction
In logistic field, most of researchers aim to meet the challenge of integrating new scientific data in terms of methods, software, managerial solution, to support supply decision making, furthermore environmental dimension is among the most attractive area of study to deal with. Nowadays, a set of supply chain (SC) models have been proposed in the literature, integrating the environmental dimension, using various modeling tools and methods [1]-[4]. Mainly; this paper proposes a modeling framework of the fish cannery supply chain (FCSC), by integrating the environmental constraints and it contributes in helping and assisting researchers, as well as practitioners to establish a global model of the green fish cannery supply chain (FCSC), where few articles seek to tackle modeling studies in this area of study, particularly as an industrial supply chain [5]-[7], followed by a numerical resolution using the LINGO software. The remainder of the paper starts with a relevant literature review, which typically tackle the cannery fish supply chain (FCSC), and the main keywords in section 2.
And subsequent to a detailed description of the case study in Section 3. The model formalization and discussion are addressed in Section 4. Section 5 provides the numerical resolution, while Section 6 addresses the conclusion, limitations and future research direction.
2. Literature Review
2.1. Fish cannery supply chain
The Agri-food industry, in particular the fish cannery industry, is chosen as a case study. Generally, there are many kinds of fish, such as sardines and mackerel, which are among the most consumed fish in the Mediterranean region [8]; While in tropical and subtropical oceans, western and central pacific ocean (in particular Asian country) tuna is the most common cannery industry, Southeast Alaska and Puget Sound, Washington State, USA are known by salmon fish etc. One must bear in mind the time constraint since this industry is almost seasonal, operation is limited to about 3 months in a year for salmon [7], and up to 9 months/year for the other types. In this case study objectives are established as to demonstrate the applicability of the model whatever the purposes, and to visualize its added value on the one hand, by treating a case of an area rarely addressed in research as an industrial SC.
The environmental constraints or impact resulting from this type of industry is treated separately from its modeling. Among the most significant and widespread environmental impact of this industry: water pollution, or wastewater [9]-[11], waste fish [7], most of research works that deal with this impact propose solutions to minimize it. On the other hand, fish processing waste has an interesting energy value. The increase of the aforementioned wastes as well as the increasing of the renewable energy market confirms that this waste could have a place as a future source of biofuels [12].
Furthermore; and for our knowledge, there is no standard model for this type of industry as a whole SC case study. In [6] the authors have dealt with the fish cannery industry, notably the case of tuna, under a model that encompasses multiple fishing fleets including canneries, in the form of scenarios by exploiting the future results of the world tuna fishery through a simple presentation: climate change effects, changes in global tuna demand, and changes in access to fishing areas. Also an optimization, mathematical model is reported by authors of [7], which aims to optimize food portion in packaging, actually the model is presented in a case study of a cannery portion of fish. We notice well that these two examples consist in treating this type of SC in the manner that the raw material is of exhaustible nature (in the biological way also), which strongly supports the scarcity of research works dealing with a global model of the green industrial SC (including all environmental impact), particularly the proposed case study.
2.2. MCDM method: AHP and TOPSIS
MCDM (Multi-Criteria Decision Making) gathers a set of sophisticated methodological tools to assist in decision making to cope with complex decisions. It is a powerful method for evaluating and ranking one or more customized solution from a set of options that consider multiple indicators, which are typically contradictory. In particular, it allows us to highlight conflicts within the metric indicators, to identify an effective and structured framework and, finally, to make the holistic trade-offs necessary to reach a decision”[13].
AHP (Analytic hierarchy process) method is among the MCDM tools, to hierarchize criteria in order to achieve a specific goal, where scores of all criteria are grouped into a unique aggregate score. In literature, there is a considerable amount of research work that has used the AHP method either to evaluate performance of the green SC [14], [15] and for ranking the key performance indicators [16], also for assessment of the sustainability of the SC [17], or for the risk assessment [18], [19], commonly AHP is well-known for supplier selection [20]-[22], also it’s applied in reverse logistics.
TOPSIS (technique for order preference by similarity ideal solution) has been proposed for the first time by [23]. TOPSIS is an effective method to solve existing problems of multi-attribute decision making with finite alternatives. The concept of this method is to classify the alternatives by calculating the distance of each alternative in relation to the ideal solution and the ideal negative solution of the problems in order to determine the optimal alternative. These ideal and negative-ideal solutions are calculated in considering other alternatives [24].
Most of papers utilized both AHP followed by TOPSIS which is preferred in comparison, [25]. In [26], authors applied the robust Analytical Hierarchy Process (AHP)-Fuzzy and TOPSIS for the evaluation and selection of contractors [27] the Fuzzy Analytical Hierarchy Process (FAHP) and (TOPSIS) is used to evaluate performance, and particularly in the selection of reverse logistics service [28]. In notably, this paper exclusively applies these two methods for the classification of processes and their environmental impacts.
In the following paragraph, a model of the (FCSC) is presented. Furthermore, the two methods: AHP and TOPSIS would be used, in order to classify the environmental impacts and the SC’s processes.
3. Case study
This section presents a case study of the fish cannery industry, this option of industry is exclusively treated as a SC model in this paper in addition most of the research works focus on the biological aspect in studying this case study. Data is collected from 4 anonymous companies of the fish cannery industry in the same city in Morocco, preserving all the needed information, with the aim to establish a model of green (FCSC), which may help industrialists in this field, in the one hand, and researchers in the future, in the other hand, by providing a global framework of green SC modeling. Therefore, this type of industry is characterized by a set of activities from fish procurement to distribution.
After a five-month visit to the four companies, we have collected data related to each process of this SC, these processes may change in terms of appointment from one company to another, but the activities remain the same. Reception of raw materials from suppliers (different) and distribution of final product to a limited number of destinations (clients, retailers…). These companies use only Small fish species such as sardines. The set of processes is presented in fig.1 below, we opted for this organizational chart in order to highlight the objective of this paper, namely to meet the optimization of environmental constraints in SC modeling. Particularly, the fig.1 below shows the impact of waste water at all levels (till the process of cooling):
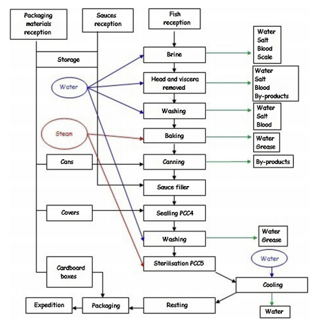 Figure 1: Fish canning industry supply chain (flow chart) [10]
3.1. Description
Hereafter a detailed description of the SC’s characteristics, and the common elements between the four companies, all these data could be used in the resolution of the models, and to establish an action plan (improvement). In the next sections collected data are also used in AHP and TOPSIS (Water consumption, energy consumption, noise …).
Table 1: Case study data collection
| Time sheet | – The delivery of final products and raw materials is done by a limited number of paths, and runs constantly 24h/24h
-The plant works 8 hours a day, 6 days a week (8h/24h normal, 6d/7d) |
| Production site and platform | -Each company is composed of 2 production sites (only one site works when the total quantity doesn’t exceed 8tonnes) -A physical systems for receiving the raw material from the logistics platform |
| Procurement | – Procurement of the fish quantity varies between 2 trucks to 4 trucks, each of which has a maximum capacity of 12 tonnes (minimum 4 tonnes). |
| Water and energy consumption | – The average monthly water consumption is 1400 m³
-Electrical energy(Total consumption per tonne): 86Kw/tonne |
| Processes | -10 processes (as shown in fig.1) only are taken into account |
| Raw materials | -Fish, brine and spices, oil, boxes, cartons, tomato sauce, detergents, coal, lead (for marking)
-Total quantity of raw material (fish): [8tones, 48tones] |
3.2. Material and Method
This type of SC promotes mathematical modeling, given the nature of its well-defined and flexible activities to model them mathematically. As evoked at the beginning of this paper, the analytical modeling has opted for, by proposing a mathematical model to an objective function which minimizes the environmental impacts, and helps in decision making, regarding the actions to be undertaken. For the mathematical model, only impacts whose parameters can be used in mathematical modeling are retained. In addition, for the identification of the significant impact, the TOPSIS method is used in order to hierarchize processes according to their criticality regarding environmental impacts as to classify them from the worst alternative, also by further using the AHP method to classify the different environmental impacts and then using this ranking in TOPSIS method.
3.3. Identification of environmental Constraints
The environmental analysis presents a set of steps to be followed, to achieve a set of aspects, and significant impacts, of the different processes or activities of the SC. In addition the environmental analysis is required by ISO14001 standard, but it is indeed an optional direction. In this case study, we are interested in tackling, the most relevant significant impact regarding the critical activities or processes, and as we have previously mentioned, we opted for the AHP and TOPSIS methods which allows us to inherit the desired criteria, in a fuzzy environment to assist in the selection of processes and environmental impact.
Our main goal from AHP method is to classify criteria according to their criteria weight, the criteria adopted, according to the companies’ experts of our case study, are the most relevant to prioritize in order to conduct a study of the most significant environmental impacts, namely: water consumption, energy consumption, noise, effluent discharge, air pollution, and then the ranking result are further used in TOPSIS, which is chosen to rate and compare processes alternatives in a fuzzy environment, to be taken into account in our modeling.
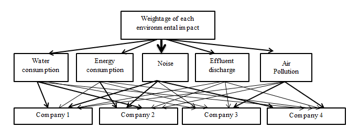 Figure 2: The structure of AHP method
3.4. AHP Method
A hierarchical structure is constructed using five criteria and four alternatives through the literature review and taking opinions from the four experts from each company. In order to achieve the main goal (namely: weight of the selected environmental impacts).
The pairwise comparison matrix determines the relative importance (table 2) of different attributes or criteria with respect to the goal, in table 3 below:
Table 2: Scale of relative importance
| 1 | Equal importance |
| 3 | Moderate importance |
| 5 | strong importance |
| 7 | Very strong importance |
| 9 | Extreme importance |
| 2,4,6,8 | Intermediate value |
| 1/3, 1/5, 1/7, 1/9 | Value for inverse comparison |
The normalized pair-wise matrix is elaborated in table 4. The new pair-wise matrix as shown below in table 5 is established by calculating the weighted sum value and each criterion weight with its rate:
Table 3: Pair-wise comparison matrix
| Water
consumption |
Energy
consumption |
Noise
|
Effluent
discharge |
Air
pollution |
|
| Water consumption | 1 | 1 /2 | 7 | 2 | 5 |
| Energy consumption | 2 | 1 | 5 | 2 | 5 |
| Noise
|
1/7 | 1/5 | 1 | 1/5 | 1/3 |
| Effluent discharge | 1 /2 | 1 /2 | 5 | 1 | 3 |
| Air pollution | 1/5 | 1/5 | 3 | 1/3 | 1 |
| Sum | 3.84 | 2.4 | 21 | 5.53 | 14.33 |
Table 4: Normalized pair-wise matrix
| Water consumption | Energy consumption | Noise
|
Effluent discharge | Air pollution | Criteria weight | |
| Water consumption | 0.26 | 0.21 | 0.33 | 0.362 | 0.35 |
0.3024 |
| Energy consumption | 0.53 | 0.416 | 0.24 | 0.362 | 0.35 | 0.38
|
| Noise
|
0.04 | 0.083 | 0.05 | 0.04 | 0.023 | 0.05 |
| Effluent discharge | 0.053 | 0.21 | 0.24 | 0.2 | 0.21 | 0.183 |
| Air pollution | 0.052 | 0.083 | 0.143 | 0.06 | 0.07 | 0.082 |
| Sum | 3.84 | 2.4 | 21 | 5.53 | 14.33 |
Table 5: New pair-wise matrix (non-normalized)
| Water consumption | Energy consumption | Noise
|
Effluent discharge | Air pollution | Weighetd Sum Value | Criteria weight | Rate | |
| Water consumption | 0.302 | 0.19 | 0.35 | 0.366 | 0.41 | 1.62 |
0.3024 |
5.36 |
| Energy consumption | 0.604 | 0.38
|
0.25 | 0.366 | 0.41 | 2.01 | 0.38
|
5.29 |
| Noise
|
0.043 | 0.08 | 0.05 | 0.0366 | 0.03 | 0.21 | 0.05 | 4.2 |
| Effluent discharge | 0.151 | 0.2 | 0.25 | 0.183 | 0.25 | 1.034 | 0.183 | 5.65 |
| Air pollution | 0.06 | 0.08 | 0.15 | 0.06 | 0.082 | 0.432 | 0.082 | 5.27 |
Table 6: Standard of RI
| N | 1 | 2 | 3 | 4 | 5 | 6 | 7 | 8 | 9 | 10 |
| RI | 0.00 | 0.00 | 0.58 | 0.90 | 1.12 | 1.24 | 1.32 | 1.41 | 1.45 | 1.49 |
The relative weights are given by the eigenvector (w) corresponding to the maximum eigenvalue ( λmax), such as :
λmax=(5.36+5.29+4.2+5.65+5.27)/5= 5.154
A consistency index (CI) is calculated. Equation (1) describes the formula for the coherence index. The consistency ratio (CR) is calculated. Indeed, the CR allows checking if the evaluations are consistent or not. The CR can be determined by taking the ratio of the CI and the random index (RI).
Consistency index (C.I.)
( λmax –n)/(n-1)
C.I=(5.154-5)/(5-1)=0.04
Consistency Ratio
C.I/ RI=0.04/1.12=0.034 <0.10 => so our matrix is reasonably consistent
Table 7 presents the result of criteria ranking:
3.5. TOPSIS Method
Define abbreviations and acronyms the first time they are used in the text, even after they have been defined in the abstract. Do not use abbreviations in the title or heads unless they are unavoidable. The TOPSIS method is used to classify (rate) processes according to the selected environmental impact, then to use them in the model formalization, for this case study only some environmental impacts are used in mathematical modeling, regarding priorities given by experts.
Table 7: Criteria ranking
| Criteria | Criteria weights | Rank |
| Water consumption | 0.3024 | 2 |
| Energy consumption | 0.38 | 1 |
| Noise | 0.05 | 5 |
| Effluent discharge | 0.183 | 3 |
| Air pollution | 0.082 | 4 |
Table 8: Selection of the best
| Alternatives | Attribute/criteria | Water consumption m3/tone |
Energy consumption(l/tone; Kw/ton) | Noise | Effluent discharge | Air pollution | |
| Transportation and reception | 0,002 | 14,82 | 62 | 3 | 5 | ||
| Brine process | 1,600 | 20 | 66 | 4 | 2 | ||
| Head and viscera removed process | 0,71 | 12 | 64 | 5 | 2 | ||
| Washing | 1,8 | 12 | 65 | 4 | 2 | ||
| Baking | 2,68 | 22,22 | 92 | 5 | 5 | ||
| Canning | 0,04 | 5 | 89 | 3 | 2 | ||
| Sauce filler | 0,01 | 4,22 | 67 | 3 | 3 | ||
| Sealing PCC4 | 0,001 | 6,40 | 88 | 3 | 2 | ||
| Washing | 0,48 | 6 | 89 | 4 | 2 | ||
| Sterilization | 0,27 | 7 | 65 | 3 | 3 | ||
| Cooling process | 0,003 | 16 | 64 | 2 | 4 | ||
| Packaging | 0,001 | 6 | 62 | 4 | 2 | ||
| 3,7137 | 43,1524 | 255,0931 | 12,7671 | 10,5830 |
The transformation of units among various criteria into common measurable units to allow comparisons between criteria. Then, the normalized values of the alternatives are determined X_ij is the numerical score of alternative j on criterion i. The corresponding normalized value is defined as follows :
![]() Table 9: Non measurable criteria scale
Table 9: Non measurable criteria scale
| Point scale | |
| Low | 1 |
| Below average | 2 |
| Average | 3 |
| Big | 4 |
| Very big | 5 |
![]() The weighted normalized decision matrix vij can be calculated by multiplying the normalized evaluation matrix by its associated weight wi to obtain the result:
The weighted normalized decision matrix vij can be calculated by multiplying the normalized evaluation matrix by its associated weight wi to obtain the result:
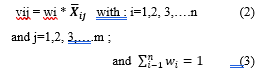 Table 10: Normalized decision matrix
| Attribute/ criteria |
Water consumption m3/tone |
Energy consumption (l/tone; Kw/ton) |
Noise | Effluent discharge |
Air pollution |
| Transportation and reception | 0,0005 | 0,3434 | 0,2430 | 0,2350 | 0,4725 |
| Brine process | 0,4308 | 0,4635 | 0,2587 | 0,3133 | 0,1890 |
| Head and viscera removed process | 0,1912 | 0,2781 | 0,2509 | 0,3916 | 0,1890 |
| Washing | 0,4847 | 0,2781 | 0,2548 | 0,3133 | 0,1890 |
| Baking | 0,7217 | 0,5149 | 0,3607 | 0,3916 | 0,4725 |
| Canning | 0,0108 | 0,1159 | 0,3489 | 0,2350 | 0,1890 |
| Sauce filler | 0,0027 | 0,0978 | 0,2626 | 0,2350 | 0,2835 |
| Sealing PCC4 | 0,0003 | 0,1483 | 0,3450 | 0,2350 | 0,1890 |
| Washing | 0,1293 | 0,1390 | 0,3469 | 0,3133 | 0,1890 |
| Sterilization | 0,0727 | 0,1622 | 0,2548 | 0,2350 | 0,2835 |
| Cooling process | 0,0008 | 0,3708 | 0,2489 | 0,1567 | 0,3780 |
| Packaging | 0,0003 | 0,1390 | 0,2430 | 0,3133 | 0,1890 |
Table 11: Weighted Normalized decision matrix
| Weightage | 0,3024 | 0,38 | 0,05 | 0,183 | 0,082 | |||
| Attribute/ criteria |
Water consumption m3/tone |
Energy consumption (l/tone; Kw/ton) |
Noise | Effluent
discharge |
Air pollution | |||
| Transportation and reception | 0,000163 | 0,131 | 0,012 | 0,043 | 0,039 | 0,097 | 0,229 | 0,702 |
| Brine process | 0,130285 | 0,176 | 0,013 | 0,057 | 0,015 | 0,193 | 0,094 | 0,329 |
| Head and viscera removed process | 0,057814 | 0,106 | 0,013 | 0,072 | 0,015 | 0,099 | 0,185 | 0,651 |
| Washing | 0,146571 | 0,106 | 0,013 | 0,057 | 0,015 | 0,164 | 0,118 | 0,419 |
| Baking | 0,218228 | 0,196 | 0,018 | 0,072 | 0,039 | 0,274 | 0,000 | 0,000 |
| Canning | 0,003257 | 0,044 | 0,017 | 0,043 | 0,015 | 0,017 | 0,266 | 0,940 |
| Sauce filler | 0,000814 | 0,037 | 0,013 | 0,043 | 0,023 | 0,016 | 0,271 | 0,943 |
| Sealing PCC4 | 0,000081 | 0,056 | 0,017 | 0,043 | 0,015 | 0,024 | 0,261 | 0,914 |
| Washing | 0,039086 | 0,053 | 0,017 | 0,057 | 0,015 | 0,051 | 0,231 | 0,819 |
| Sterilization | 0,021986 | 0,062 | 0,013 | 0,043 | 0,023 | 0,037 | 0,240 | 0,867 |
| Cooling process | 0,000244 | 0,141 | 0,012 | 0,029 | 0,031 | 0,105 | 0,229 | 0,686 |
| Packaging | 0,000081 | 0,053 | 0,012 | 0,057 | 0,015 | 0,033 | 0,262 | 0,889 |
| 0,000081 | 0,037 | 0,012 | 0,029 | 0,015 |
|
|||
| 0,218228 | 0,196 | 0,018 | 0,072 | 0,039 |
|
|||
Ideal best value: correspond to the minimum value (because we are interested in minimizing impact)
Ideal worst value: correspond to the maximum value (because we are not interested in maximizing impact)
Euclidean distance from ideal best and worst:
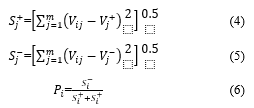 For the P_j must be ranked in ascending order, as long as our goal is to classify the most activities that generate more environmental impacts. A set of alternatives can then be ranked in order of preference in descending order of .
Table 12: Criteria (processes) ranking
| Attribute/ criteria |
Rank |
|||
| Transportation and reception | 0,097 | 0,229 | 0,702 | 6 |
| Brine process | 0,193 | 0,094 | 0,329 | 2 |
| Head and viscera removed process | 0,099 | 0,185 | 0,651 | 4 |
| Washing | 0,164 | 0,118 | 0,419 | 3 |
| Baking | 0,274 | 0,000 | 0,000 | 1 |
| Canning | 0,017 | 0,266 | 0,940 | 11 |
| Sauce filler | 0,016 | 0,271 | 0,943 | 12 |
| Sealing PCC4 | 0,024 | 0,261 | 0,914 | 10 |
| Washing | 0,051 | 0,231 | 0,819 | 7 |
| Sterilization | 0,037 | 0,240 | 0,867 | 8 |
| Cooling process | 0,105 | 0,229 | 0,686 | 5 |
| Packaging | 0,033 | 0,262 | 0,889 | 9 |
Based on the results of the TOPSIS method, “baking” is identified as the most critical process to be considered in the modeling. The table 13 below contains the set of significant aspect and related significant impacts, according to each selected process, this study is carried out, with the help of expert panel:
Table 13: Significant aspects and impacts
| Activities | Aspects | Impacts |
| Baking | -Water consumption
-Energy consumption(coal) -Emission of gaseous pollutants (greenhouse gases, CO2 … etc.) -Noise – Liquids or solid wastes -Coal splinters |
-Wastewater
-Consumption of non-renewable energy -Noise pollution -Pollution of ambient air- Destruction of the ozone layer, and global warming – Flow towards the natural environment |
| Brine process | -Water consumption
-Energy consumption(electricity) – Liquids or solid wastes -Accidental spills |
-wastewater
-Exhaustion of non-renewable energies -Pollution of ambient air |
| Washing | -Water consumption
-Energy consumption ( electricity) -Noise |
-Wastewater (Water stress )and water pollution
-Contamination of ground, and water surface.-Noise pollution -Exhaustion of non-renewable energies |
| Head and viscera removed process | – Liquids or solid wastes
-The raw material splinters -Energy consumption ( electricity) -Water consumption |
– Contamination of ground, and water surface.-Exhaustion of non-renewable energies-Wastewater (Water stress )and water pollution |
| Cooling process | -Use of refrigerant gases
-Air pollution -Energy consumption ( electricity) -Water consumption -Noise |
-Using the product generated from persistent waste in the environment.
-Wastewater -Noise pollution -Exhaustion of non-renewable energies |
| Transportation reception | -Emission of gaseous pollutants (greenhouse gases, CO2 exhaust gases, etc.)
-Consumption of fuels -Possibility of accidental dispersion -Atmospheric emissions due to fuel combustion |
– Destruction of the ozone layer, and global warming
-Exhaustion of non-renewable energies – Damage for people -Atmospheric pollution -Contamination of soil, surface water. -Pollution of ambient air |
| Sterilization | -Energy consumption ( electricity)
-Emission of gaseous pollutants (greenhouse gases, CO2 exhaust gases, etc.) -Noise -Water consumption |
-Exhaustion of non-renewable energies
-Destruction of the ozone layer, and global warming -Noise pollution -Wastewater
|
| Sealing PCC4 | -Energy consumption ( electricity)
-Possibility of accidental dispersion -Noise |
-Exhaustion of non-renewable energies
-Contamination of soil, surface water. -Noise pollution |
| Canning | -Energy consumption ( electricity)
-Noise – Liquids or solid wastes |
-Exhaustion of non-renewable energies
-Noise pollution – Contamination of ground, and water surface. |
| Sauce filler | -Energy consumption ( electricity)
-The raw material splinters -Noise |
-Exhaustion of non-renewable energies
-Contamination of ground -Noise pollution |
4. The model Formalization
In the model formalization phase, and after selecting the method/tool to be applied, as well as the identification of the significant impacts, all the model elements are presented below:
Hypothesis and constraints
-Non-regularity of procurement
-Persistence of the raw material
Sets
J: Set of processes j of the SC.
I: Total energy consumption (type)
Parameters
– : Water consumption in process j.
– : Processing time of the quantity Qj of raw material (product) used in process j.
– : Electrical energy consumption in process j.
– : Energy (fuel) consumed in process j.
Decision Variables
– : Quantity of raw material (product) used in process j.
Data
– : Total energy (fuel oil) consumed (l/tone).
– : Total electrical energy consumed (kw/tone).
– : Total quantity of water consumed (m3/tone).
– : Total amount of raw material per day.
–n0 : The number of baking ovens available at the plant.
–Q0 : Maximum amount of raw material to be baked in n0 oven.
–Pj: Percentage of water consumption of process water j.
– D: Total processing time of Qj from raw material to final product
Objective Function
For environmental impact of noise and effluent discharge, a set of actions is proposed to improve and to optimize theses impacts in Fig.3 below. Hereafter the objective function “(1)” that minimizes the environmental impact of the selected processes, by taking into account various variables as the quantity of raw material, etc.
NB: The environmental impact of water consumption, in transport and reception process, is excluded due to the negligible volume of water consumed during this process.
![]() Constraints
Constraints
- Constraint of electrical energy consumption
 Constraint of maximum quantity to be processed in the baking process:
 Water consumption percentage constraint for all processes j:
![]()
- Water consumption constraint for all processes j :
![]()
- Constraint of energy consumption of transport and baking processes (fuel oil):
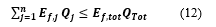 Constraint on the total quantity of raw material to be processed Qj:
![]()
- Constraint of the total processing time from raw material Qj to finished product:
![]()
The objective function (1) maximizes the amount Qj of raw material to be transformed during each of the six processes in order to minimize the energy consumed and the amount of water consumed. Constraints (2) and (6) ensure that the energy consumed by each process for the transformation of the quantity Qj of raw material versus the total energy consumed is satisfied. Constraint (3) limits the available backing capacity. Constraints (4), (5) determine respectively the percentage and quantity of water consumed for each process j. Constraints (7) and (8) determine respectively the total daily quantity and the processing time.
The proposed model is a mathematical linear programming model whose objective function is to minimize the following environmental impact: Energy and water consumption. All parameters, data and decision variables may be adjusted according to the studied SC; it is also conceivable to include other constraints. Indeed, the proposed model is quite streamlined and has not addressed all potential conditions or assumptions. The flow chart in fig.3 below is designed as an improvement action to monitor all environmental impacts, in particular noise, and effluents discharge. In the next section, a numerical resolution of this model is proposed.
5. Numerical resolution
The numerical resolution is performed using the LINGO software (from LINDO SYSTEM INC).Data: (for the transformation of the quantity QJ of the raw material.
Table 14: Numerical data of the studied supply chain
| Processes | J | Processing time of one tone of raw material (min) | Energy (electric, fuel oil) consumed (kw/tone, l/tone) | % of water consumption | Water consumption (m3/tone) |
| Baking | 1 | 67 | 22.22 | 0.3 | 2.68 |
| Brine process | 2 | 60 | 20 | 0.2 | 1.6 |
| Washning | 3 | 15 | 6 | 0.8 | 0.48 |
| Head and viscera removed process | 4
|
60 | 12 | – | – |
| Cooling process | 5
|
120 | 16 | – | – |
| Transport and reception | 6 | 10 | 14.84 | – | – |
 Figure 3:flow chart for the monitoring of the environmental impacts
The objective function :
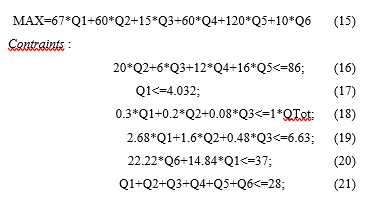 The objective of this section is to present the application of our mathematical model, by proposing numerical examples. The problem is solved by LINGO 18, on a computer with 1.83 GHz and 2 GB RAM:
Global optimal solution found.
Objective value: 810.8794
Infeasibilities: 0.000000
Total solver iterations: 4
Elapsed runtime seconds: 1.16
For the values of Qj:
Variable Value Reduced Cost
Q1 2.473881 0.000000
Q5 5.375000 0.000000
We notice that the optimal quantity (to reduce water and energy consumption) of the raw material or semi-finished product in the baking process is: Q1=2.473881tone, for the duration of 67min, and for the cooling process Q5=5.375000 tone for the duration of 120 min (2h).
6. Conclusion
The research on green SC modeling has been flourishing, in recent years, but continues to require more and more in-depth research for future studies. Nevertheless, when it comes to academicians, and industrialists, the aim of achieving an optimal model of the green supply chain is very challenging to decide which methods or tools are suitable. On the one hand, this paper provides a theoretical contribution to the body of literature, to our knowledge, there is virtually no model of the (FCSC) that takes into account all environmental impacts. In the other hand, it has some managerial implications, the proposed model can be deployed by supply chain managers, as it demonstrated in the case of fish cannery, and also the result of implementation of this model on this case study can be exploited in other fields of application.
The paper starts with literature review of the main terminology such as the (FCSC). Next, it invests in a case study which is less often dealt with as a whole supply chain, namely the case of a fish cannery, where the paper further uses relevant methods in doing so, like AHP and TOPSIS.
Moreover, the proposed mathematical model aims to minimize the identified significant impacts, and as for some directions of future research, it would be interesting to deal with other software for the model resolution, even further to include the social and economic hypotheses in order to address the whole sustainable (FCSC) modeling. The proposed framework may also serve as a preliminary approach for modeling the green supply chains regardless of their nature.
- A.J.C. Trappey, C. V. Trappey, C.T. Hsiao, J.J.R. Ou, C.T. Chang, “System dynamics modelling of product carbon footprint life cycles for collaborative green supply chains,” International Journal of Computer Integrated Manufacturing, 25(10), 934–945, 2012, doi:10.1080/0951192X.2011.593304.
- F. Gautier, P. Lacomme, P. Pariente, S.K. Tchomte, N. Tchernev, “Linear model for supply chain operational planning and carbon footprint optimization,” Supply Chain Forum, 14(2), 40–53, 2013, doi:10.1080/16258312.2013.11517314.
- Ole Ottemöller, “Modelling Change in Supply Chain Structures and its Effect on Freight Transport Demand,” Schriftenreihe Des Instituts Für Verkehr, 38(April 2017), 2017.
- W. Guo, Q. Tian, Z. Jiang, H. Wang, “A graph-based cost model for supply chain reconfiguration,” Journal of Manufacturing Systems, 48(March), 55–63, 2018, doi:10.1016/j.jmsy.2018.04.015.
- S. Tabrizi, S.H. Ghodsypour, A. Ahmadi, “Modelling three-echelon warm-water fish supply chain: A bi-level optimization approach under Nash–Cournot equilibrium,” Applied Soft Computing Journal, 71, 1035–1053, 2018, doi:10.1016/j.asoc.2017.10.009.
- C. Mullon, P. Guillotreau, E.D. Galbraith, J. Fortilus, C. Chaboud, L. Bopp, O. Aumont, D. Kaplan, “Exploring future scenarios for the global supply chain of tuna,” Deep-Sea Research Part II: Topical Studies in Oceanography, 140, 251–267, 2017, doi:10.1016/j.dsr2.2016.08.004.
- F.K. Omar, C.W. De Silva, “Optimal portion control of natural objects with application in automated cannery processing of fish,” Journal of Food Engineering, 46(1), 31–41, 2000, doi:10.1016/S0260-8774(00)00068-6.
- V. Ferraro, A.P. Carvalho, C. Piccirillo, M.M. Santos, P.M. Paula, M. E. Pintado, “Extraction of high added value biological compounds from sardine, sardine-type fish and mackerel canning residues – A review,” Materials Science and Engineering C, 33(6), 3111–3120, 2013, doi:10.1016/j.msec.2013.04.003.
- P. Chowdhury, T. Viraraghavan, A. Srinivasan, “Biological treatment processes for fish processing wastewater – A review,” Bioresource Technology, 101(2), 439–449, 2010, doi:10.1016/j.biortech.2009.08.065.
- R.O. Cristóvão, V.M.S. Pinto, A. Gonçalves, R.J.E. Martins, J.M. Loureiro, R.A.R. Boaventura, “Fish canning industry wastewater variability assessment using multivariate statistical methods,” Process Safety and Environmental Protection, 102, 263–276, 2016, doi:10.1016/j.psep.2016.03.016.
- A. Val del Rio, A. Pichel, N. Fernandez-Gonzalez, A. Pedrouso, A. Fra-Vázquez, N. Morales, R. Mendez, J.L. Campos, A. Mosquera-Corral, “Performance and microbial features of the partial nitritation-anammox process treating fish canning wastewater with variable salt concentrations,” Journal of Environmental Management, 208, 112–121, 2018, doi:10.1016/j.jenvman.2017.12.007.
- G.K. Kafle, S.H. Kim, K.I. Sung, “Ensiling of fish industry waste for biogas production: A lab scale evaluation of biochemical methane potential (BMP) and kinetics,” Bioresource Technology, 127, 326–336, 2013, doi:10.1016/j.biortech.2012.09.032.
- R. Gao, H.O. Nam, W. Il Ko, H. Jang, “Integrated system evaluation of nuclear fuel cycle options in China combined with an analytical MCDM framework,” Energy Policy, 114(December 2017), 221–233, 2018, doi:10.1016/j.enpol.2017.12.009.
- K. Govindan, S. Rajendran, J. Sarkis, P. Murugesan, “Multi criteria decision making approaches for green supplier evaluation and selection: A literature review,” Journal of Cleaner Production, 98, 66–83, 2015, doi:10.1016/j.jclepro.2013.06.046.
- C.H. Kuei, C.N. Madu, C. Lin, “Developing global supply chain quality management systems,” International Journal of Production Research, 49(15), 4457–4481, 2011, doi:10.1080/00207543.2010.501038.
- VK Sharma,P Chandana,A Bhardwaj, “Critical factors analysis and its ranking for implementation of GSCM in Indian dairy industry,” J. Manuf. Technol. Manag., 5(6), 911–922, 2014, doi:10.1108/JMTM-03-2014-0023.
- F. Dehghanian, S. Mansoor, M. Nazari, “A framework for integrated assessment of sustainable supply chain management,” IEEE International Conference on Industrial Engineering and Engineering Management, 279–283, 2011, doi:10.1109/IEEM.2011.6117922.
- K. Zimmer, M. Fröhling, P. Breun, F. Schultmann, “Assessing social risks of global supply chains: A quantitative analytical approach and its application to supplier selection in the German automotive industry,” Journal of Cleaner Production, 149, 96–109, 2017, doi:10.1016/j.jclepro.2017.02.041.
- F.T.S. Chan, N. Kumar, “Global supplier development considering risk factors using fuzzy extended AHP-based approach,” Omega, 35(4), 417–431, 2007, doi:10.1016/j.omega.2005.08.004.
- K. Shaw, R. Shankar, S.S. Yadav, L.S. Thakur, “Supplier selection using fuzzy AHP and fuzzy multi-objective linear programming for developing low carbon supply chain,” Expert Systems with Applications, 39(9), 8182–8192, 2012, doi:10.1016/j.eswa.2012.01.149.
- V. Mani, R. Agrawal, V. Sharma, “Supplier selection using social sustainability: AHP based approach in India,” International Strategic Management Review, 2(2), 98–112, 2014, doi:10.1016/j.ism.2014.10.003.
- S. Gold, A. Awasthi, “Sustainable global supplier selection extended towards sustainability risks from (1+n)th tier suppliers using fuzzy AHP based approach,” IFAC-PapersOnLine, 28(3), 966–971, 2015, doi:10.1016/j.ifacol.2015.06.208.
- K. Huwang, C.L., & Yoon, K.P “Multiple attribute decision making:methods and applications,” Springer-Verlag, 1981.
- T.C. Wang, T.H. Chang, “Application of TOPSIS in evaluating initial training aircraft under a fuzzy environment,” Expert Systems with Applications, 33(4), 870–880, 2007, doi:10.1016/j.eswa.2006.07.003.
- S. Senthil, B. Srirangacharyulu, A. Ramesh, “A robust hybrid multi-criteria decision making methodology for contractor evaluation and selection in third-party reverse logistics,” Expert Systems with Applications, 41(1), 50–58, 2014, doi:10.1016/j.eswa.2013.07.010.
- Sonia M. Lo1, James C. Chen, and T.-S.L. “RESPONSE TO DEMAND UNCERTAINTY OF SUPPLY CHAINS: A VALUE-FOCUSED APPROACH WITH AHP AND TOPSIS,” International Journal of Industrial Engineering, 25(6), 739–756, 2018.
- P. Kumar, R.K. Singh, “A fuzzy AHP and TOPSIS methodology to evaluate 3PL in a supply chain,” Journal of Modelling in Management, 7(3), 287–303, 2012, doi:10.1108/17465661211283287.
- A. Jayant, P. Gupta, S.K. Garg, M. Khan, “TOPSIS-AHP based approach for selection of reverse logistics service provider: A case study of mobile phone industry,” Procedia Engineering, 97, 2147–2156, 2014, doi:10.1016/j.proeng.2014.12.458.
Citations by Dimensions
Citations by PlumX
Google Scholar
Scopus
Crossref Citations
- Sana Elhidaoui, Khalid Benhida, Said Elfezazi, Siham Tissir, "Driving Lean Practices to Improve Procurement in Supply Chains Through Industry 4.0." In Industrial and Logistics Systems Design and Efficient Operation, Publisher, Location, 2025.
- Sana Elhidaoui, Srinivas Kota, Khalid Benhida, Said Elfezazi, "Industrial Green Supply Chain: A Conceptual Modelling Approach Based on Artificial Intelligence." In Impact of Industry 4.0 on Supply Chain Sustainability, Publisher, Location, 2024.
No. of Downloads Per Month
No. of Downloads Per Country